
Dogecoin (DOGE) rose slightly on Friday, with trading prices breaking through $0.1300, in line with the overall positive sentiment in the cryptocurrency market. After the release of the U.S. Consumer Price Index (CPI) data on Thursday, this well-known meme coin regained upward momentum.
According to data from the U.S. Bureau of Labor Statistics, the inflation rate in November increased by 2.7% year-on-year, lower than the market expectation of 3.1%; the core CPI, excluding energy and food prices, rose by 2.6% year-on-year, also below the expected 3%.
Dogecoin rose about 6% during the day, reflecting a recovery in investor confidence in risk assets such as cryptocurrencies. However, its derivatives market has shown relatively sluggish performance, which may put pressure on the ongoing recovery before the end of the year, and traders need to remain cautious.
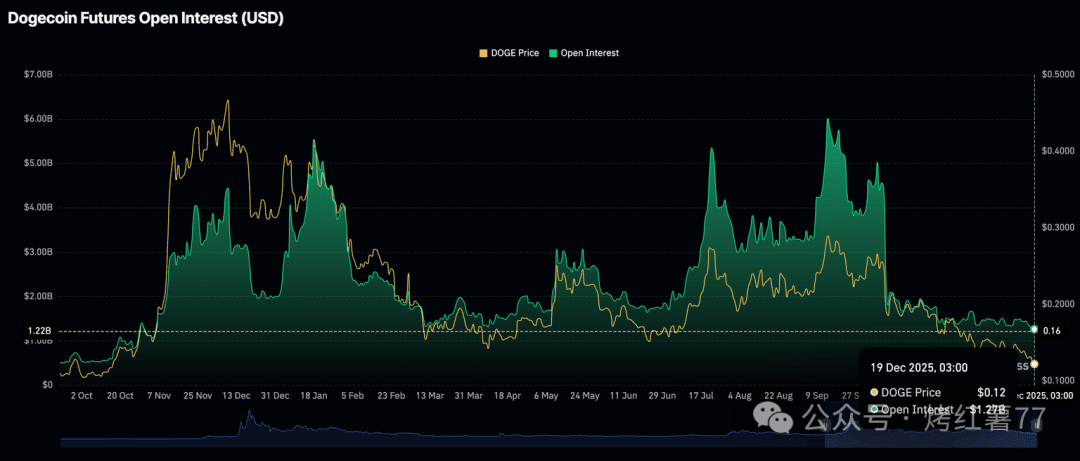
Currently, Dogecoin faces a dual challenge of weakening retail demand and insufficient institutional attention. Since the price flash crash on October 10, market interest has clearly cooled, with futures open interest significantly reduced from $4.4 billion by about 71% to $1.21 billion on Friday.
Previously, this indicator steadily rose to $6 billion as of September 14, during which the coin price also increased from $0.1298 in April to $0.3068, indicating that retail strength has a significant impact on price. The sharp contraction of open interest may pose a challenge to Dogecoin maintaining its current rebound.
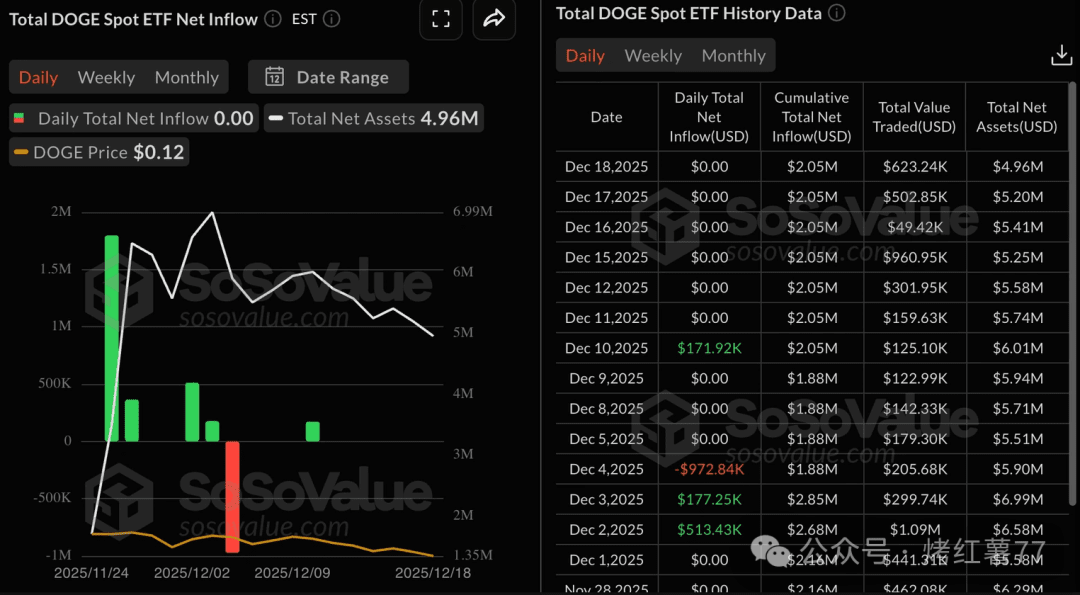
On the other hand, institutional interest in Dogecoin spot ETFs seems to be waning.
SoSoValue data shows that since the inflow of $172,000 recorded on December 10, there have been no new funds entering the related ETFs. The total net inflow is currently about $205 million, with net assets around $4.96 million. There are two Dogecoin spot ETFs approved for listing in the United States, namely Grayscale's GDOG and Bitwise's BWOW.
Technical Outlook: Can the rebound continue?
On Friday, Dogecoin was trading around $0.1300, with its 50-day, 100-day, and 200-day exponential moving averages all trending downward, indicating an overall bearish trend. The MACD indicator on the daily chart is slightly negative, with the blue line positioned below the signal line.
If it can break through the resistance of the 50-day moving average (currently around $0.1544), it may further test the 100-day moving average at $0.1745 and the 200-day moving average at $0.1909. The RSI on the same chart has rebounded to 38, indicating a reduction in bearish momentum.
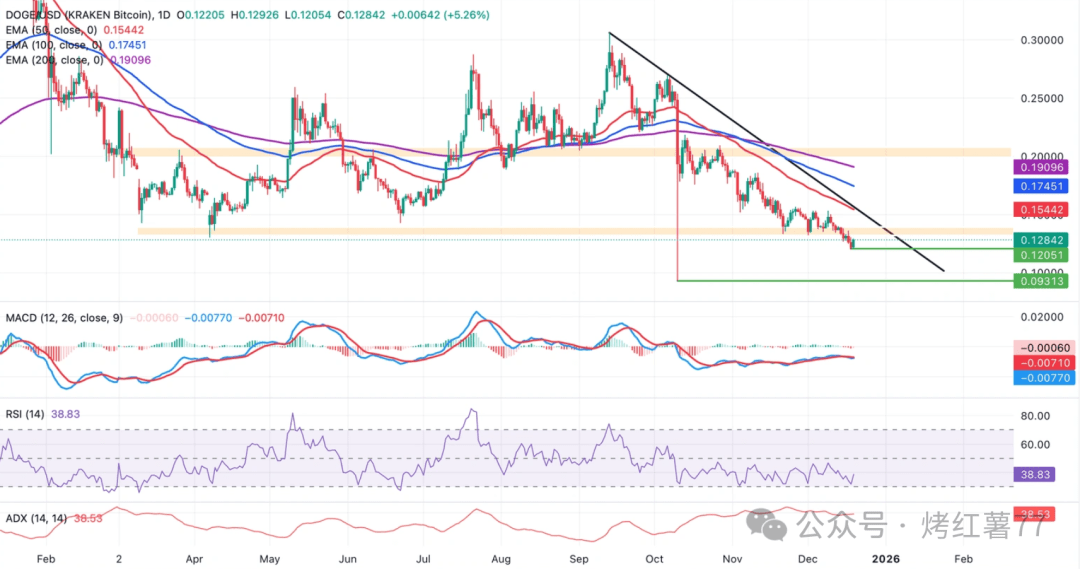
However, the descending trend line formed since $0.3063 still exerts pressure, with recent resistance around $0.1561. If the daily closing price falls below the support at $0.1205, the downtrend may accelerate again, with the downward target possibly pointing to the October low of $0.0931.
