

Ethereum is testing a historic monthly pivot near $2,930 that has guided price behavior across several market cycles.
Rejection from the upper range reinforces Ethereum’s broader range-bound structure rather than a sustained bullish trend.
Monthly closing levels remain the primary signal, outweighing short-term volatility and intraday price movements.
Ethereum is trading near a critical monthly support zone after a sharp corrective phase. Market focus has shifted toward higher timeframe structure, as analysts assess whether current levels can hold through December’s close.
Ethereum Faces a Pivotal Monthly Structure Test
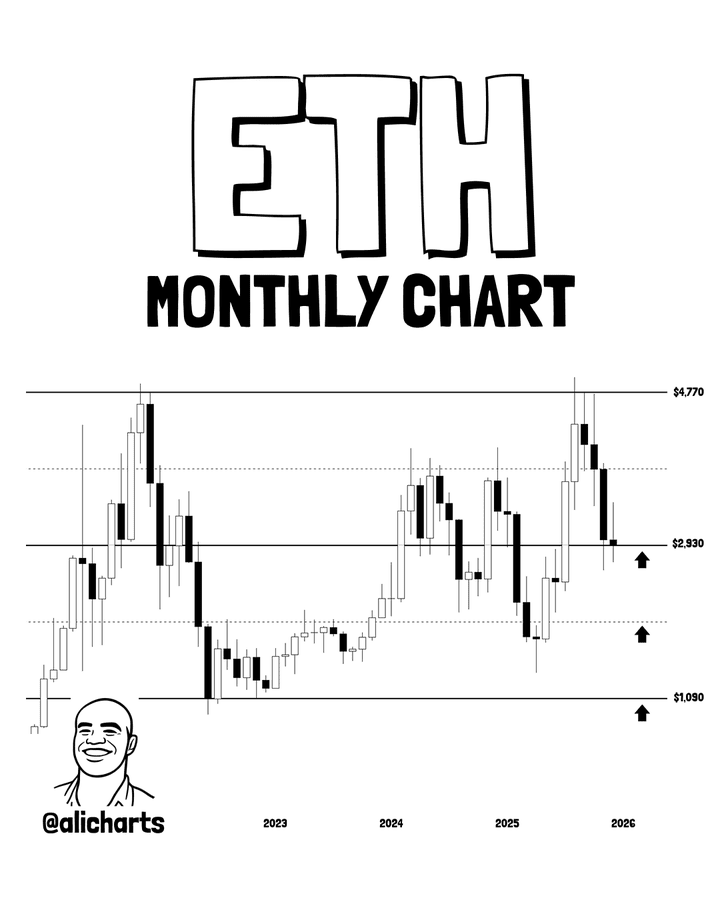
Ethereum is positioned directly at the $2,930 level, a zone respected across multiple historical cycles. According to a post from Ali Charts, this area has alternated between support and resistance over time. Price interaction here reflects structural positioning rather than short-term volatility. The current monthly candle suggests rejection following a failed attempt to hold higher ground.
 Source: X
The broader monthly range remains defined by resistance near $4,770 and support around $2,930. Each approach toward the upper boundary has historically triggered strong supply responses. Those moves were followed by extended retracements back into lower demand zones. Recent behavior mirrors that established historical pattern.
Ali Charts noted that acceptance below $2,930 would materially alter downside exposure. The chart shows limited intermediate support beneath this level. The next visible demand aligns near the $2,000 psychological zone. Below that, $1,100 represents the deepest structural support from prior cycle lows.
Breakdown Below $3,000 Reinforces Corrective Bias
Ethereum dropped from the $3,000 psychological mark after being repelled severally around $3,200. This action was preceded by a succession of downbeat highs that had been built up since mid-November. Selling pressure intensified once price failed to reclaim prior resistance. That breakdown accelerated downside momentum across shorter timeframes.
Volume patterns confirm seller conviction during the decline. Elevated activity accompanied sharp downside moves rather than muted retracements. Such behavior often reflects distribution rather than temporary liquidity-driven moves. As a result, recovery attempts continue to face overhead supply.
Short-term support is now concentrated between $2,850-$2,900. This area previously acted as consolidation during late November trading. A sustained defense could enable a technical rebound toward $3,000. However, acceptance above that level remains uncertain without stronger participation.
Sentiment and Trend Conditions are Still Restrictive.
Ethereum continues to trade below the 50-day moving average and the 200-day average. This alignment typically signals sustained downside pressure within trend analysis frameworks. When price remains below these averages, rallies often remain corrective. Broader market conditions continue to reinforce this posture.
Market sentiment indicators currently reflect elevated fear levels. Such environments often coincide with forced de-risking rather than structured accumulation. While fear can precede rebounds, confirmation remains absent. Price structure continues to guide risk management decisions.
The monthly close remains the dominant signal for higher timeframe participants. Intramonth wicks below $2,930 matter less without sustained acceptance. An end-month recovery of more than a thousand dollars would help to mitigate exposure to the downside. Up to this point, Ethereum is stuck at a structural crossroads.
The post Ethereum Tests $2,930 Monthly Support as Downside Risk Builds appears on Crypto Front News. Visit our website to read more interesting articles about cryptocurrency, blockchain technology, and digital assets.
