MACD (Moving Average Convergence Divergence) is one of the most popular indicators in technical analysis. It is loved by both beginners and experienced traders for its simplicity, clarity, and ability to show the direction of the trend, momentum, and potential reversal points.

📊What is MACD and what does it consist of
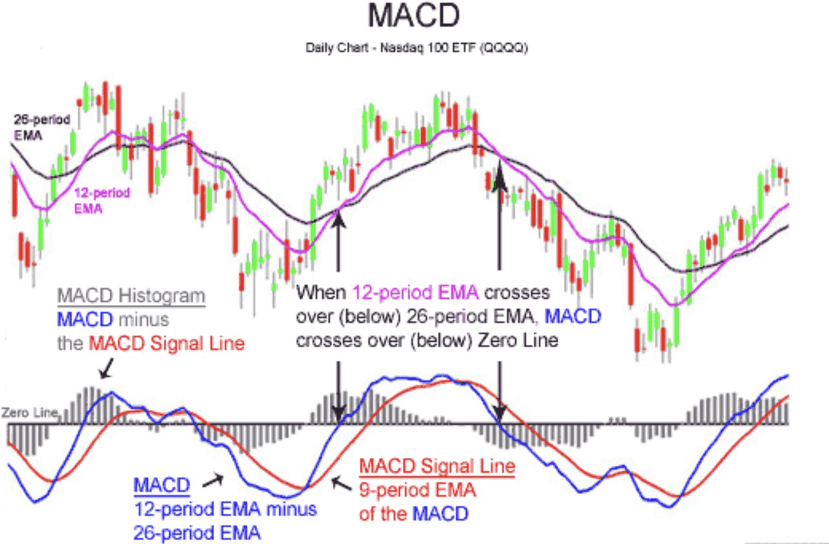
MACD consists of three elements:
1. MACD line — the difference between two exponential moving averages (EMA), usually 12 and 26.
2. Signal line — EMA of the MACD line (usually 9 periods).
3. Histogram — the distance between the MACD line and the signal line.
❗️ The idea is simple: when the fast average outpaces the slow one — momentum increases; when it lags — it weakens.
📊 How to read MACD signals
1️⃣ MACD and signal line crossover
• Bullish crossover (buy): MACD crosses the signal line from below to above
• Bearish crossover (sell): MACD crosses the signal from above to below
Tip: on higher timeframes, the signal is stronger but rarer.
2️⃣ Zero Line
• Above zero: market is in an uptrend
• Below zero: downtrend
Crossing zero often confirms a change in market phase.
3️⃣ Histogram — strength of momentum
• Bars are increasing - momentum is strengthening
• Bars are decreasing - momentum is weakening
This helps to see the loss of trend strength earlier, even before the lines cross.
🔄 Divergences are the most valuable signals
📉 Bearish divergence
Price makes a higher high, while MACD makes a lower one - a possible reversal down.
📈 Bullish divergence
Price makes a lower low, while MACD makes a higher one - a possible reversal up.
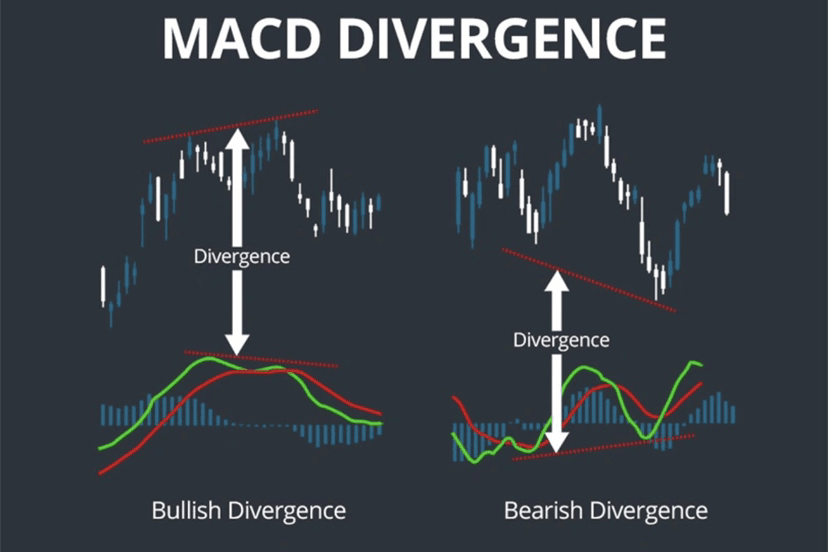

⚠️ Divergences work better:
• near support/resistance levels
• after a prolonged trend
⏱️ Timeframes and settings
Classic parameters: 12 / 26 / 9 — universal and suitable for most markets.
• H1–H4: a good balance between noise and accuracy
• D1: strong, but rare signals
• M5–M15: many false signals without filters
If you are working with hourly timeframes, MACD is particularly useful for confirming trends and filtering entries.
❓ How to trade MACD effectively
✔️ Combine with:
• Support and resistance levels
• Price Action
• RSI or Volume
❌ Do not use:
• as a single signal
• in a flat without trend filter
📌 Advantages and disadvantages
✅ Pros
• Simple and clear
• Works on any market
• It shows momentum well
❌ Cons
• Lagging (lagging indicator)
• Gives false signals in a flat
⚠️ Conclusion
MACD is not a 'magic button', but a powerful confirmation tool. It gives the best results when combined with market context, levels, and discipline.
📈 Moving average — does this classic tool still work in 2025?