

The information, opinions, and judgments regarding the markets, projects, currencies, etc. mentioned in this report are for reference only and do not constitute any investment advice.
Written by 0xWeilan
After the interest rate cut in September, some funds 'sold the fact' and left the market, leading to a regrouping of funds both inside and outside the market, which pushed BTC to 'start' a new round of increases, reaching a historical high of 126296.00 USD on October 6 (Coinbase quote, same below). However, this enthusiasm was interrupted on October 10 by the renewed escalation of the 'US-China tariff war'. BTC immediately plummeted, dropping to a low of 103516.75 USD within several trading days, a decline of over 18%.
Since then, with the consensus reached between the US and China during the APEC meeting, multiple confrontational measures have been suspended; the Federal Reserve also conducted its second interest rate cut of the year on October 29; combined with Q3 earnings reports that exceeded expectations, US stocks reached a new monthly high. However, BTC rebounded weakly, continuing to struggle at the 200-day average (the upper limit of the 'Trump bottom' at $110,000), this bull-bear dividing line. By the end of the month, it had already given back all the gains since July.
This month's BTC and crypto market trends are influenced by multiple intertwining factors such as improvements in macroeconomic liquidity, the US-China 'reciprocal tariff' war, cyclical sell-offs, and the outflow of main funds in the new cycle.
Currently, with the prospect of interest rate cuts experiencing new twists, risk appetite has not fully improved, and cyclical sell-offs (cyclic laws) have become the main force driving BTC trends. Without more economic and employment data support, if the risk appetite shifts to promote fund inflows and long-hand selling continues, once BTC effectively breaks below the bull-bear dividing line, a 'long liquidation' stampede may occur, significantly increasing the probability of the BTC cycle ending.
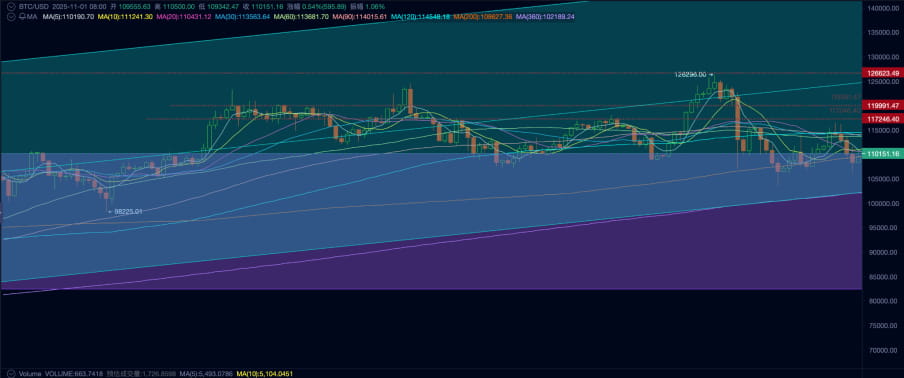
BTC price daily line
US-China 'reciprocal tariff' war: temporarily at a pause, but confrontation will exist long-term.
After the interest rate cut 'fact selling', BTC entered a new market trend as expected in early October.
On October 10, the US announced an 'additional 100%' increase in tariffs on certain imports from China and simultaneously threatened to impose export controls on 'key software'; global risk assets weakened, and the crypto market rapidly plummeted.
On the 24th and 25th, both delegations held talks in Malaysia. On the 30th, leaders of the US and China held face-to-face talks in South Korea, the venue of the APEC summit. Achievements include the US reducing the average tariff on China from about 57% to about 47%, China suspending a new round of rare earth restrictions for a year, resuming agricultural product purchases, and promoting fentanyl enforcement cooperation; however, deeper structural competition and confrontation issues remain unresolved. US stocks rebounded, while the BTC and crypto market suffered severe internal structural damage due to rapid declines, still consolidating at low levels.
The escalation of tariffs raises inflation and growth uncertainty, and the market is currently biased towards a 'strong dollar + real interest rate resilience' combination, compressing the risk appetite for high-beta assets (such as crypto). This is the transmission path of the US-China 'reciprocal tariff' war's impact on the crypto market.
Since the low point of 96.214 on September 18, the US dollar index has continued to rebound and has risen to 99.720 by the end of the month, and has not retreated due to the temporary easing of the 'reciprocal tariff war'. The suppression of risk assets caused by the dollar index has driven funds out of high-beta assets, and gold continues to rise.
Due to AI narratives and strong profit growth, the upward momentum of US stocks, especially tech stocks, has not been compromised. However, lacking fundamental support, BTC and the crypto market, which rely solely on emotional impulses and fund inflows triggered by consensus diffusion, are experiencing a continuous outflow of funds, leading BTC to record a monthly decline of 3.83%, significantly lagging behind the Nasdaq's monthly increase of 4.7%.
Although the leaders of both sides reached a public consensus, the certainty of a truce in the short term (within one year) is relatively high, but we should still be vigilant against tail events such as 'secondary taxation/secondary embargo'.
Federal Reserve interest rate cut: the probability of continued rate cuts has significantly decreased.
On August 23, Federal Reserve Chairman Powell clearly signaled a dovish turn at the Jackson Hole global central banking conference. The Federal Reserve successfully completed two 50 basis point rate cuts in September and October, temporarily alleviating anxiety in the US labor market and financial market fund pressures.
However, the interest rate decision meeting on October 29 showed clear signs of discord—two committee members opposed the interest rate cut decision. Powell emphasized in subsequent remarks that a rate cut in December is far from a foregone conclusion; the Federal Reserve will adopt a 'balanced approach' between rising risks of employment decline and persistent inflation. Subsequently, on the 30th, several Federal Reserve officials issued hawkish tones. FedWatch showed that the probability of a rate cut in December dropped by more than 30% within two days.
Due to sufficient pullback, BTC prices did not continue to decline in the last two days of this month, but BTC Spot ETFs recorded outflows over the two days, indicating that the market is still pricing down the probability of interest rate cuts.
If economic and employment data support cannot be obtained, the probability of a rate cut in December will continue to decline, and the overall market risk appetite will continue to deteriorate. Without other favorable factors to support it, BTC may struggle to find real support near the 200-day line. If it falls again into the 'Trump bottom' range (90,000~110,000), the market under the pressure of 'cyclical laws' may experience a 'long liquidation' tragedy.
Currently, the US government remains in a shutdown state, making it difficult for official economic and employment data to be released in a timely manner. Short-term traders are in a data vacuum and may be more inclined to sell crypto assets lacking intrinsic growth support.
Internal structure: long hands continue to identify and sell off.
In the EMC Labs 'BTC Cycle Multi-Factor Judgment Model', long-hand behavior plays a decisive role in the formation of cycles. This group sells off chips during cyclical rises and collects chips during cyclical declines, serving as both the 'stabilizer' of the market and the 'top creator'.
According to eMerge Engine data, the scale of long-hand selling in October reached 84,806 coins, the highest month of the year; the total sell-off by long and short hands reached 735,930 coins, also the highest of the year.
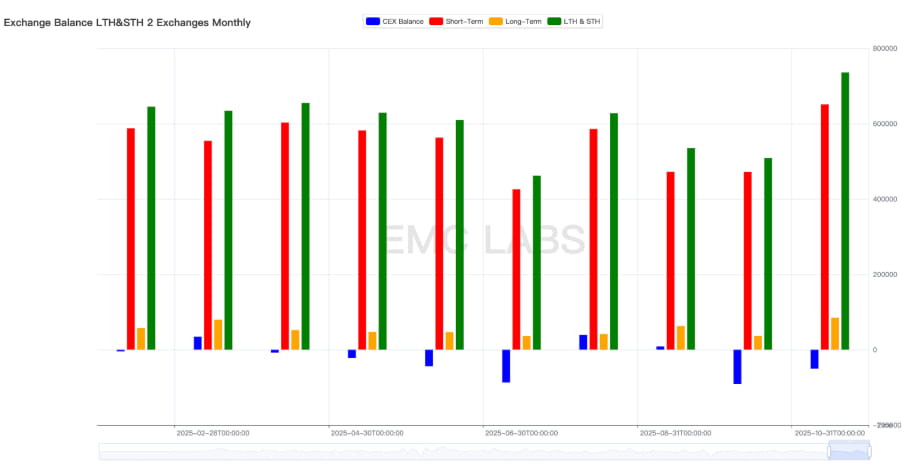
Long hands and short hands trading volume and exchange stock liquidity statistics (monthly)
This includes both the sell-offs during BTC's historic highs and the costless sell-offs during declines. This behavior of continuous large-scale sell-offs regardless of price increases or decreases aligns with the characteristics of long-hand behavior observed during price peaks in past cycles.
According to cyclical laws, BTC prices typically peak around 1050~1070 days after a cycle low; from November 21, 2022, to October 6 (the day BTC set its all-time high), exactly 1050 days have passed. This should be the fundamental reason for the continued tightening of long-hand selling.
In the future market, if prices rebound, long hands will likely continue to sell; if prices rebound weakly or decline, and long hands continue to sell, BTC will likely complete the construction of the cycle top.
Fund movements: buying power continues to fade
Any sustained upward trend requires continuous fund inflow support. Moreover, for most of the time, price increases are the second derivative of fund inflows; that is to say, not only is fund inflow necessary, but the funds must also accelerate inflow to drive price increases.
Over the past four months, the trend has been continuously deteriorating. Since March to June, with the easing of the US-China tariff war conflict, funds accelerated inflow, pushing BTC to set a monthly historical high, but since July to October, the inflow of funds has continued to slow down, shrinking to $9 billion by October. The continuously slowing fund inflow is unable to offset the long-hand selling pressure, leading to failed price surges, ultimately returning to the upper limit of the 'Trump bottom'.
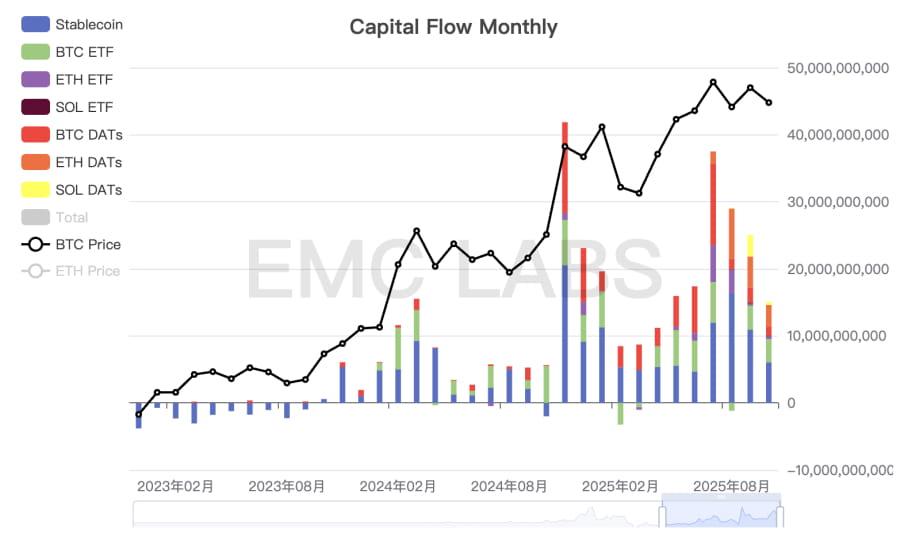
Monthly capital inflow in the crypto market
In the (September report), we analyzed that the impulse fund inflow driven by 'macroeconomic liquidity' and 'consensus diffusion' is the main driver of this round of bull market BTC price increase. This is clearly reflected in the on-chain price realization statistics.
The first round of large-scale fund inflows came from the approval of the BTC ETF, while the second round came from the election of the 'crypto-friendly president' Trump. From March to July 2025, this round of bull market saw the realization of the third scale of value, driven by the easing of the US-China trade war conflict and expectations of Federal Reserve interest rate cuts, but this inflow abruptly stopped after pushing BTC prices to $120,000.
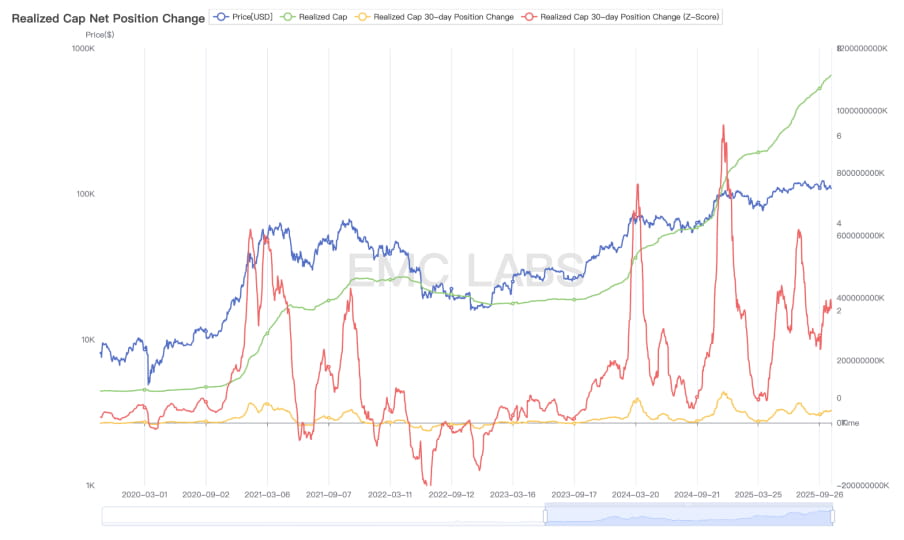
BTC on-chain value realization statistics
After restarting interest rate cuts, funds attempted to flow in again at the end of September, pushing prices up to $126,296. However, in October, due to the US-China conflict, the enthusiasm for fund inflows was curbed, combined with the Binance exchange's market makers triggering a series of liquidations due to USDe issues, ultimately leading to the entire market clearing nominal leverage exceeding $20 billion, causing severe damage to the internal structure of the crypto market.
After the structural changes in the market during this cycle, the bullish forces in this round of bull market are concentrated in three channels: DATs, BTC Spot ETF, and shark accounts. Currently, DATs are lacking buying power, BTC Spot ETFs are in a state of outflow, and only shark accounts continue to buy.
In the future market, if macroeconomic liquidity improves or policy benefits stimulate a return of bullish sentiment, the buying forces will regroup, and BTC still has the opportunity to regain upward momentum and set new highs. If sentiment continues to be low and funds accelerate outflow, BTC will likely finish this round of bull market in the fourth quarter.
Conclusion
As internal growth has not yet been established, the current crypto market is still in a game of fund inflows and long-handed investors' cyclical 'collect-sell' behavior triggered by 'macroeconomic liquidity + consensus diffusion'.
Currently, 'macroeconomic liquidity + consensus diffusion' is still ongoing, but the momentum has clearly weakened, while the long-handed group that believes in 'cyclical laws' continues to sell off according to principles. This game is pushing BTC prices for a downward rebalancing. In the old cyclical pattern, this is a typical performance of transitioning from a downward trend (bear market) during the conversion period.
'New cycle' patterns have not yet been defined, and we can only believe that the 'end' of the bull market is underway.
EMC Labs was established in April 2023 by crypto asset investors and data scientists. Focused on blockchain industry research and investments in the crypto secondary market, with industry foresight, insights, and data mining as core competitive advantages, it aims to participate in the booming blockchain industry through research and investment, promoting blockchain and crypto assets for the benefit of humanity.
For more information, please visit: https://www.emc.fund


