$AT Market Analysis with Logically and Explain
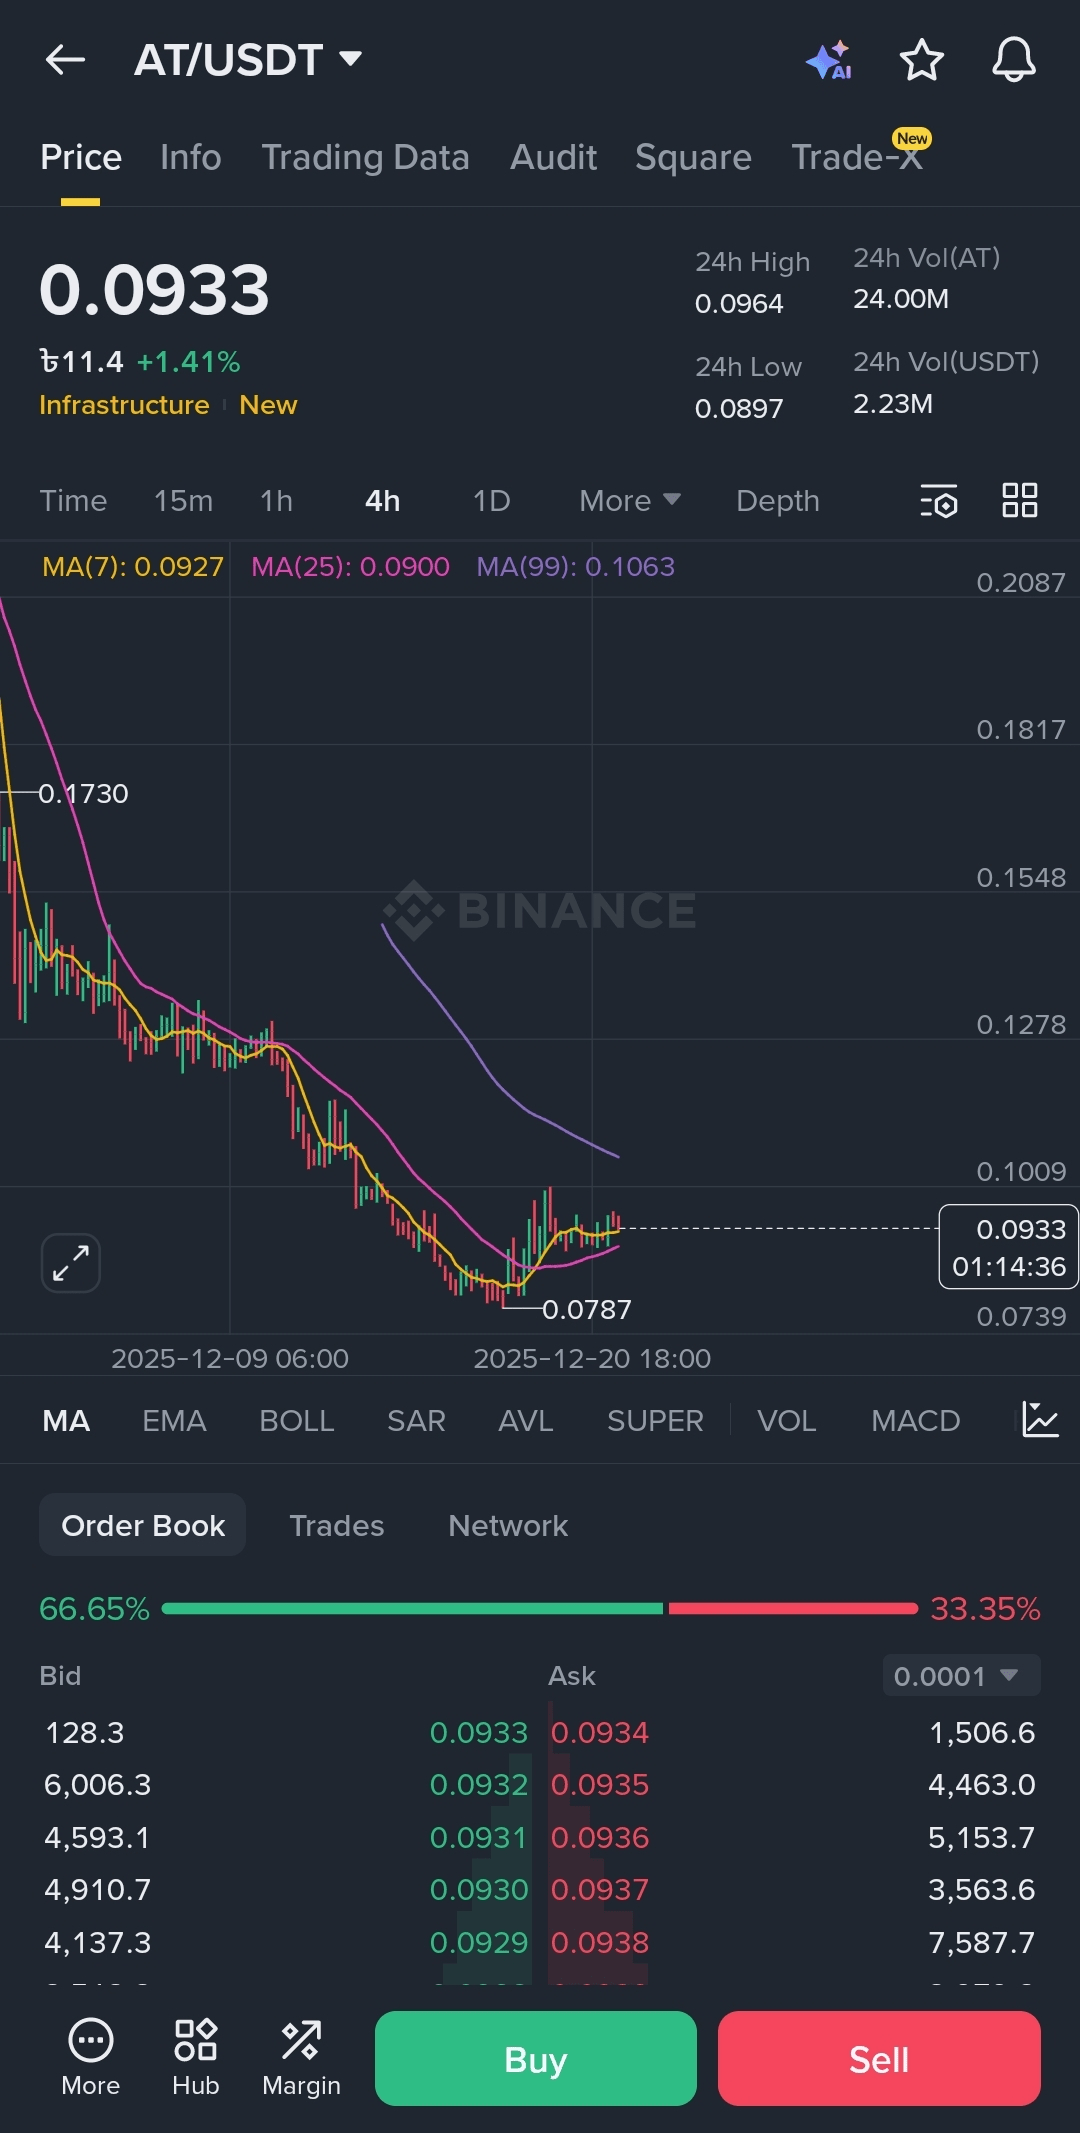
According to your chart (4-hour time frame), the market is currently attempting to recover after a significant downtrend.
Support Zone (Support Zone): * Major Support: $0.0780 - $0.0792. This is close to the token's all-time low. If the price falls below this zone, a larger crash or dump may occur.
Resistance Zone:
Immediate Resistance: $0.1000 - $0.1060. The purple line (MA 99) is currently near this level on the chart. Breaking this level is crucial for pumping the market.
Major Resistance: $0.1270. If it can rise above this, we may see significant movement.
Pump and Dump Potential (Price Targets)
1. Pump: If the price can close a candle above $0.1060 and volume increases, it could quickly pump to $0.1280 and then to $0.1550. This has the potential to yield a profit of about 30-60% from the current price.
2. Dump: If the market drops below $0.0890, it may return to its bottom at the $0.0790 level. If it breaks below $0.0780, there will be a risk of a new big dump.
Important Note (Risk Factor)
Volume: Currently, buy pressure is slightly increasing (66% bids are visible in your order book), which is positive.
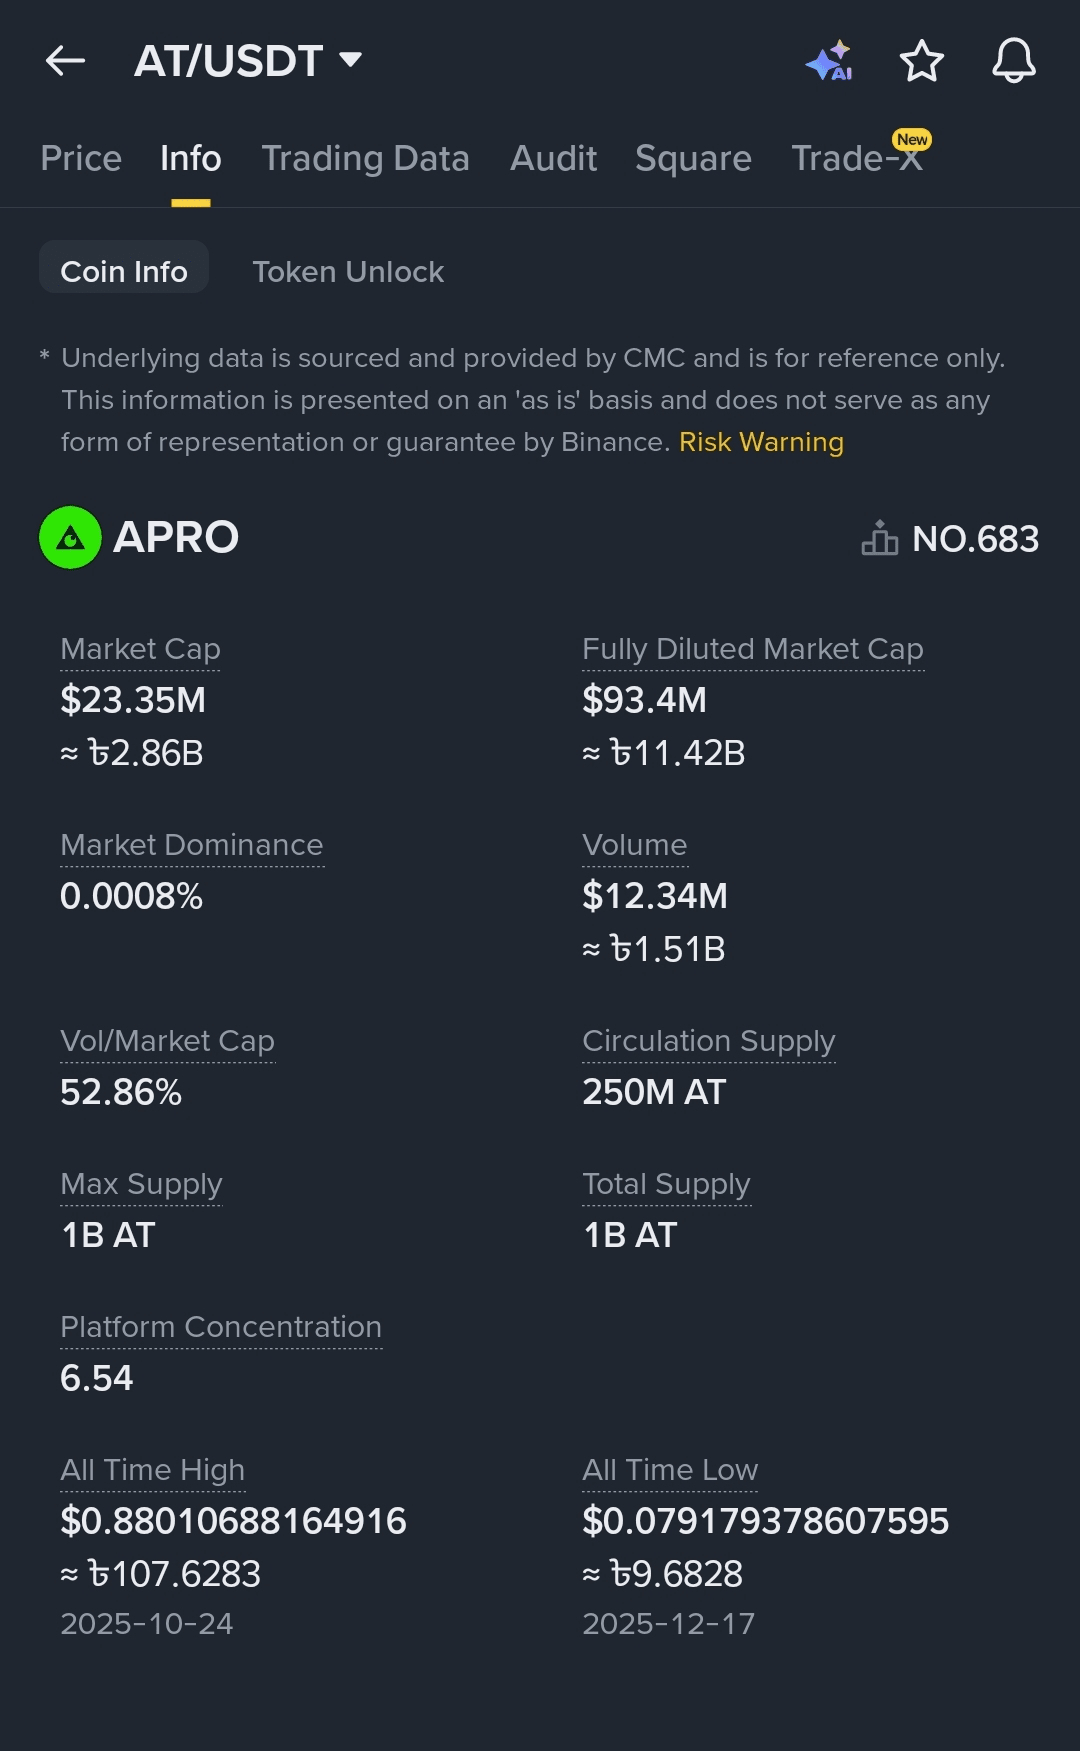
Supply: Only 25% of the token is in the market. If there is a major 'token unlock' in the future, the price may dump.
Advice: Always use stop loss before taking any trade. Your stop loss may be safe if set below $0.0880.