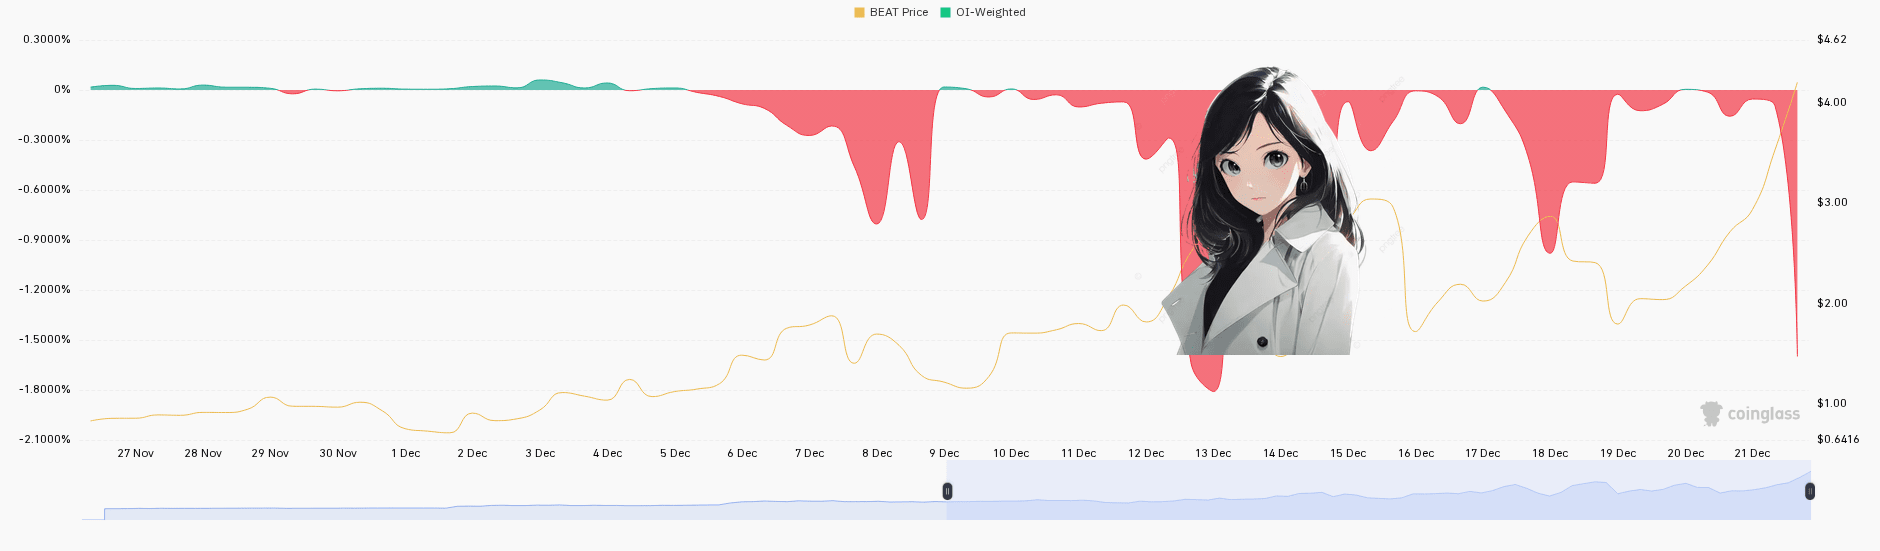
Oh my, this BEAT is really making the brothers "heartbroken" lately! Look at the overall chart, it just had a "fly up" from below $1 to nearly $4 like a rocket. Whoever caught this wave must be "grinning" and celebrating early. But pay attention to the OI-Weighted indicator, it just turned green and then immediately dropped a pile of red right at the peak price near $4, just like there's some movement! This is a sign of profit-taking or a tremendous selling pressure coming down.
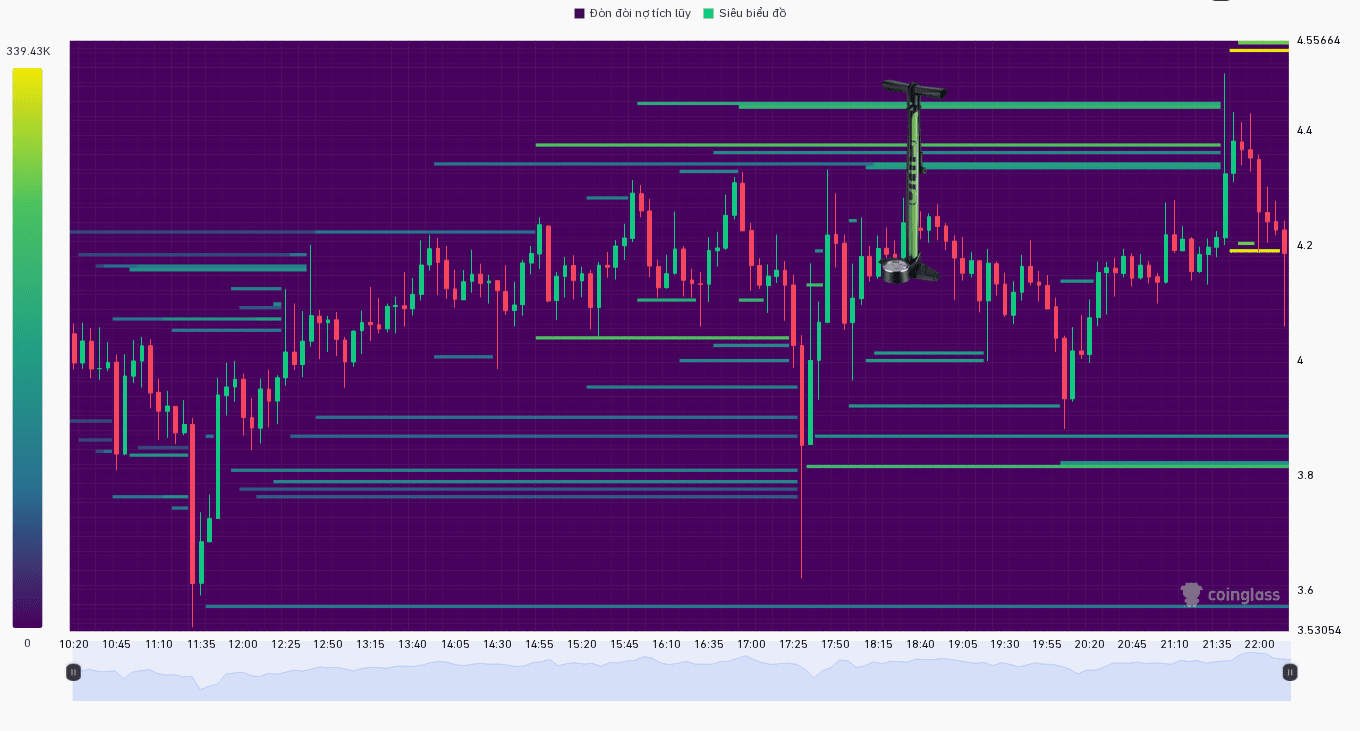
Looking at the smaller chart, it is indeed fluctuating wildly. The price just had a "slip" from 4.4 down to around 4.1-4.2. Several red candles appear continuously, clearly indicating strong selling pressure or profit-taking is happening. The bright green and yellow horizontal lines on that chart are important support levels.
Currently, the price is hovering around 4.2. If it cannot hold these levels and drops further, be careful because a "roller coaster" back to the old station could really happen! Those holding should be cautious, as if it "turns around", it could be painful. For those who haven't entered yet, just stay calm; this stock is moving too fast right now, entering at this moment is likely to get "caught off guard"!
#BEAT #FollowMePls #Like the post #Thank you #ABB920 #Tips