$BANK #LorenzoProtocol $BAN @Lorenzo Protocol
The cryptocurrency market always contains complex developments, where prices reflect not only simple supply and demand but also the interplay of sentiment, expectations, and sophisticated investment strategies. With BANKUSDT trading at 0.04624 USD, we are witnessing an impressive price growth in recent days, particularly after a period of stable accumulation. However, diving deeper into the on-chain metrics reveals a more nuanced picture, where price optimism is accompanied by volume trading signals that require careful analysis. This creates a complex market scenario, where the impressive price growth of BANKUSDT is overshadowed by volume trading signals indicating significant net selling pressure. Such a disconnect raises a crucial question for individual investors: Is this a serious investment move based on real value, or just growth driven by short-term speculative factors, which may pose challenges regarding liquidity and sustainability.
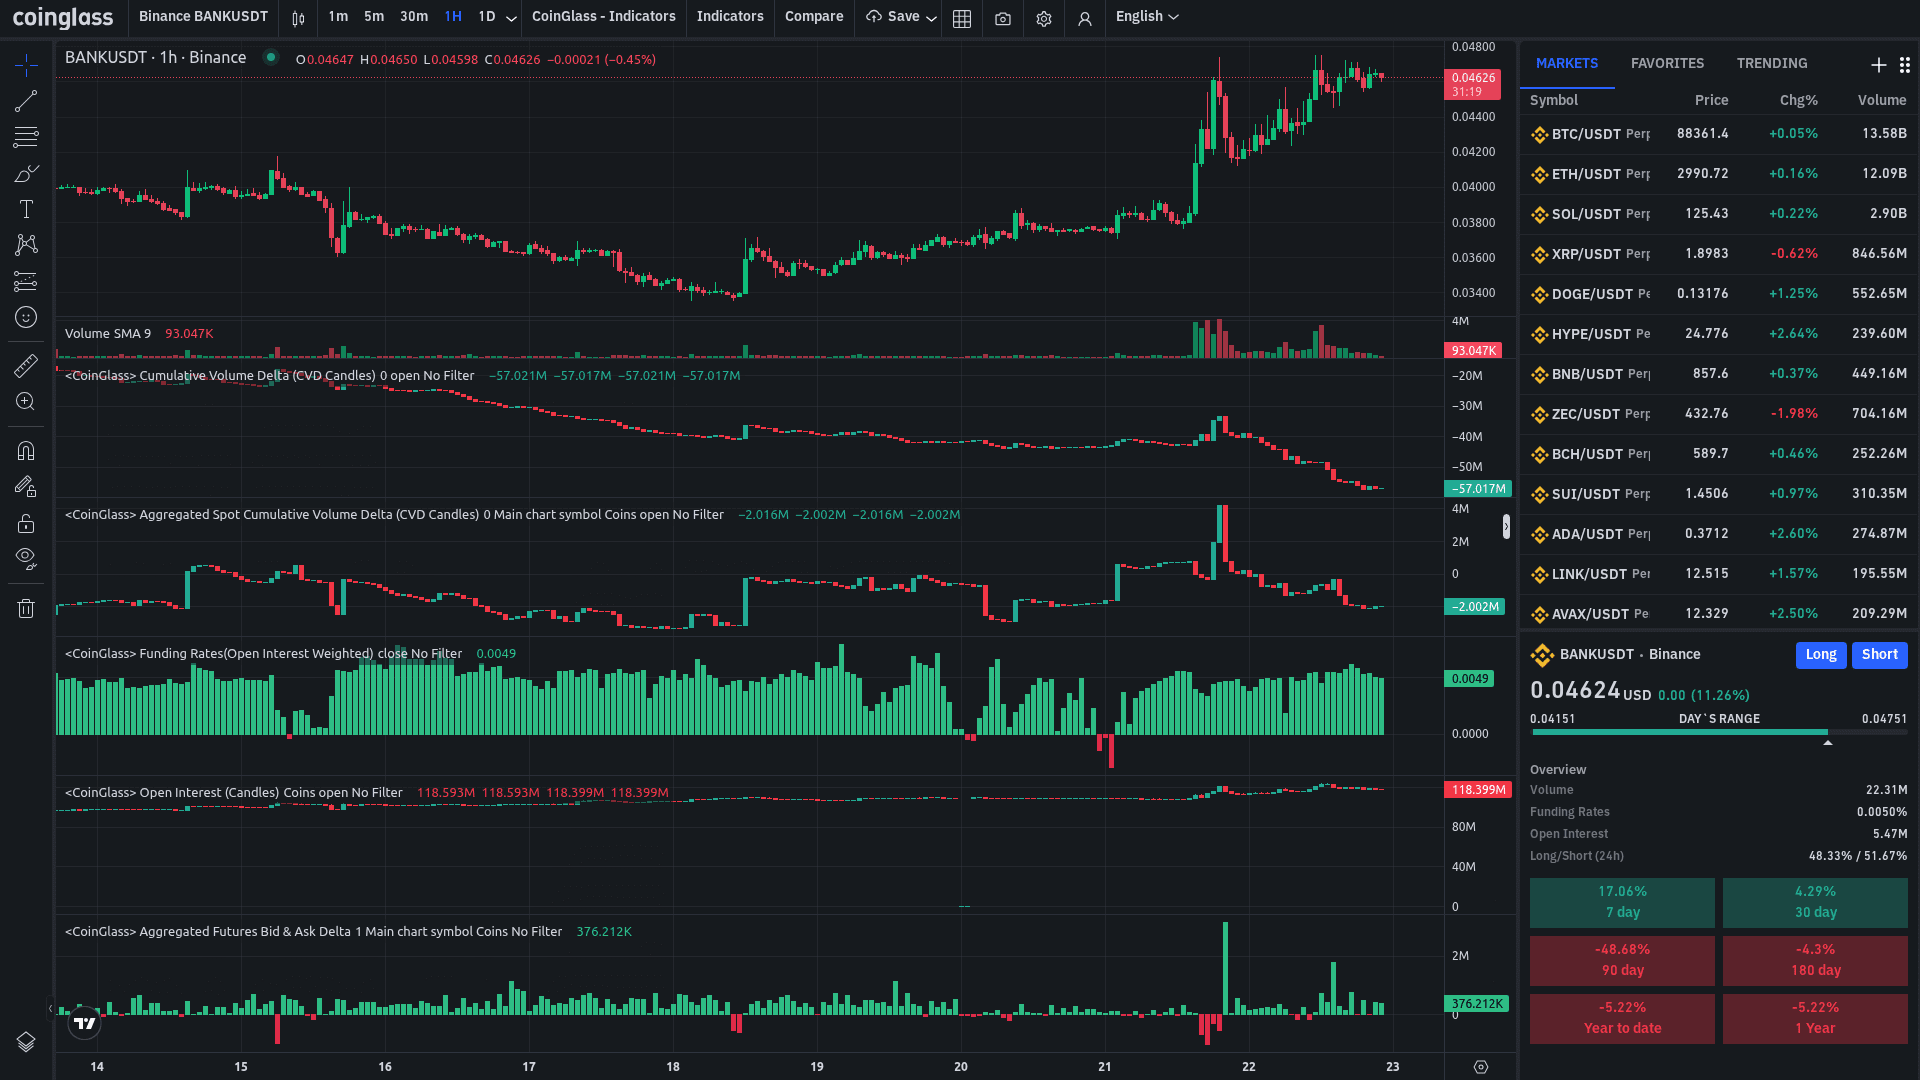
The recent price increase of BANKUSDT is undeniable, bringing this token to new local peaks, indicating strong market interest. Trading volume also recorded significant increases during breakout phases, reflecting lively trading activity. However, looking at the Cumulative Volume Delta (CVD), an indicator measuring the difference between buying and selling volume at market prices, the picture becomes complicated. The CVD in the derivatives market has sharply decreased, from around -20 million USD to -57.021 million USD. This implies that, despite rising prices, most futures trading is leaning towards selling at market prices. Similarly, the CVD in the spot market remains negative, fluctuating around -2.016 million USD, although there are certain bright spots in the recent uptrend. The divergence between rising prices and negative CVD can be interpreted in various ways: one, the price increase may not be supported by overwhelming market buying, but rather due to large limit buy orders being filled or due to selling liquidity being effectively absorbed by large entities without causing prices to drop.
However, the picture becomes more complex when we consider the Funding Rate, the periodic fee that buyers or sellers pay to each other in the derivatives market to keep futures contract prices close to spot prices. A significantly positive Funding Rate, currently at 0.0049, indicates that long positions are paying fees to short positions, a traditional signal of dominant optimistic sentiment in the derivatives market, as most investors anticipate prices will continue to rise. At the same time, Open Interest, the total number of outstanding derivatives contracts, has significantly increased to 118.399 million USD during the price rise. This increase suggests that new capital is flowing into the derivatives market, primarily with new long positions being opened, based on the trend of the funding rate. The combination of a positive Funding Rate and high Open Interest is often a sign of a price rally supported by speculation. When placed alongside the negative CVD, we see an interesting point: investors may actively be opening long positions in anticipation of price increases, but the selling volume is coming from market makers or profit-taking traders, helping them absorb buying pressure without causing large price fluctuations. This indicates a delicate liquidity tug-of-war is taking place.
Moreover, the Aggregated Futures Bid & Ask Delta index of 376.212K reinforces the observation of strong buying pressure on the Ask side, meaning that investors are willing to buy futures contracts at higher prices, indicating a market sentiment leaning towards positivity in the short term. With Open Interest at such a high level, the market is accumulating a significant amount of leveraged positions. This means that a strong price movement in either direction could trigger significant liquidation events, creating a domino effect that causes prices to fluctuate more, especially if there is a sudden change in market sentiment. This is a characteristic of a highly volatile market, where price movements reflect not only supply and demand but also the triggering of liquidation thresholds. However, whether this is a sustainable support or just a temporary excitement remains an open question that individual investors need to monitor closely.
Overall, the on-chain data of BANKUSDT paints a picture of selective optimism. Strong price momentum, positive Funding Rate, and increasing Open Interest indicate a significant amount of capital and confidence flowing into the derivatives market, reinforcing expectations of rising prices. However, the negative Cumulative Volume Delta index across both the spot and derivatives markets reminds us of underlying selling pressure or a complex price mechanism being established, where growth does not come from uniform overwhelming buying of the market. This suggests that a significant portion of the upward trend may result from the absorption of selling liquidity by large entities or price adjustments in a market with uneven depth.
For individual investors, this is a time that requires caution and a strategic observation. Two main scenarios could unfold: First, if the net selling pressure is indeed being absorbed by long-term vision investors, then this could be a phase of building a solid foundation for more sustainable growth in the future. Second, if the upward trend is primarily driven by leveraged speculation, the market could be vulnerable to price corrections or widespread liquidations, leading to strong volatility. Focus on monitoring changes in market structure, especially the balance between Funding Rate, Open Interest, and volume indicators. A sudden reversal of the Funding Rate from positive to negative or a rapid decrease in Open Interest while prices are flat or declining could be a warning signal to pay attention to.
Good trades do not need to be flaunted; trades that are flaunted often turn out to be traps. This is not an investment advice. Please conduct your own research and make your own investment decisions.