
Lesson two: Time frames (15 minutes vs Daily)
---
After we understood in the first lesson: ✔️ What is the chart
✔️ What are the candles
✔️ What is support and resistance
Today we move to a very essential step in reading the market 👇
Timeframe
---
⏱️ What is the time frame?
It is the frame in which we see the price movement.
Means:
15-minute candle = each candle represents 15 minutes of trading
Daily candle = each candle represents a full trading day
---
🟡 First: 15-minute frame (15m)
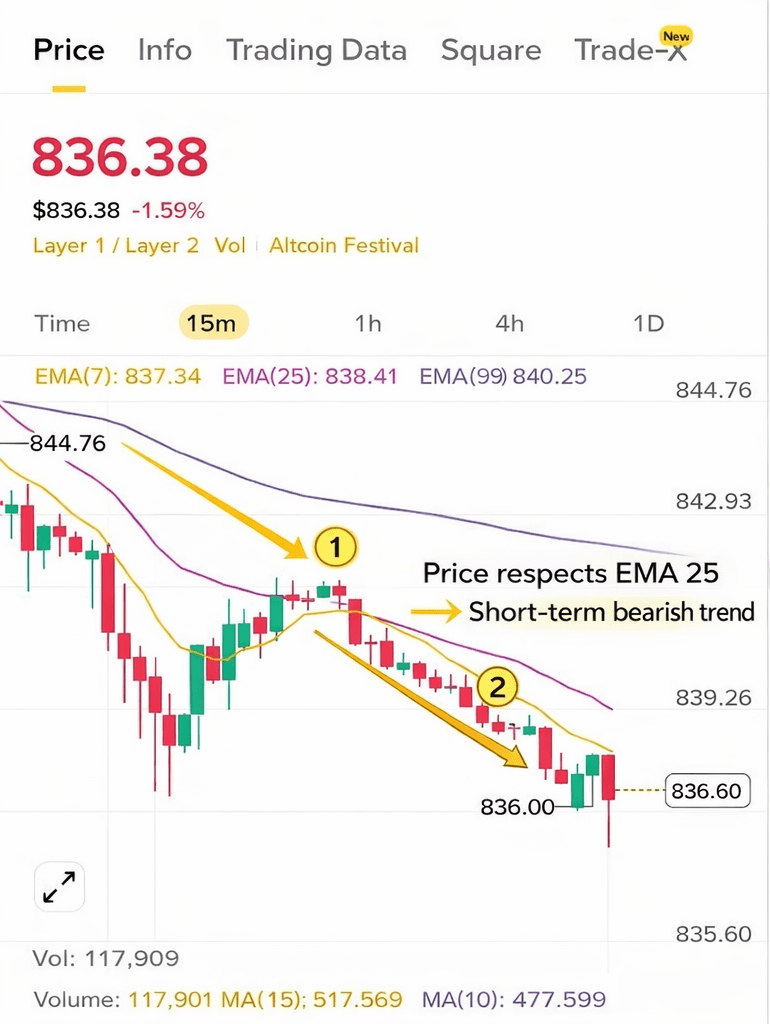
This frame:
Clarifies rapid movement
Filled with noise and volatility
Suitable for quick trading
Many signals… and much deception
💡 Useful for entry, but dangerous alone.
---
🔵 Second: Daily frame (1D)
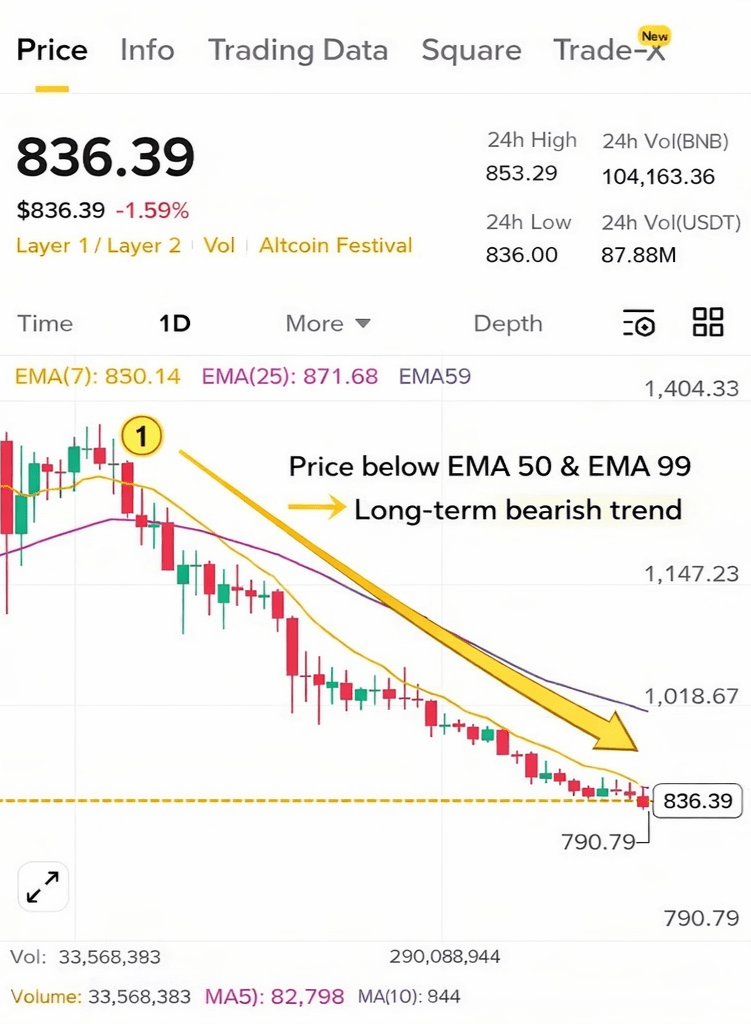
This frame:
Clarifies the true direction
Reduces noise
Determines whether the market is bullish or bearish
The basis of any smart decision
💡 The daily = the map
💡 15 minutes = the way
---
⚠️ Common mistake
Many people: ❌ See 15 minutes
❌ Enter buy
❌ And the daily is already bearish
And the result?
Loss + stress + random decisions.
---
✅ The golden rule
> The direction is taken from the large frame
And the entry is adjusted from the small frame
It means:
Determine the direction from the daily
Enter from 15 minutes
Do not reflect the market
---
🧠 Simple example:
If:
Daily bearish ❌
And 15 minutes gave you a buy signal
📛 The signal is weak
📛 The probability of failure is higher
But if:
Daily bullish ✅
And 15 minutes gave you a correction then a rise
📈 Here the decision is stronger.
---
🎯 Summary
The small frame without the large one = loss
The large without the small = bad entry
Combining them = conscious trading
---
🔜 Next lesson:
How do we determine the general direction?
(Peaks – troughs – breaking the trend)
Link to the first episode: Understand the market before trading
