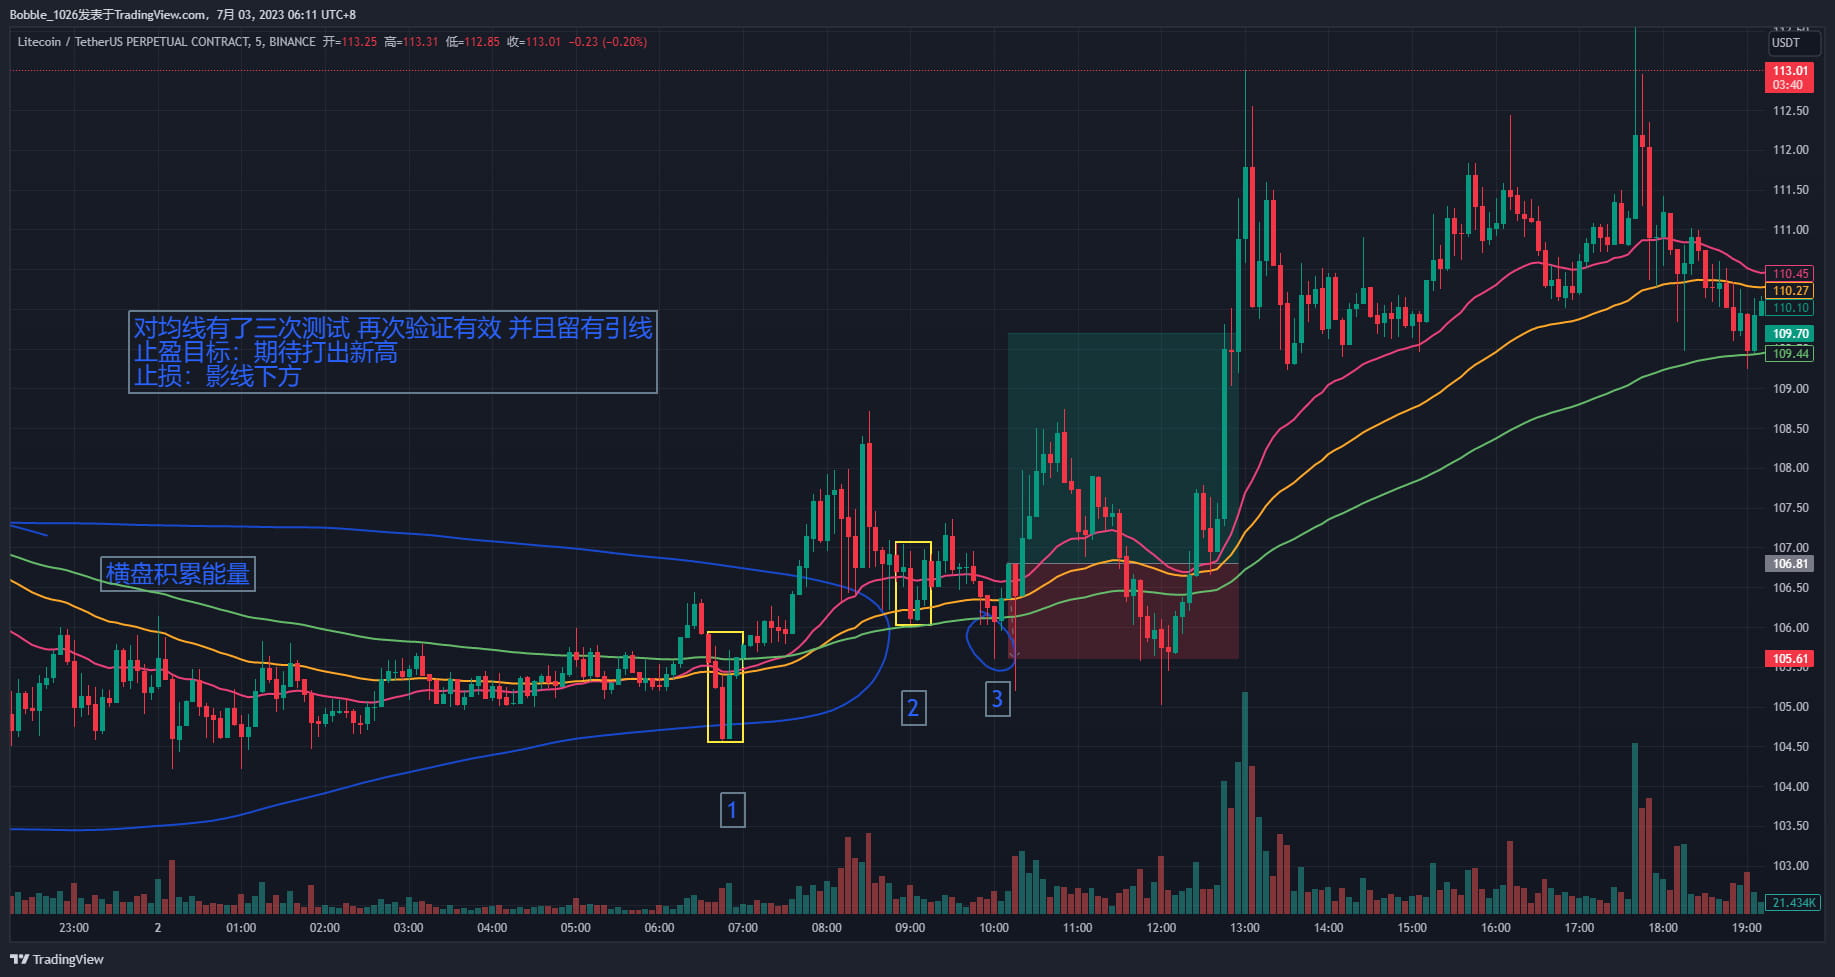
#LTC After getting up yesterday morning, I looked at the bitcoin market first. It was still sideways. I was going to do some alt contracts with relatively high volatility recently. I found that LTC had been sideways for a while, and I expected a wave of market yesterday. I looked at the moving average arrangement first, and it never fell below. I waited for another test to go long. The 5-minute line at 10:00 left a lead. I first tested the moving average, and then the lead was relatively long. Then a strong positive line appeared. I thought the support was effective, so I put the stop loss below the shadow line, and prepared to run when it hit a new high. I never expected that the second K-line would quickly test the moving average again, sweep away the stop loss, and then rise.

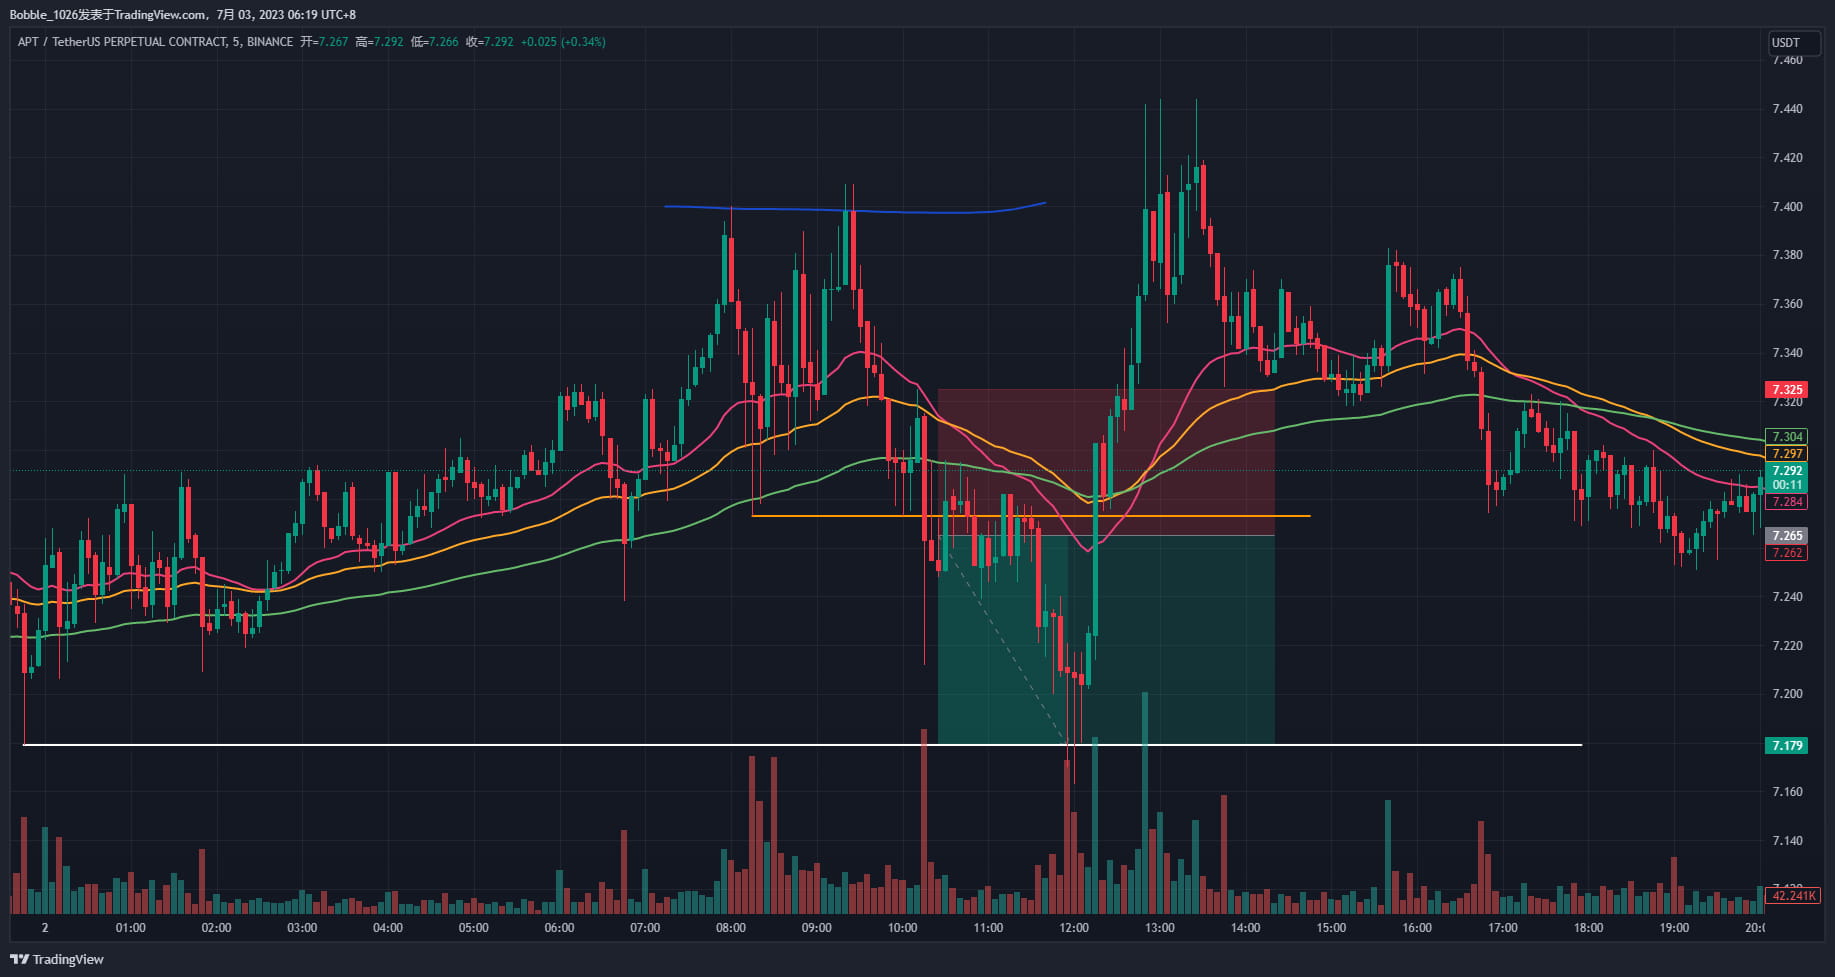
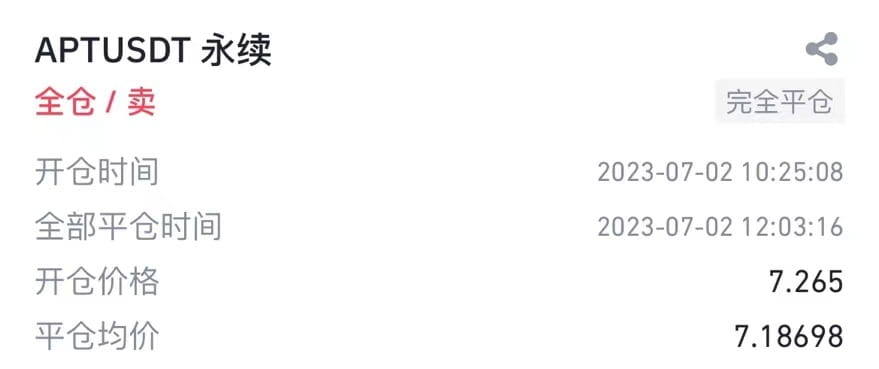
#APT After LTC stopped loss, the market fluctuated greatly. APT was observed to have a double top, and it fell below the neckline in 5 minutes. A long upper shadow line tested the neckline and it was expected to move in an M shape. The take profit was placed at a low point below because I thought it would be a defensive position for the bulls and it would probably stop the bulls.
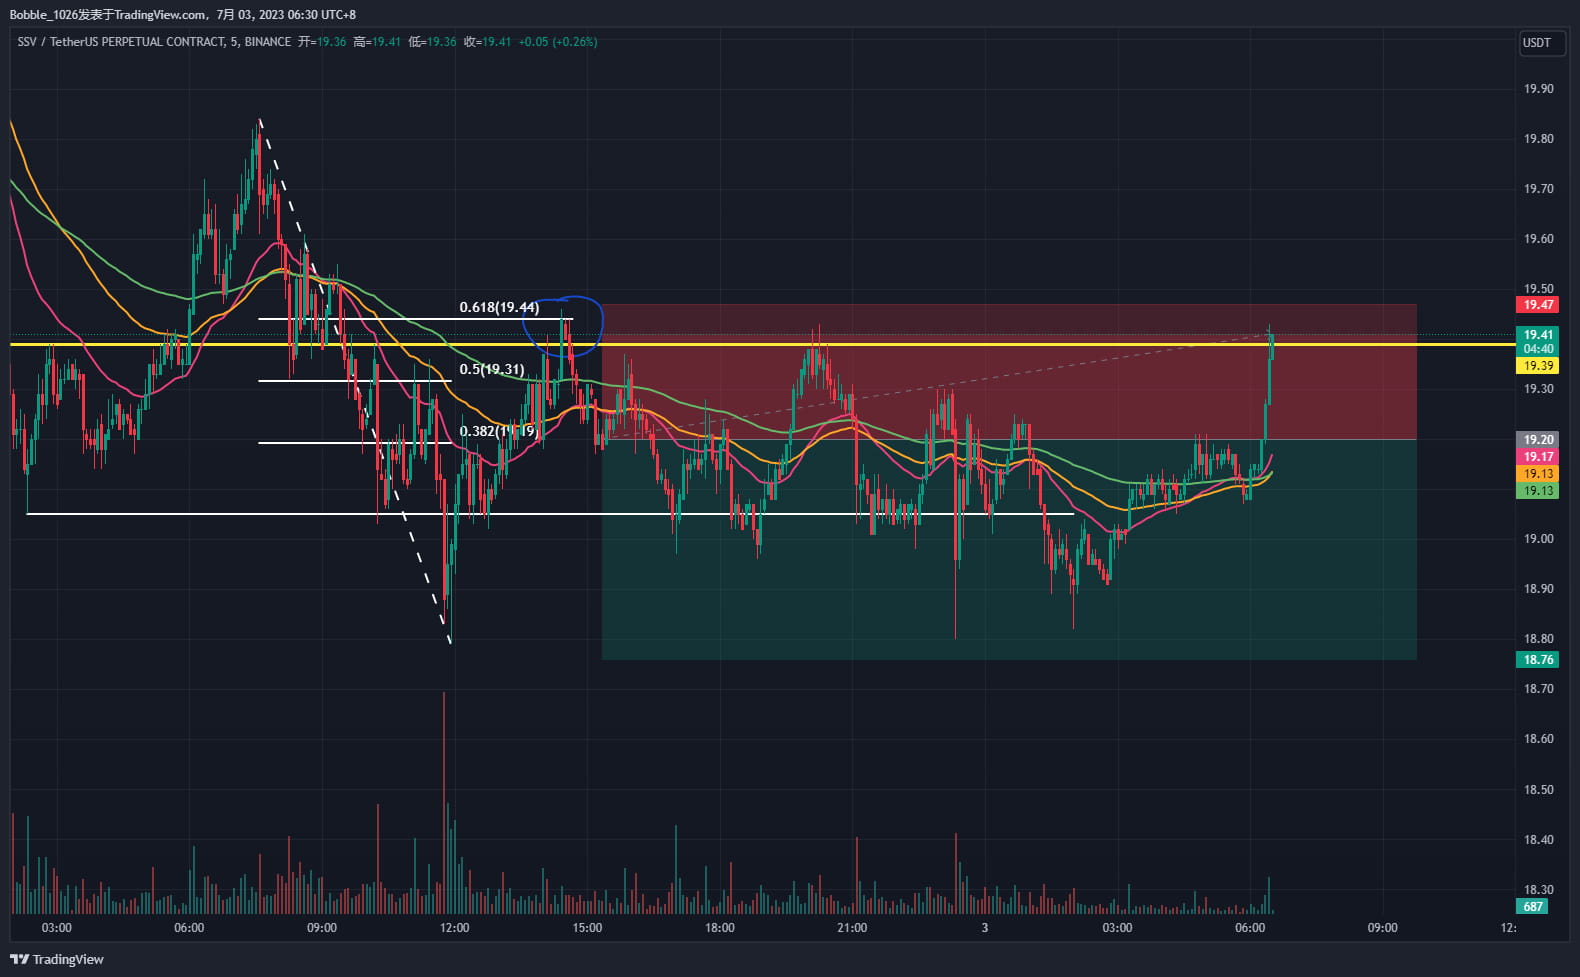
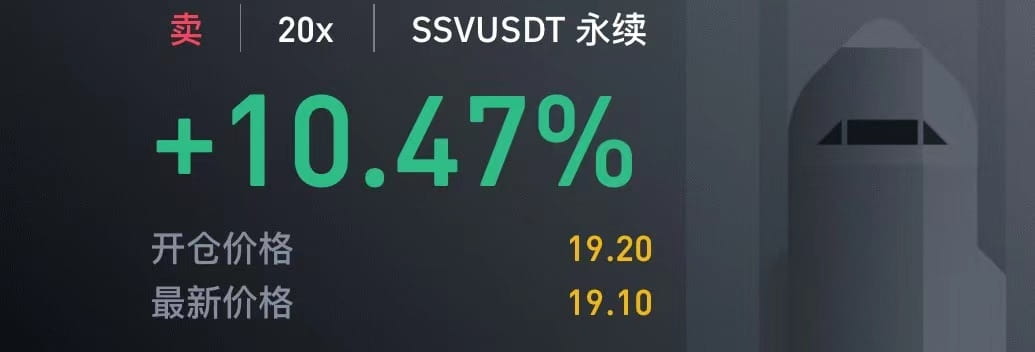
#SSV After shorting APT and taking profit, I was looking for the next target to short. I found that SSV just rebounded to 0.618, which showed a downward trend. I expected to short SSV. Take profit at the lower low point to sweep the longs, and stop loss at the previous high point. It is expected that a downward trend line will appear, so the previous high cannot be broken. This time the market went very badly, and it almost did not reach the take profit position, and then it started to go sideways. It is expected to leave before 8 o'clock today. It seems that I have to stop loss now.
Please follow me, I have all the targets you want. Leave a message in the comment section about the targets you want to see!