
Summary
Macro data across employment, inflation, and PMIs signal a synchronized slowdown, with the unemployment rate breaching the Fed's 4.4% forecast and raising concerns that markets may pivot from "bad news is good news" to pricing genuine recession risk.
Amid heightened geopolitical uncertainty, silver surged over 10% in a week to break USD 65/oz—driven by its dual role as an inflation hedge and indispensable industrial input for AI infrastructure—while cryptos, despite similar dual attributes, failed to attract comparable enthusiasm.
Year-end seasonality analysis shows BTC historically delivers an 80% win rate in the week before Christmas, weakens into a low-liquidity "noise regime" through New Year's, then rebounds with 60% odds and +5% average gains in early January—a pattern mirrored by equities but with crypto exhibiting greater alpha during the reopening window.

Market Overview
In the face of multiple converging risk events, the crypto market is undergoing a profound valuation correction and a reshaping of risk appetite. Although the Federal Reserve executed its third rate cut of the year as scheduled and unexpectedly announced additional asset purchase plans—signals that were broadly dovish—market attention has decisively shifted toward more pressing structural risks and macroeconomic uncertainties.
The following six key factors are currently dominating this week‘s market sentiment:
1. Monetary Policy: Dark Clouds from the East
The expectation that the Bank of Japan (BoJ) will raise interest rates to 0.75% this Friday hangs over risk assets like the Sword of Damocles. This has intensified systemic fears regarding a reversal of the Yen Carry Trade. While our previous analysis suggested the actual impact might be contained, in the current fragile sentiment, this expectation remains a primary source of pressure.
2. Global Central Banks: Leaning Hawkish
This week is a "Super Central Bank Week," besides BoJ all has shown somewhat hawkish tendencies:
Bank of England (BoE): Cut rates as expected, but with hawkish dissent. As rates approach neutral levels, the scope for future easing is limited, causing the GBP to spike.
European Central Bank (ECB): Maintained rates. President Lagarde reiterated a "meeting-by-meeting" approach with no pre-set path. Internal divisions regarding future cuts resulted in a hawkish hold.
Bank of Mexico (Banxico): Cut rates by 25 bps to 7.00%, but offered hawkish forward guidance.
3. US Economic Data: Concentration of Repricing Risk
The release of the full November Non-Farm Payrolls (NFP), partial October data revisions, PMI, Retail Sales, and CPI this week constitutes a concentrated repricing of the US economy's health. Data available as of Thursday suggests a weakening trend, reigniting concerns over economic deceleration.
4. Equity Market Liquidity: The Buyback Blackout
December 19th (this Friday) marks the end of the US stock buyback season. Thereafter, the vast majority of US corporations will enter the pre-earnings "Blackout Period." This implies that approximately $6 billion in daily buying demand from corporate repurchases will vanish, removing a critical pillar of market liquidity.
5. Derivatives Market: The Quadruple Witching Pivot
December 19th is also the final "Quadruple Witching Day" of 2025. It is expected that up to $7 trillion stock index futures, stock index options, stock options, and single stock futures will expire simultaneously. Fund managers and institutional traders must decide whether to close out positions or roll them over. With the Christmas holiday approaching and corporate buybacks exiting, markets will rapidly transition into a low-liquidity regime. Consequently, significant de-risking or the addition of downside protection before Friday is an expected trend.
6. Regulatory Disappointment over CLARITY Act Delay
The hearing for the crypto market structure bill (CLARITY ACT), originally scheduled for this month, has been postponed to early 2026, triggering market disappointment. Unresolved issues remain regarding jurisdiction, DeFi regulation, and consumer protection standards.
Despite recent optimism from Banking Committee Chair Tim Scott, Senator Lummis noted that staff are "exhausted." Analysts warn that if negotiations drag past February 2026, the bill risks getting "stuck" for the remainder of the year as the midterm election cycle dominates the congressional agenda.
Without the passage of this legislation, it remains highly difficult for the crypto market to attract institutional capital inflows at a greater magnitude of scale.
Figure 1: Weekly and YTD Performance – Crypto and Global Market Assets
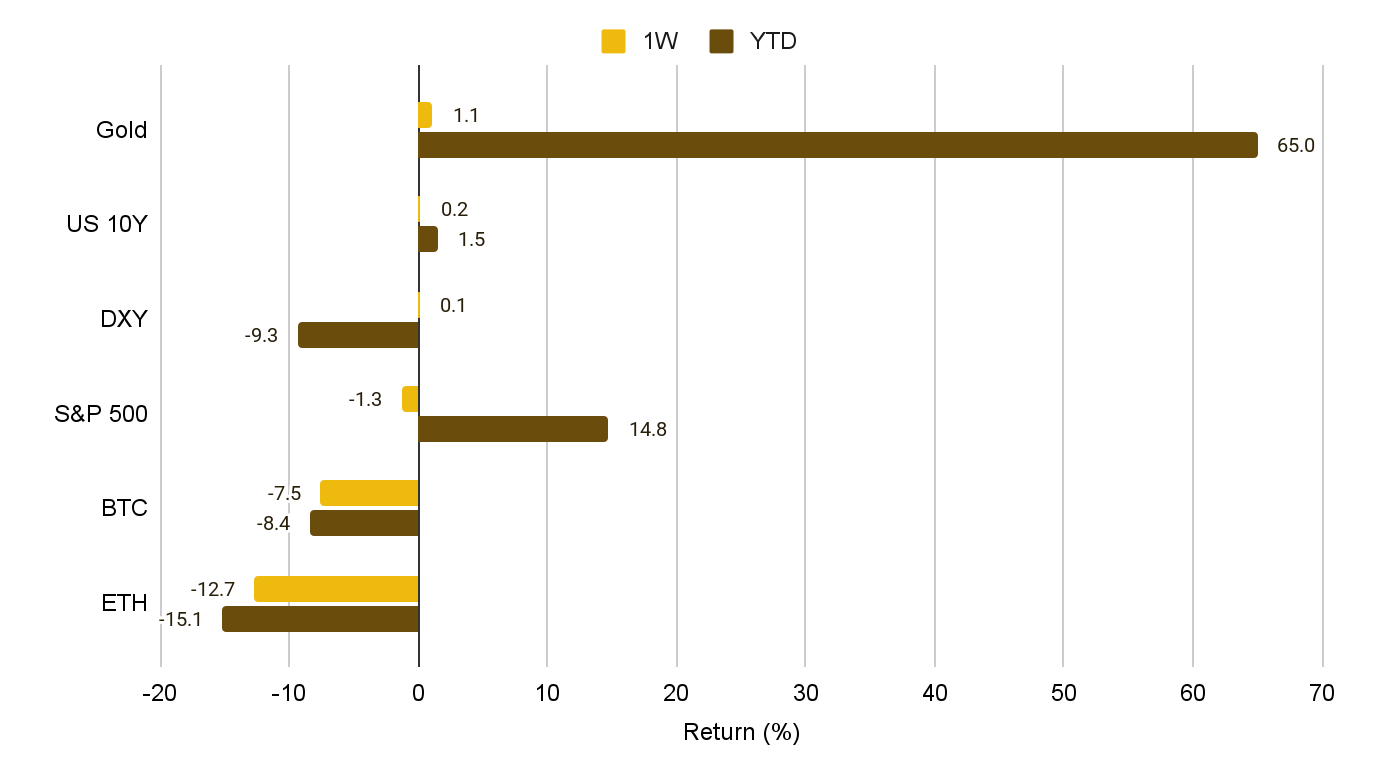
It’s hard to deny that, for crypto, bearish headlines and uncertainty have been piling up recently. The most far-reaching factor is regulatory uncertainty: the long-anticipated crypto Market Structure Bill pushed back for consideration in 2026. This decision not only undermines expectations for an accelerated path toward regulatory clarity, but also forces short-term capital that had been positioning for a “regulatory tailwind” to unwind and exit.
In equities, after the negative news around Blue Owl pulling funding from an Oracle data center project, the AI complex got a much-needed boost. Micron (MU) delivered a blowout earnings report and guidance this week, lifting semiconductors and driving a sharp rebound in major indices on Thursday. In addition, reports that OpenAI is seeking to raise funding at an approximately $750 billion valuation suggest institutional appetite for AI infrastructure remains substantial. That said, given the magnitude of the prior drawdown, the S&P 500 is still down about 1.3% over the past seven days.
1. Digital Assets
Figure 2: YTD Indexed Performance – Major Digital Assets
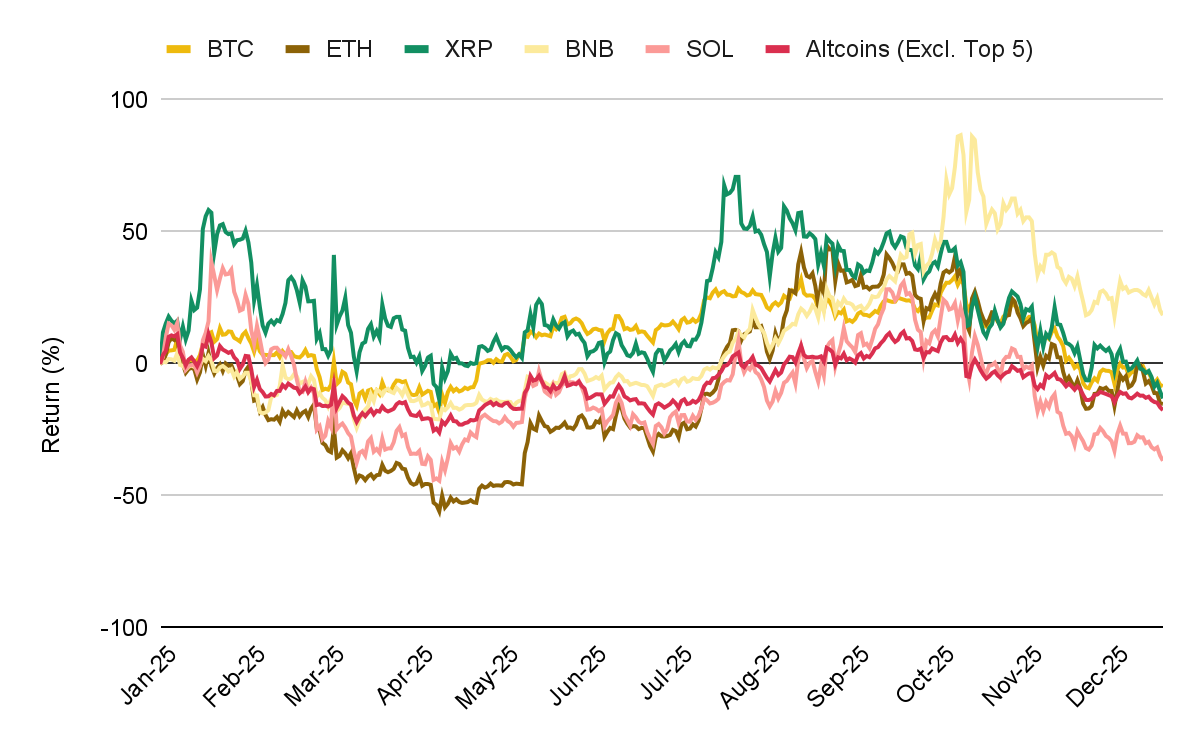
This week, the total crypto market capitalization failed to hold the $3 trillion psychological threshold, sliding from an early-week peak of $3.07 trillion to around $2.88 trillion by Friday—down 5% WoW. After Bitcoin was rejected at the $94,000 major historical resistance, liquidity conditions deteriorated sharply, with BTC breaking below the $86,000 key support level.
On-chain data suggests the sell-off was not driven by retail panic. Instead, it appears to have been led by whales—institutional-scale distribution that overwhelmed dip-buying from smaller participants. Onchain data shows since November the number of large BTC-holding addresses has been declining at the fastest pace since 2022:
Addresses holding >1,000 BTC fell by 68 (-3.2%)
Addresses holding >100 BTC fell by 286 (-1.5%)
Addresses holding 10–100 BTC fell by 654 (-0.5%)
In contrast, smaller holders addresses holding 0.01–1 BTC increased by 68,066 (+1%) over the same period. This divergence indicates persistent retail inflows, albeit insufficient so far to absorb the ongoing whale-led de-risking and distribution pressure.
Figure 3: Large holders are decreasing faster than small holders
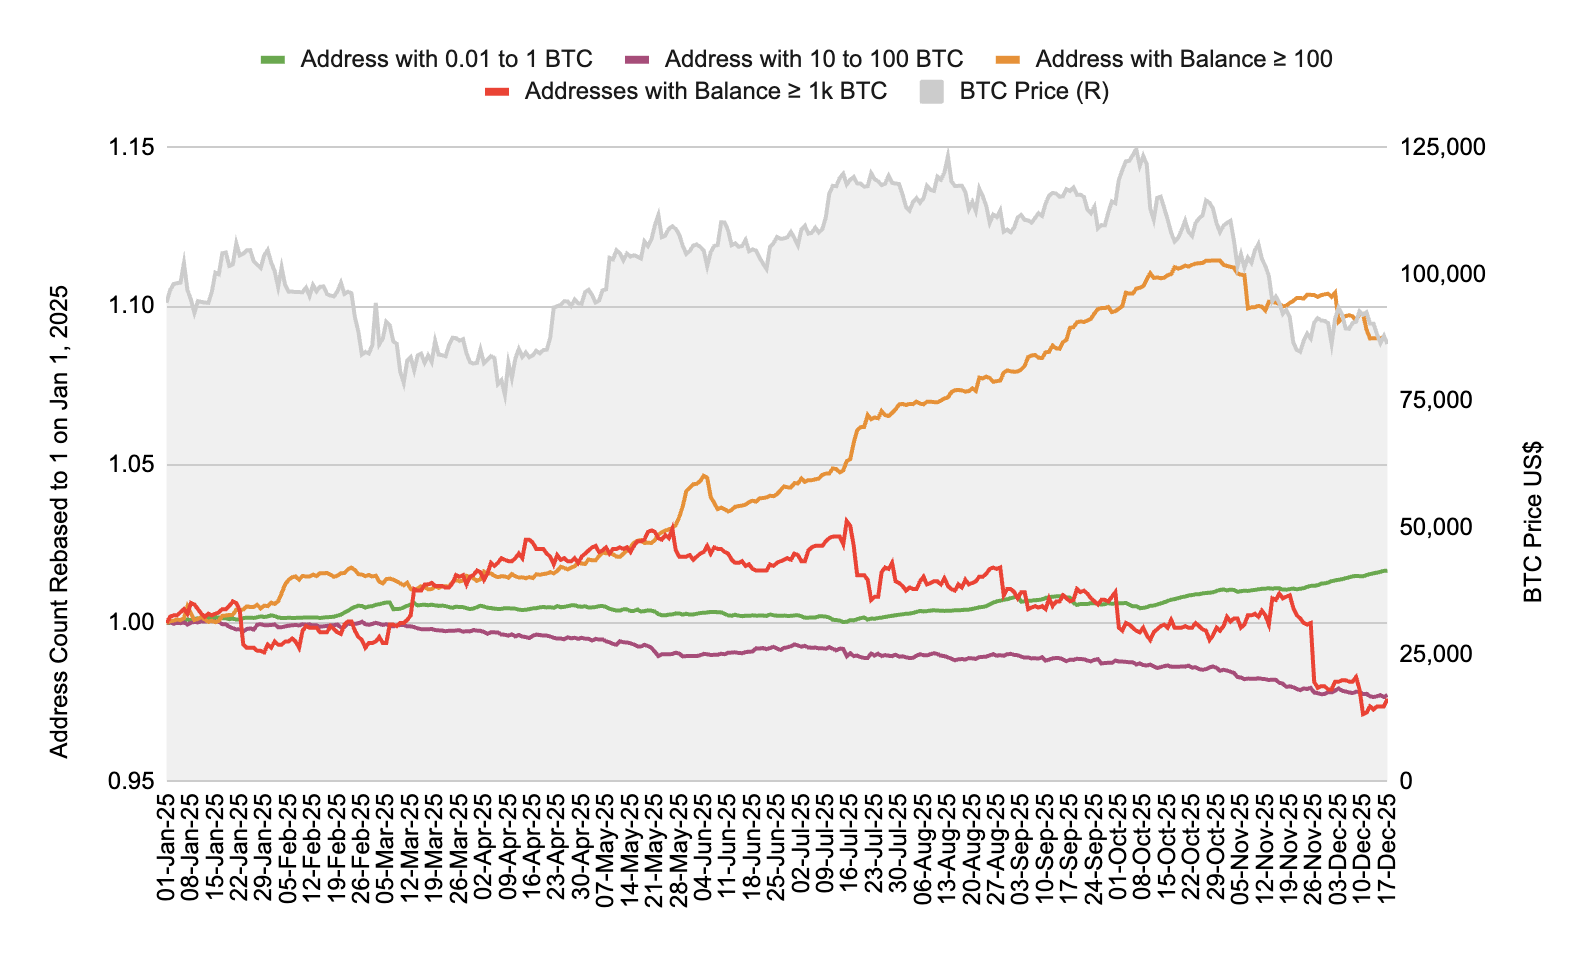
A clear gradient emerges from the address data: the larger the BTC holdings, the steeper the decline in address counts; conversely, smaller-holder cohorts show a much slower contraction—or even net growth. This top-down divergence highlights a pronounced split in behavior between institutions/large holders, which are actively de-risking and distributing, and retail participants, who continue to buy the dip.
Meanwhile, price performance of Ethereum (ETH) and major altcoins—such as Solana (SOL), XRP, and Cardano (ADA)—were notably weaker, broadly posting weekly losses of 5% to 11%. That said, SOL and XRP spot ETFs remained a rare bright spot: both continued to attract inflows against the broader drawdown, extending their net-inflow streak to 11 consecutive trading days.
Figure 4: SOL and XRP continue to attract US funds
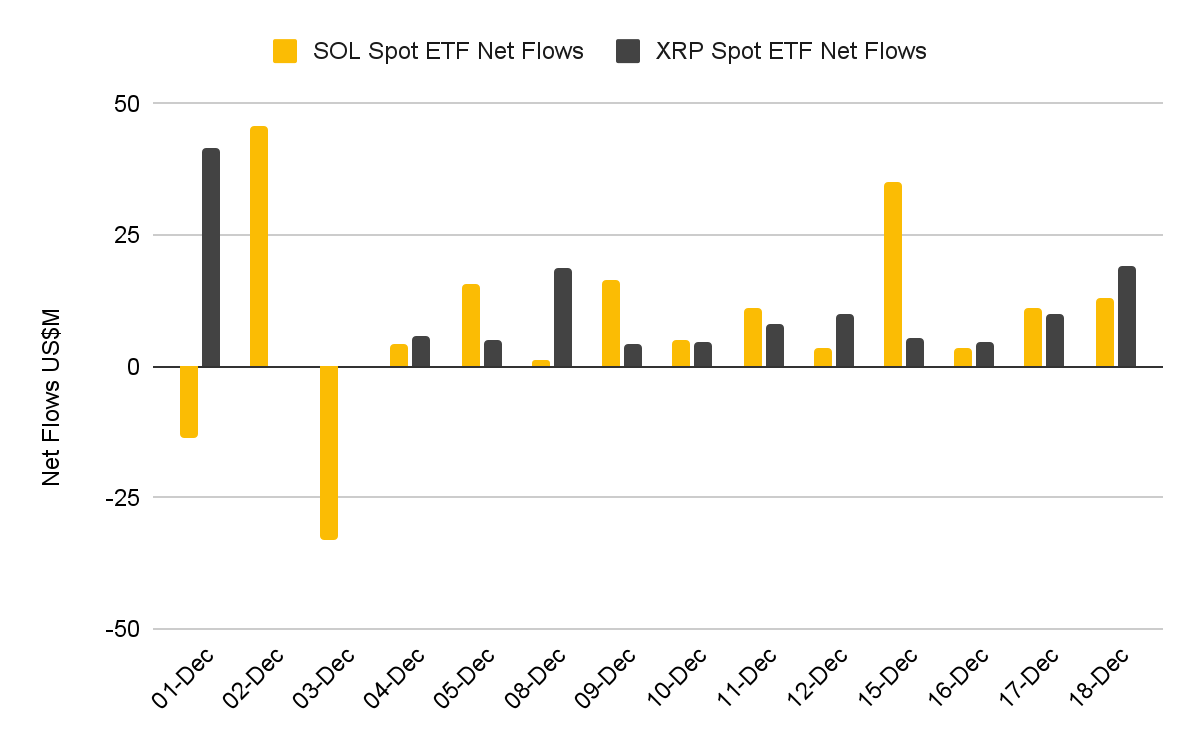
In the past five trading days, Bitcoin ETFs saw outflows of $290M while Ethereum outflows reached $578M. This divergence in fund flows suggests that some investors are betting on the long-term evolution of the public chain landscape, willing to buy on dips in Solana and XRP.
Figure 5: BTC/Stablecoin ratio has stabilized
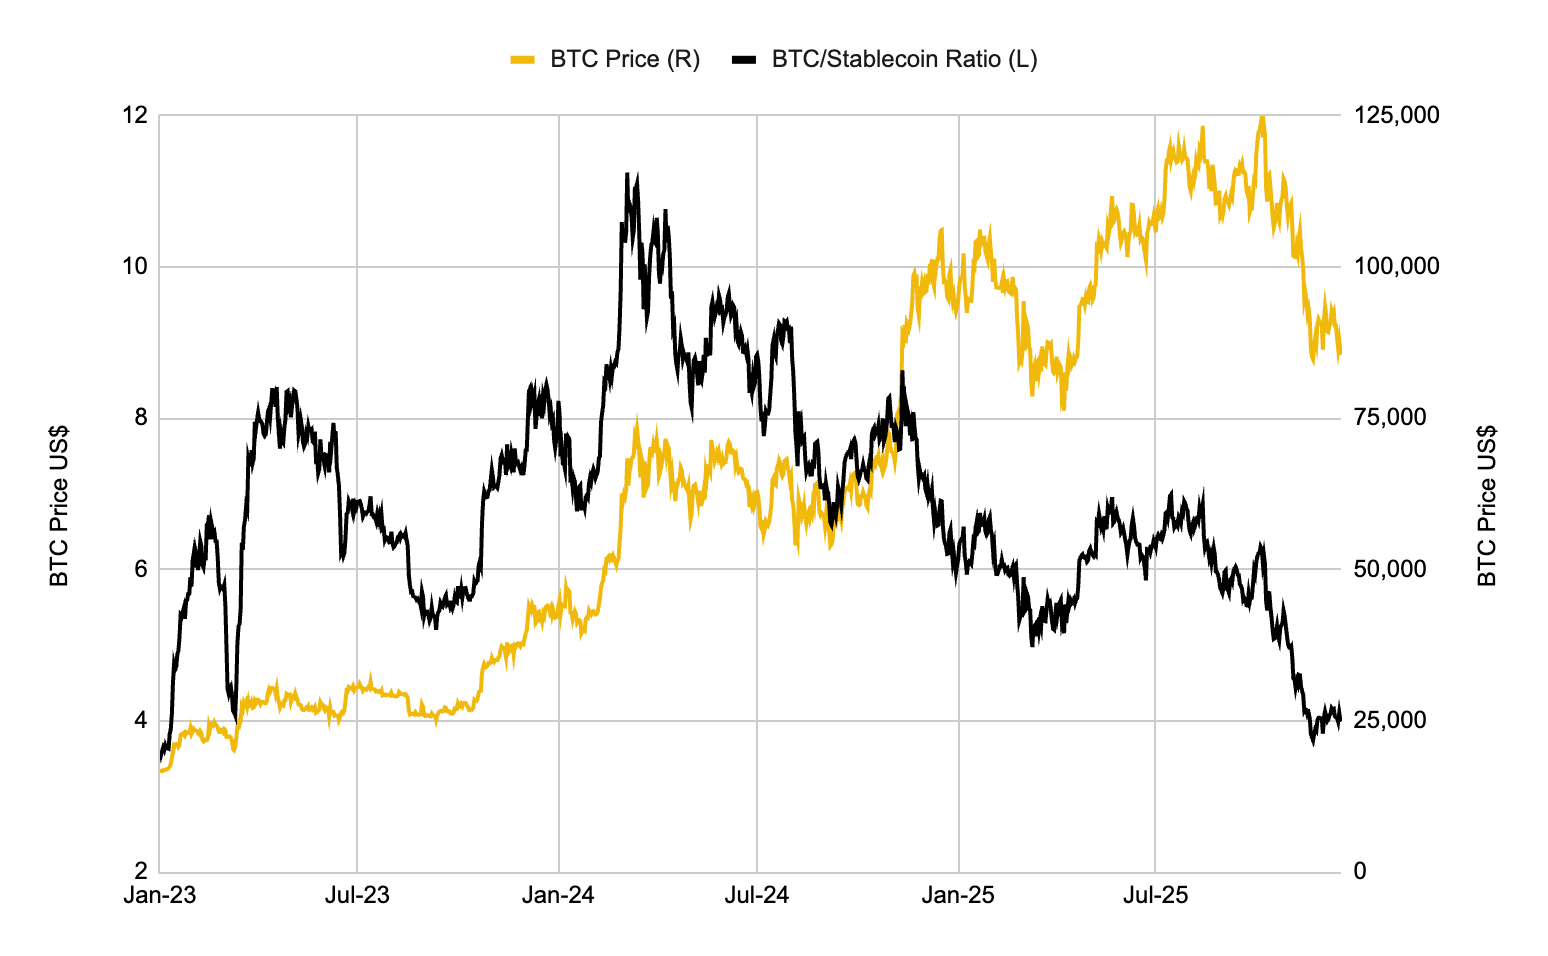
Although prices have fallen further, the BTC/Stablecoin balance ratio on CEXs has stopped declining. This is a neutral signal, indicating that buyers and sellers are roughly balanced.
2. Global Markets
Figure 6: Multi-Asset Performance – Equities, FX, Commodities, Bonds, Volatility
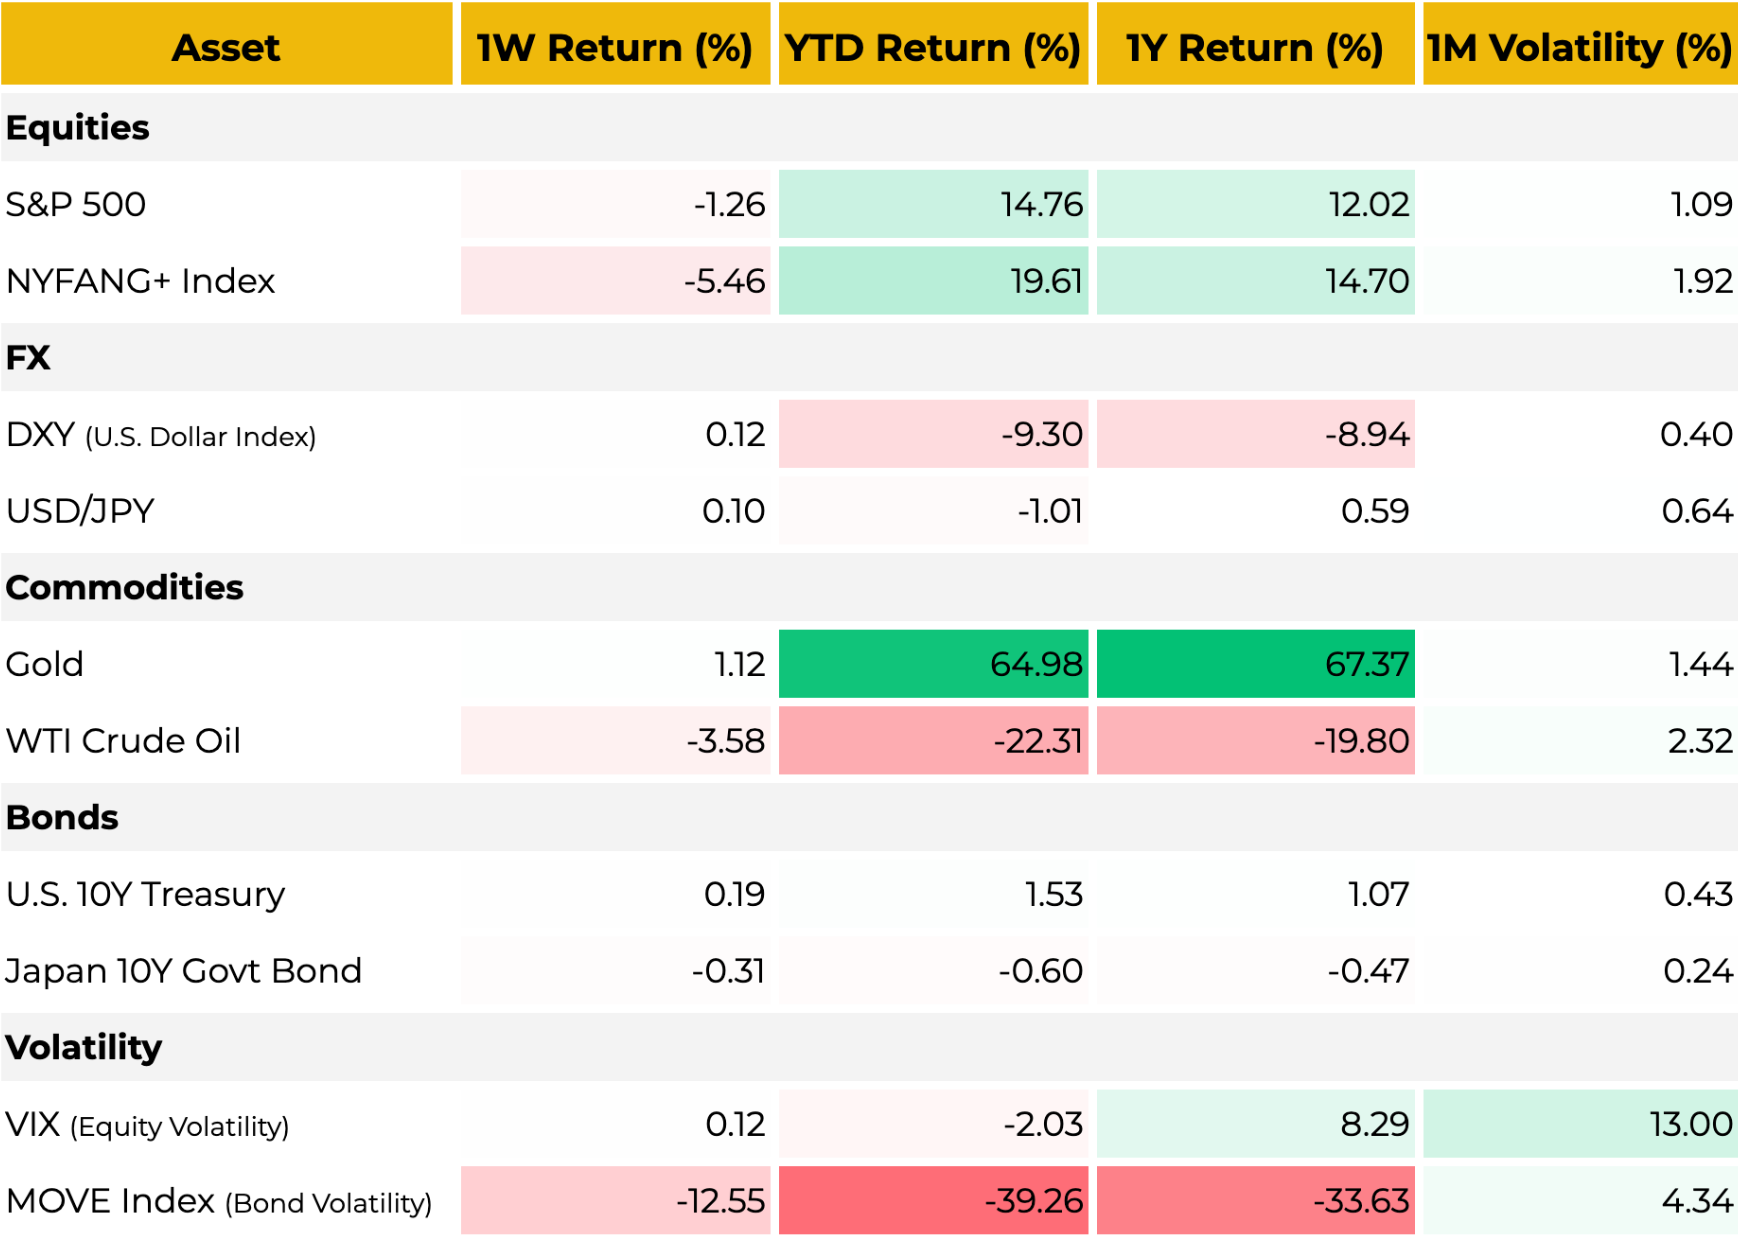
Equities:
US equities rallied last week on the back of rate cuts, but sentiment deteriorated after AI-related concerns tied to Oracle and Broadcom triggered a pullback in the broader market—pressure that persisted into this Thursday before easing somewhat following Micron’s “blockbuster” earnings and guidance.
Earlier, OpenAI’s latest model received a notably negative reception, with widespread commentary describing it as “disappointing” and even a “step backward.” At the same time, Nvidia sentiment was hit by reports that China would not accept the H200, weighing heavily on semiconductors and high-flying AI names such as CoreWeave. The sell-off ultimately spilled over into the energy and power complex as well.
Historically, risk sentiment in tech has been tightly correlated with crypto. In the current setup, Oracle has effectively become a bellwether for AI risk: after its data-center build-out lost financing support from private credit lender Blue Owl Capital, investor confidence in the durability of AI infrastructure deals was shaken. As of Thursday’s close, Oracle was down 9.5% over the past week.
FX:
The U.S. Dollar Index (DXY) edged a little bit higher this week, repeatedly testing the key resistance level around 98.5. That said, with the dollar’s interest-rate differential advantage versus major non-U.S. currencies narrowing materially, it is difficult to see the greenback sustaining a prolonged period of strength.
Commodities:
Amid a string of risk events (including military conflict in southeast asia), precious metals have rallied sharply, with gold and silver posting strong gains, while energy prices have edged lower. Silver in particular has seen a historic breakout: it not only cleared the key psychological threshold of USD 65 per ounce, but also rose more than 10% in a single week.
As a tangible asset, silver combines two distinct characteristics—it serves as a hedge against fiat debasement, and it also has irreplaceable industrial utility in sectors such as solar photovoltaics, electric vehicles, and AI data-center buildouts. Notably, silver has continued to print new highs even as AI-related equities and narratives have pulled back, which is especially striking.
By contrast, cryptos also arguably possess a dual nature—utility alongside store-of-value potential—but they have not, for now, attracted the same degree of market enthusiasm.
Bonds:
The bond market broadly rallied (yields moved lower), supported by the Fed’s rate cut on December 15. However, the longer the duration, the more muted the move: the 2-year Treasury yield fell by 7 bps, while the 10-year declined by only 2 bps. The 30-year yield rose to 4.83%, up 2 bps. Taken together with the equity sell-off, this pattern suggests the market is becoming somewhat more concerned about long-term inflation risks and fiscal sustainability.
Volatility:
The MOVE Index—a key gauge of implied volatility in the U.S. Treasury market—fell to 60 this week, its lowest level since October 2021. This suggests that as the Fed’s rate path has become more predictable, stress in the bond market is fading, after the index had surged to around 140 earlier this year.
3. Intermarket View
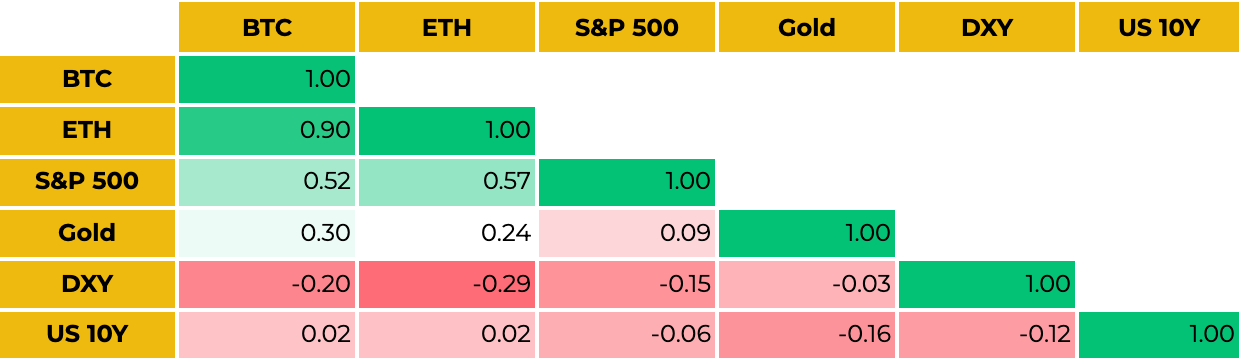
Recently, the crypto market has become somewhat disconnected from traditional markets, showing relatively independent price movements. The correlation between the two has decreased. For example, this Thursday, even though the stock market experienced a significant rebound, the crypto rally was short-lived.
Regardless of whether the correlation returns, crypto investors must closely watch the end of the US earnings season and tech giants' capital expenditure guidance. If the tech stock pullback deepens, crypto sentiment will likely suffer too.
Figure 7: BTC 2M Correlation Matrix (vs ETH, S&P 500, Gold, DXY, US 10Y)
Macro Outlook: Macro Data Collectively Points to a Slowdown in Growth and Inflation
Inflation Cooled Faster Than Expected
Delayed by the government shutdown, the Bureau of Labor Statistics (BLS) released data for October and November, revealing a sharper-than-expected deceleration in inflation:
Headline CPI: Rose 2.7% YoY (vs. 3.1% expected) and remained flat MoM.
Core CPI: Fell to 2.6% YoY (vs. 3.0% expected), marking the lowest level since March 2021.
Supercore CPI: The 3-month annualized rate dropped significantly to 2.08%, converging closely with the Fed’s 2% long-term target.
Labor Market Data Softens
While the November Non-Farm Payrolls (NFP) headline beat expectations, the underlying details were weak. The Unemployment Rate jumped from 4.4% to 4.6%, the highest since September 2021. Although partly driven by a higher participation rate, standard errors in the household survey remain elevated and may persist.
NFP: November added 64k jobs (vs. 50k expected). However, this follows a collapse in October (-105k), which was heavily distorted by a drop of 162k federal employees due to the shutdown.
Wage Inflation: Average Hourly Earnings rose 3.5% YoY (vs. 3.6% expected) and just 0.1% MoM.
Retail Sales Weakness
Headline Retail Sales: October came in flat at 0.0% MoM (vs. 0.1% expected), dragged down by a decline in auto sales following the expiration of EV tax credits.
Control Group: Excluding autos, gas, and building materials, the Control Group surprised to the upside, rising 0.8% (vs. 0.4% expected), suggesting the US consumer retains some resilience beneath the weak headline figure.
December PMIs Signal Waning Momentum
The preliminary US Composite PMI for December fell to 53.0 (down from 54.2 in Nov), a 6-month low.
The Services PMI missed expectations, dropping to 52.9 (vs. 54.0 expected), also hitting a 6-month low.
In summary, data across the board—from corporate activity to consumption, labor markets, and pricing—is softening. With the unemployment rate breaching both the Fed’s year-end forecast (4.4%) and the key psychological level of 4.5%, concerns are mounting.
This raises a critical question: Is the "bad news is good news" trading regime coming to an end, with the market now pivoting to price in genuine recession risk?
The Week Ahead
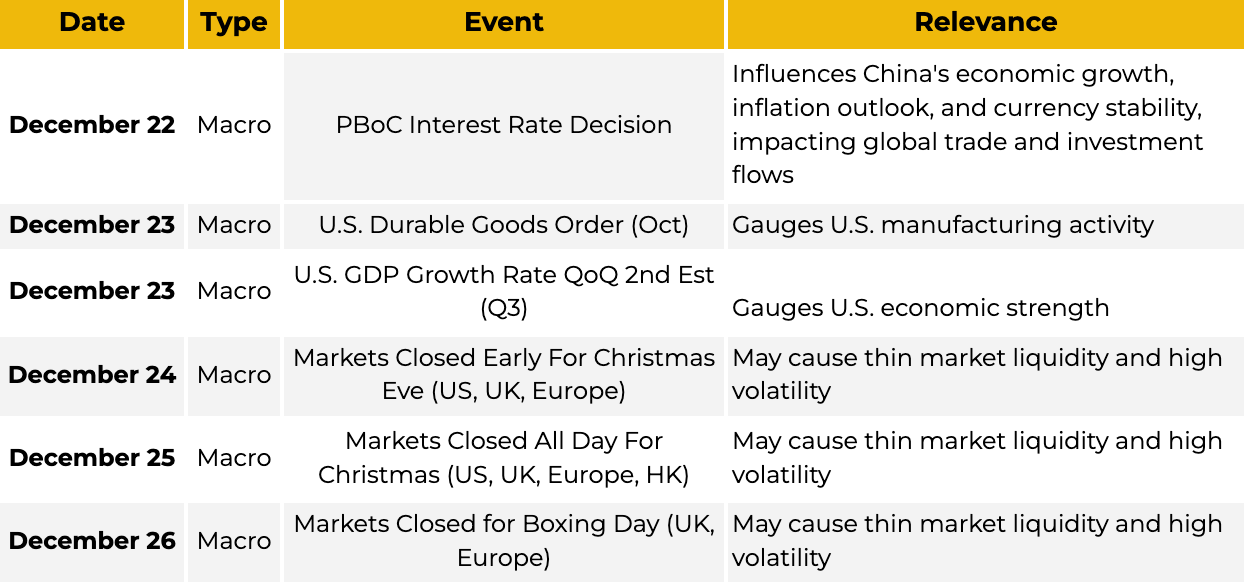
The upcoming week marks the Christmas holiday period, during which market activity and trading volumes are likely to decrease significantly. The holiday schedule is as follows, watch out for liquidity risk:
December 24 (Wednesday): Major stock markets in the US, UK, and Europe will close early, typically around 1:00 or 2:00 PM local time.
December 25 (Thursday): Major global markets including the US, Europe, UK, and Hong Kong will be closed all day for Christmas.
December 26 (Friday): The UK and many European countries will remain closed for Boxing Day, while US markets are generally open for trading.
Figure 8: Key Macro and Crypto Events for the Week of December 20-26, 2025
Holiday Seasonality in BTC and U.S. Equities: Pre-Christmas Strength, Year-End Noise, and a New-Year Reallocation Bounce
Figure 9: Year-end performance stats show a Santa Rally is likely
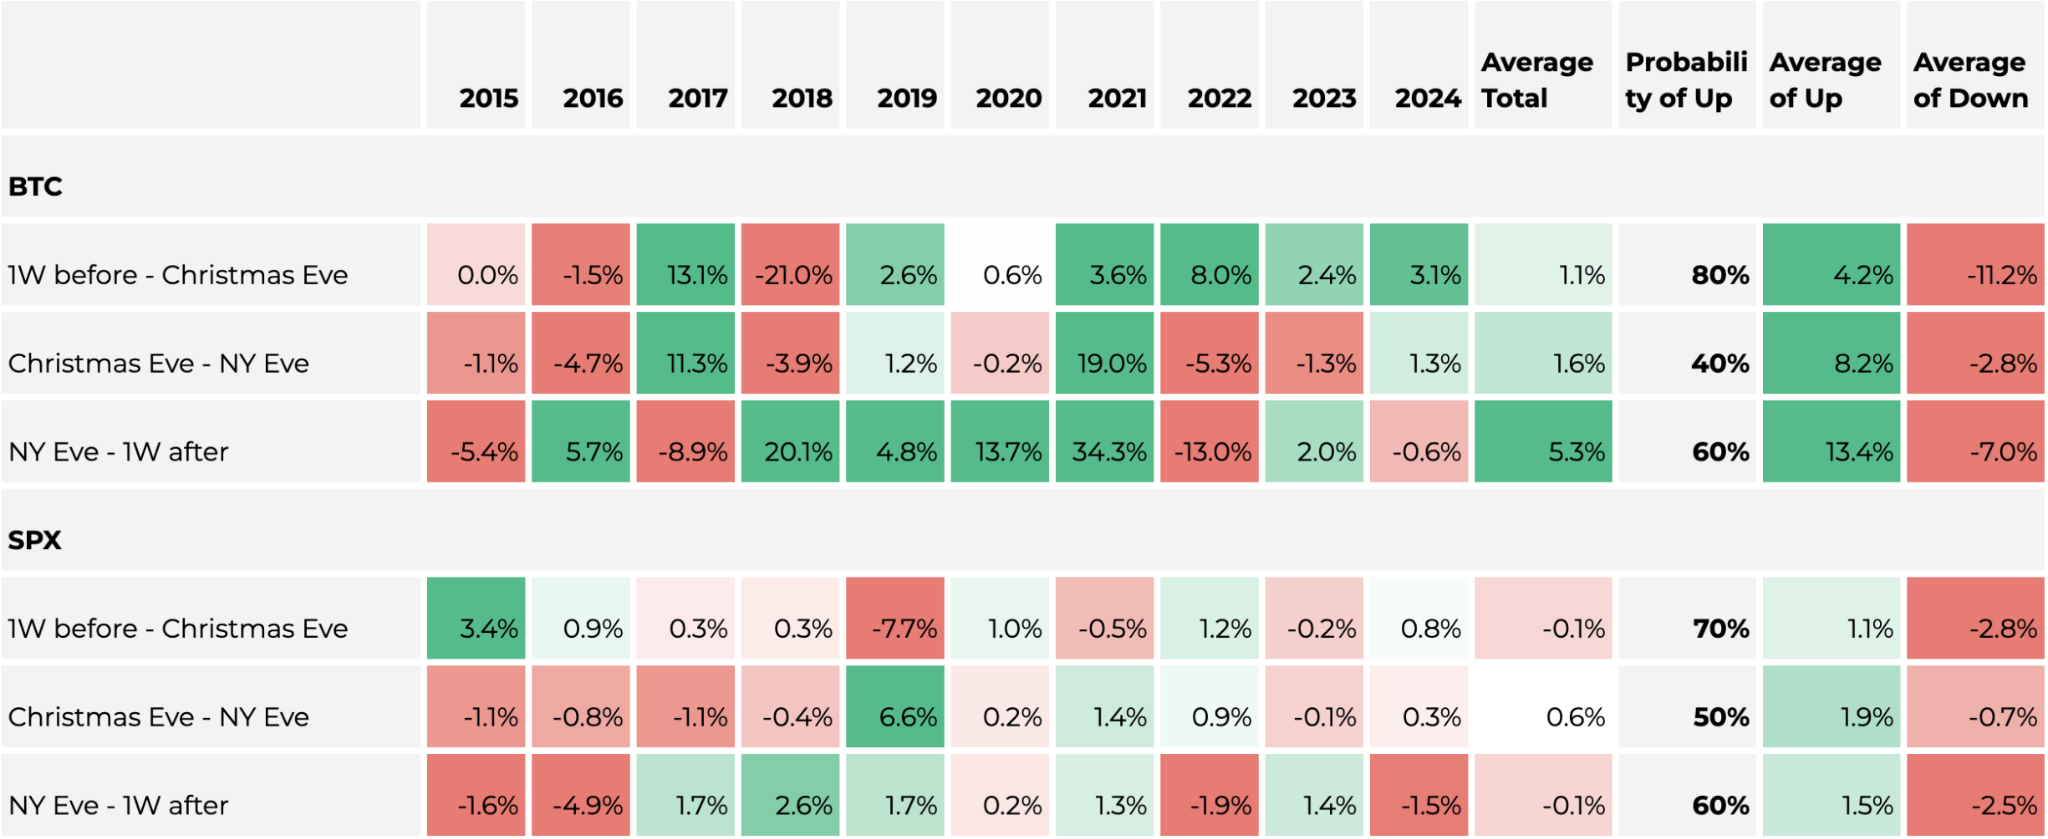
BTC tends to be stronger in the week leading into Christmas. Over Dec 19–25, the hit rate is 80% with an average return of +1.09%. This likely reflects a mild upward drift driven by holiday-thinned liquidity and still-supportive pre-holiday risk appetite (often helped by year-end “gift/bonus” effects).
By contrast, the Christmas-to-New Year window (Dec 25–Jan 1) has a much lower hit rate of 40%. That said, this period is better viewed as a noise regime: when BTC rallies, it can rally sharply, with the average gain in up years reaching +8.21% over the past decade.
From New Year’s Eve to one week after, performance improves again: the hit rate rises to 60% and the average return is +5.28%, consistent with the seasonal pattern of fresh capital and portfolio reallocation at the start of the year.
US equities show a broadly similar seasonal profile. The week before Christmas has a relatively high hit rate (70%), while Christmas Eve to New Year’s Eve drops to 50%—a typical “dead zone.” The New Year’s Eve to one-week-after window then sees a modest rebound in hit rate to 60%.