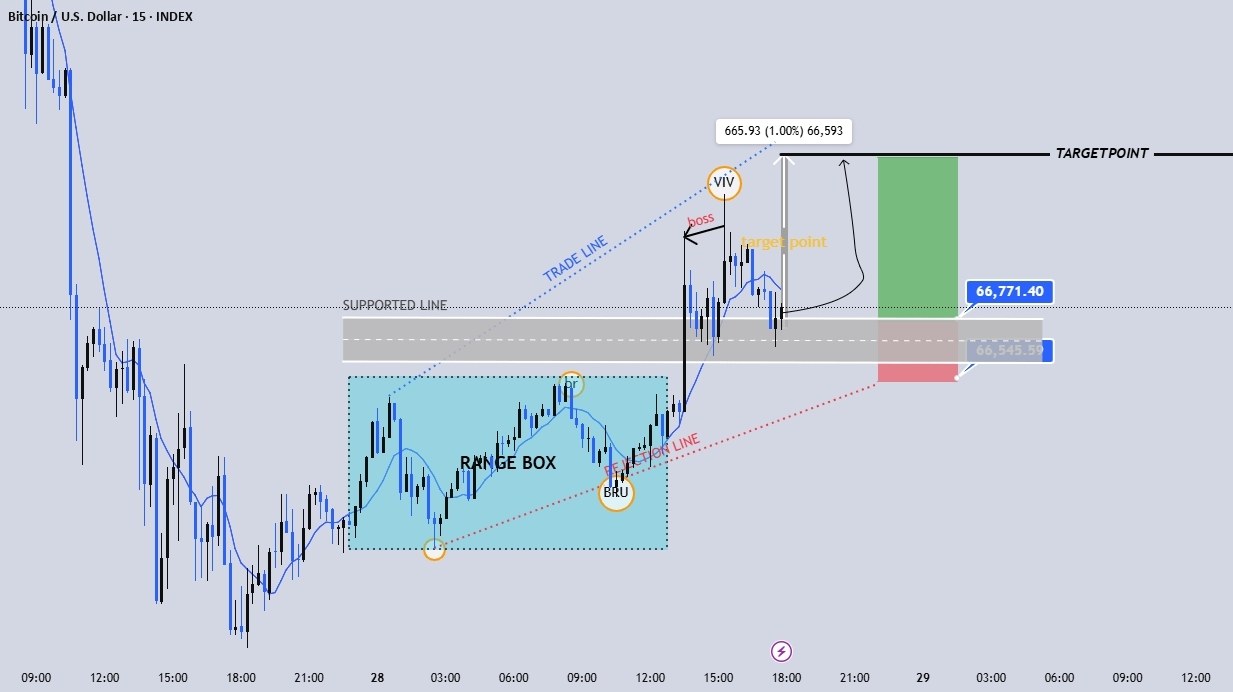
Market Structure
The price formed a range accumulation box → clear sideways movement.
False breakdown (BRU) below the range trapped the sellers.
Strong bullish movement followed by → confirms liquidity attraction + reversal.
2. Breakout & Confirmation
The price broke above the range and respected the support line.
The structure has moved to an upward trend with higher highs & higher lows.
The defined BOS (break of structure) confirms trend continuity.
3. Trading logic
Entered after a bounce to support (~66,545 area).
Stop loss placed below the structure → protects from invalidation.
Price is reacting well from the area, indicating buyer strength.
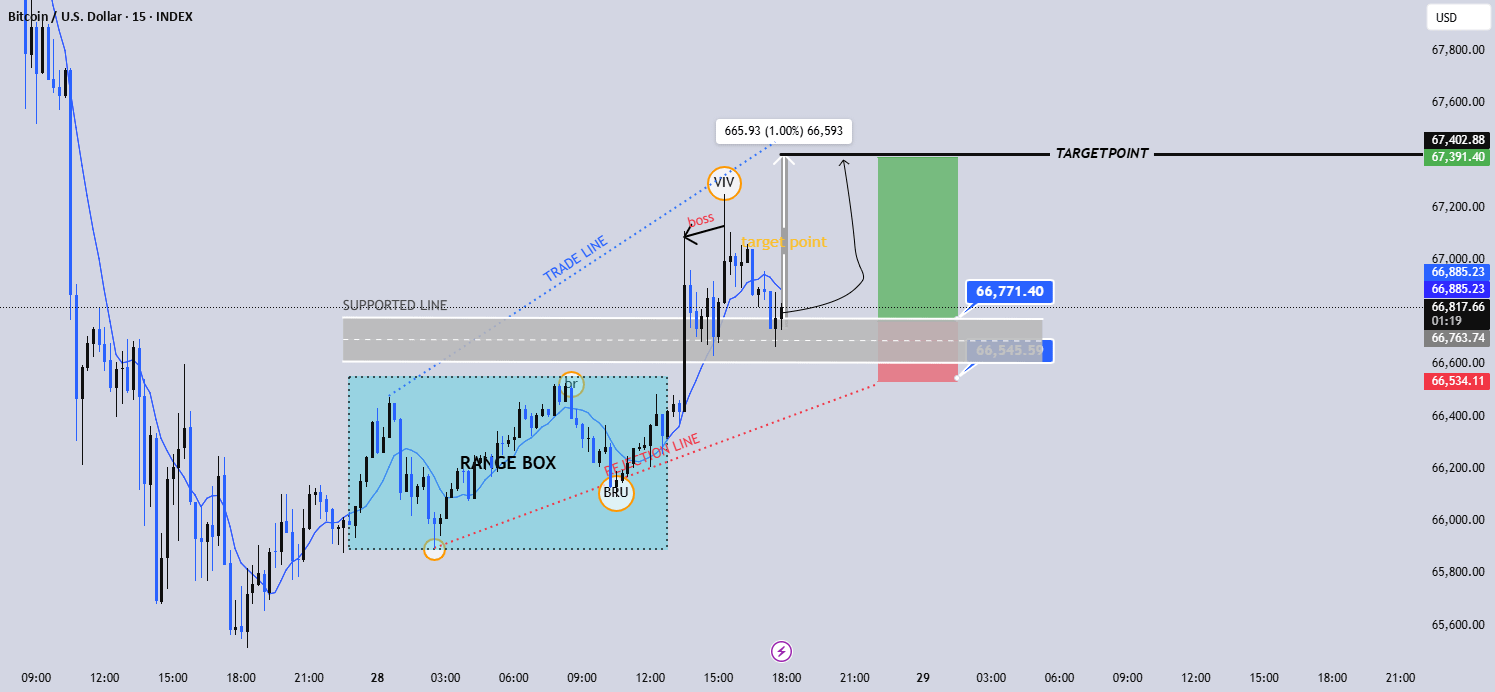
4. Target expectation
Measured move / liquidity target around:
66,593 → 67,391 – 67,402 area
This aligns with:
Previous liquidity heights
Psychological resistance area
5. Main vision
Move from the range → breakout → retest → continuation is a high-probability setup.
As long as the price stays above support at 66,500, the bullish trend remains intact.
Conclusion
📈 Trend: Bullish continuation
Solid support = continuation towards target 67.4K
Break below support = invalidating the setup
#BitcoinPrices #TetherAudit #TrumpSeeksQuickEndToIranWar #CLARITYActHitAnotherRoadblock #OilPricesDrop
