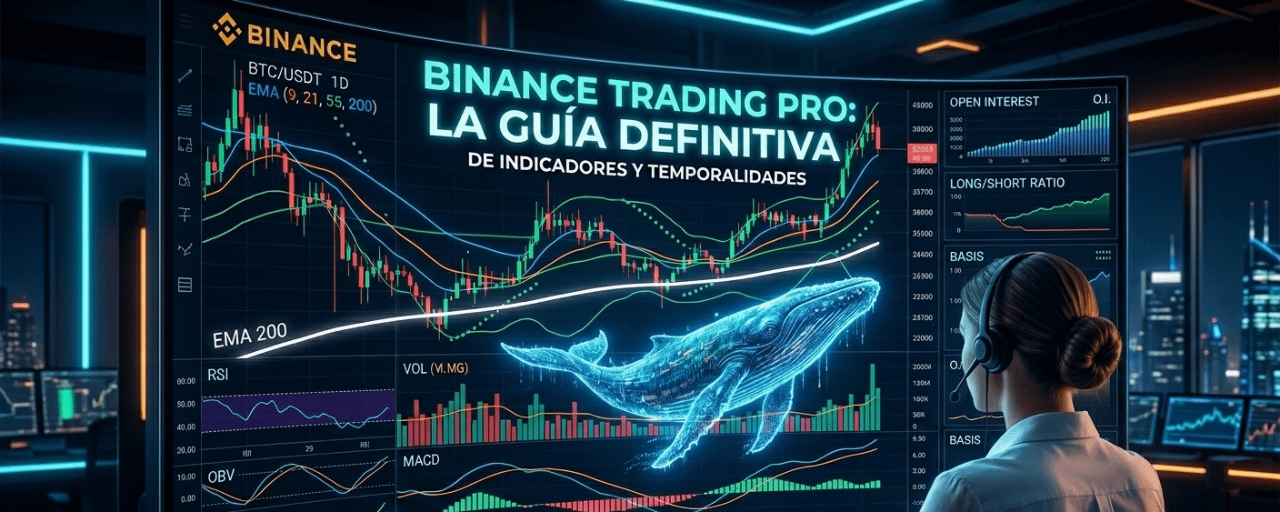
Have you ever opened the Binance chart and felt like you're looking at the Matrix? Don’t worry, 90% of traders lose money because they can't read what the market is shouting at them.
Today, I'm going to give you a General Guide on Indicators and Timeframes. Save this post, hit like, and get ready to level up. 🔥🚀
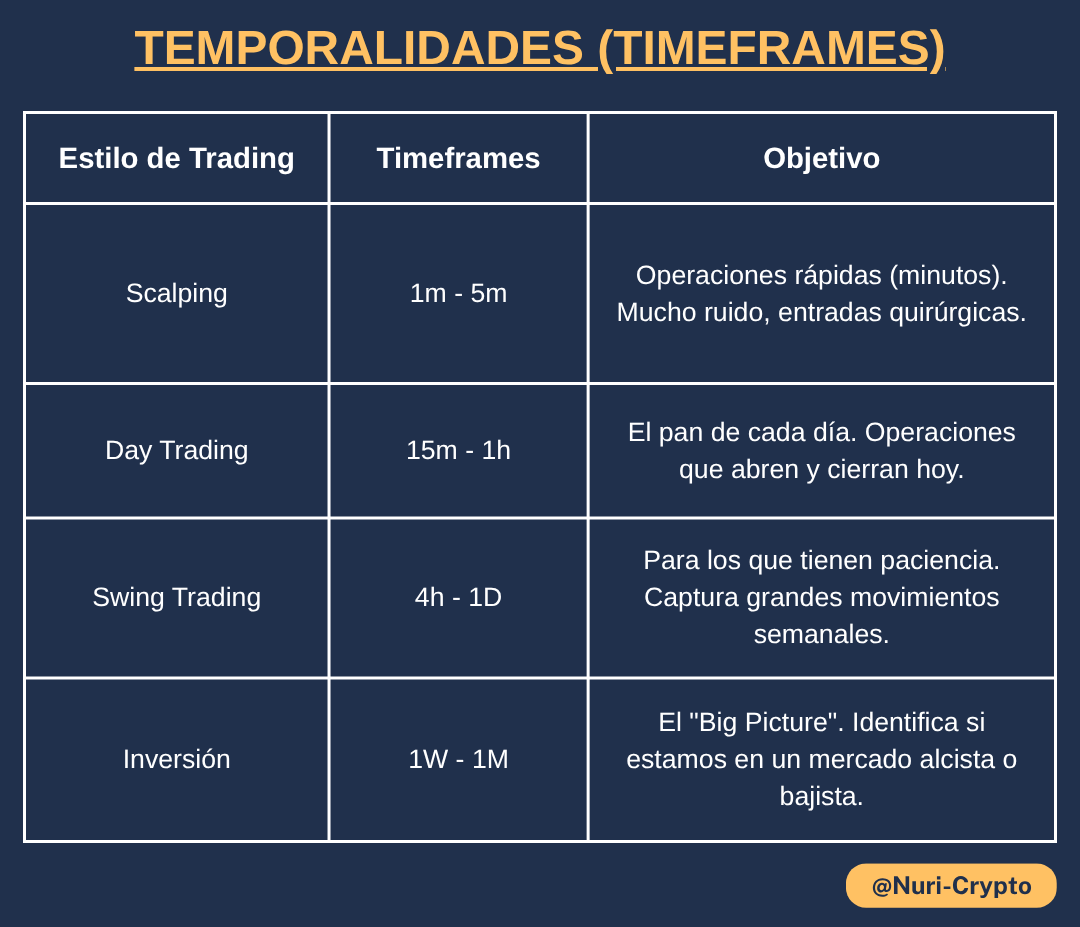
1. Time is Money: Timeframes
Timeframes don't change the price, they change your perspective. If you're only looking at one, you're trading blind.
2. Main Indicators (Overlay)
They are drawn over the price candles. They are your navigation map.
The Eternal Battle: MA vs. EMA
1. MA (Simple Moving Average)
What is it for? It smooths out price noise to show the average direction over $N$ periods. It's slow and steady.
How to use it: It helps to see the "Big Picture."
If the price is above the MA 200 on the daily (1D), we're macro-bullish.
If the price is below, we're macro-bearish.
Setup (in the Binance menu when clicking on MA):
MA 1: 200 (Color: White or Bright Red) It's the line of the "bullish/bearish market."
2. EMA (Exponential Moving Average)
What is it for? Similar to the MA, but gives more weight to recent prices. It's faster and reacts quicker to changes.
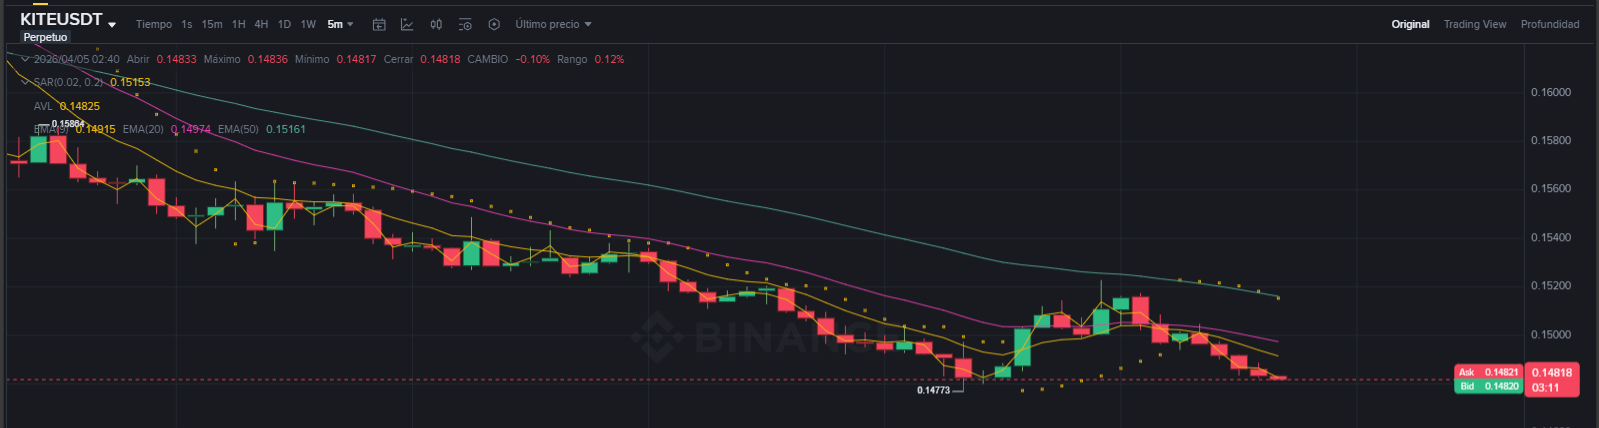
How to use it professionally: Ideal for momentum trading (scalping, day trading).
The EMA Ribbon: If the fast EMA crosses above the slow one, it's a buy signal.
Dynamic support: In a strong trend, the price often "bounces" on key EMAs.
Pro Setup:
EMA 1: 9 (Ultra short-term / momentum).
EMA 2: 20 (Entry timing / support).
EMA 3: 50 (Medium-term trend / confirmation).
Precision Tools
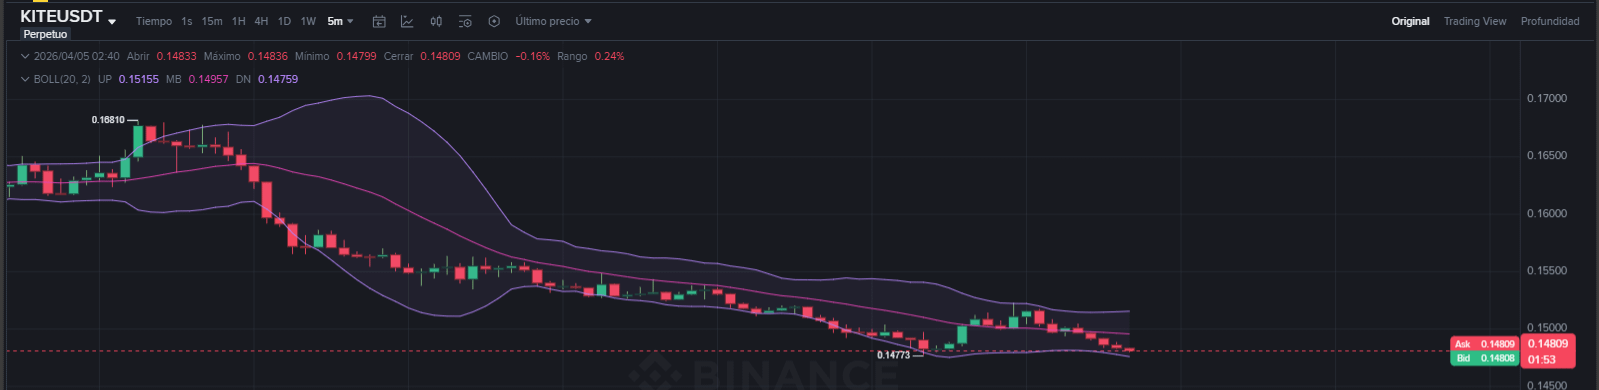
BOLL (Bollinger Bands): Measure fear and euphoria. When the bands "squeeze," a violent move is coming.
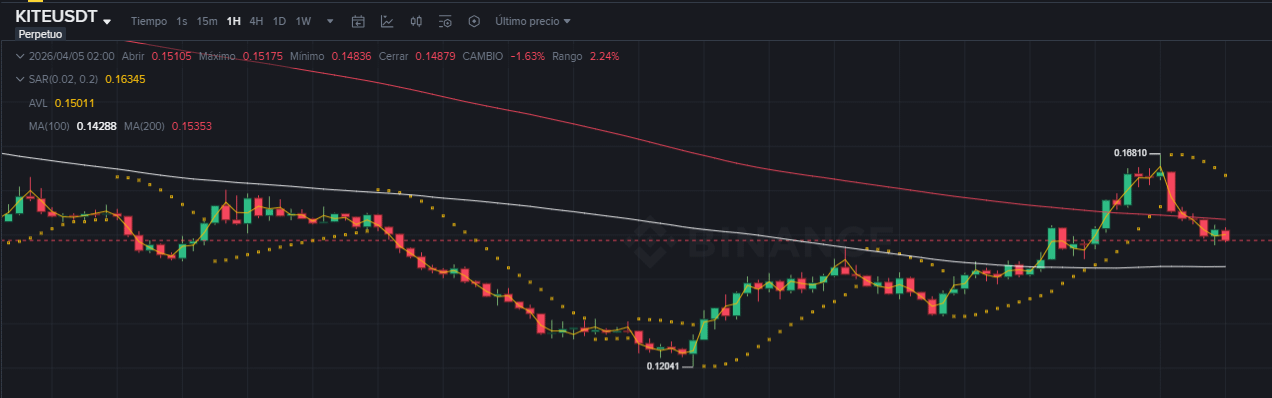
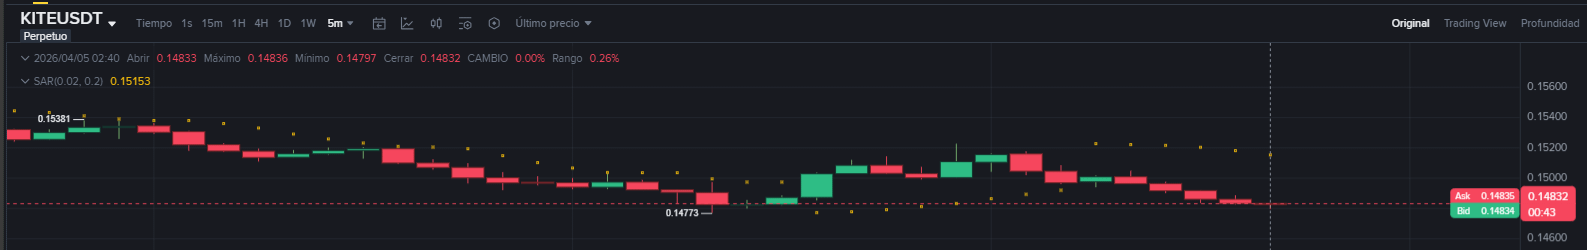
SAR (Stop and Reverse): Those "yellow dots." If they're below, we buy (long). If they're above, we sell (short). Use them to move your Stop Loss and secure gains.
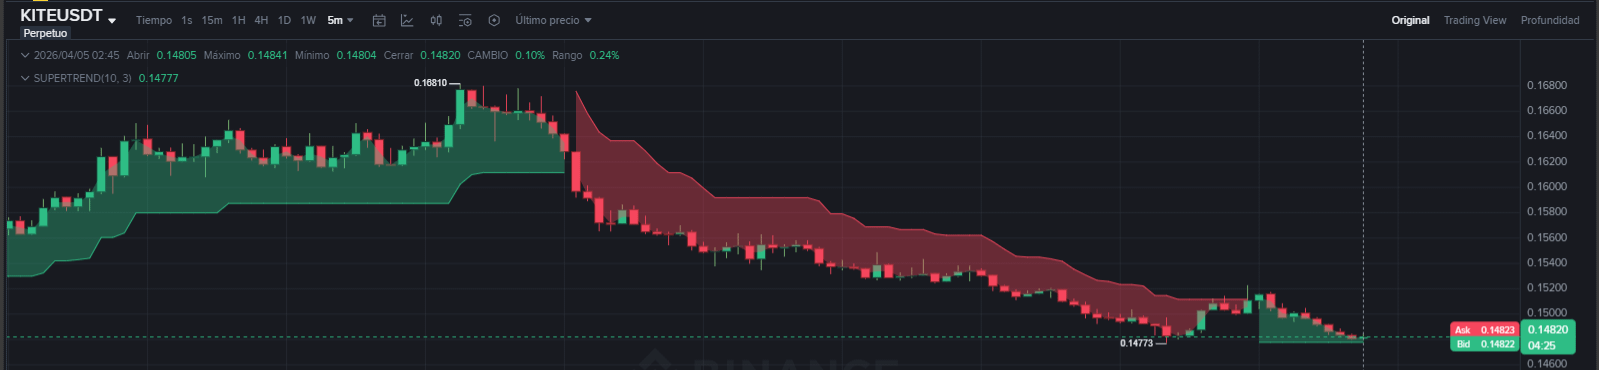
SUPER (SuperTrend): The trading traffic light. Green means buy, red means sell. Simple but deadly effective when combined with volume.
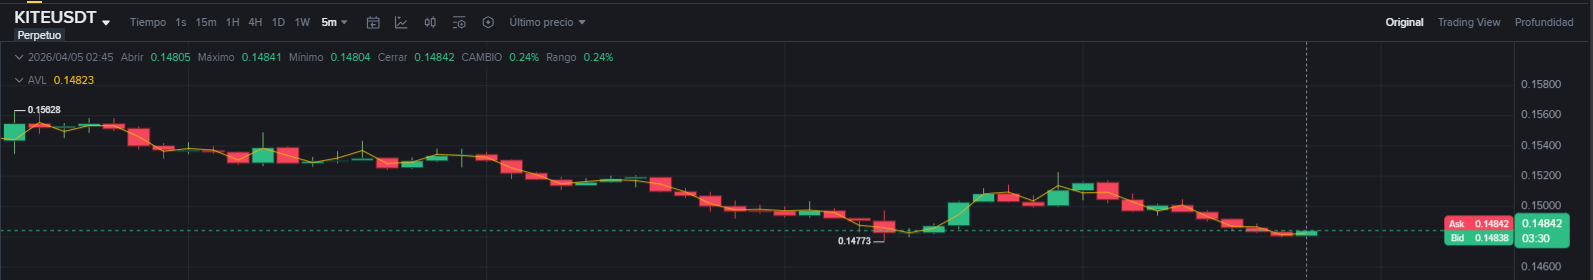
AVL (Average Value Line): Tells you the "fair price" recently. If the price is far from the AVL, watch out! It's likely to revert back soon.
3. Secondary Indicators
They appear below the chart. They tell you if the movement has strength or if it's a deception.
Momentum Oscillators
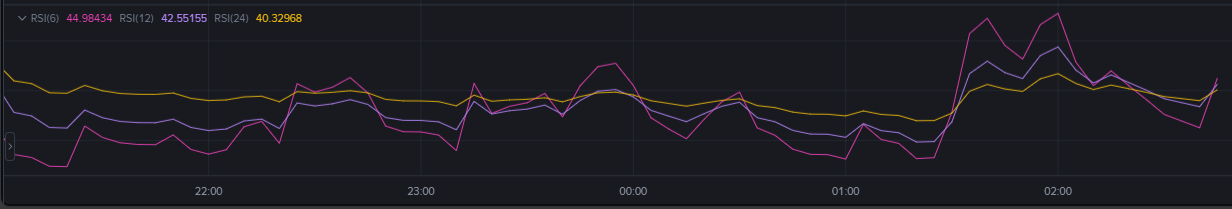
RSI (Relative Strength Index): Measures if people are buying like crazy (>70) or selling in a panic (<30). Look for Divergences. If the price rises but RSI drops, get out! A drop is coming!
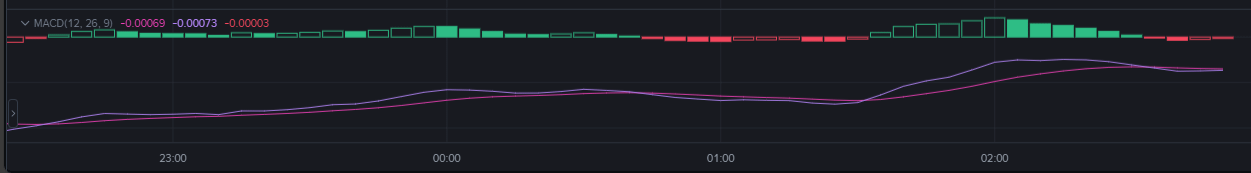
MACD: The crossing of its lines confirms when a trend accelerates or exhausts.
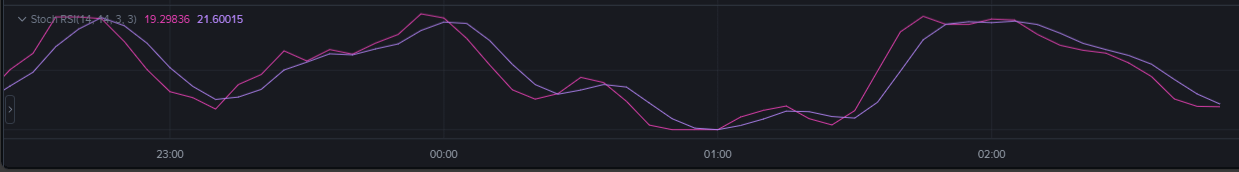
StochRSI / KDJ: The hyperactive cousins of the RSI. They give very quick entry signals on lower timeframes (1M-15M) for Scalping.
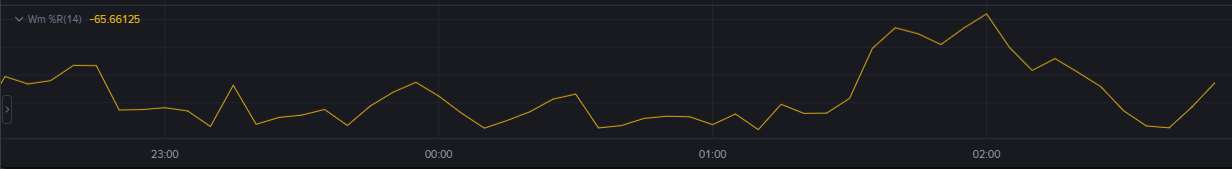
WR (Williams %R): Ideal for seeing how close the price is to its recent highs. If it's at -20, the momentum is strong.
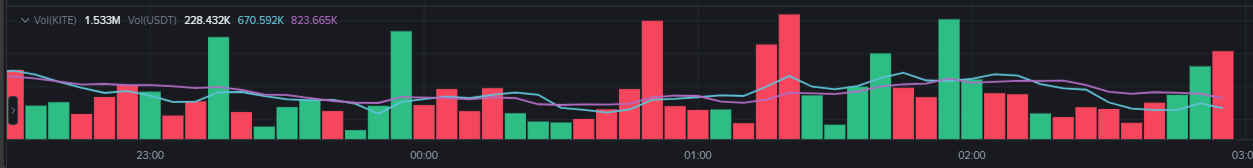
The Power of Volume
VOL: Volume is the TRUTH. If the price rises without volume, it's a trap. If it breaks a resistance with high volume, it's real!
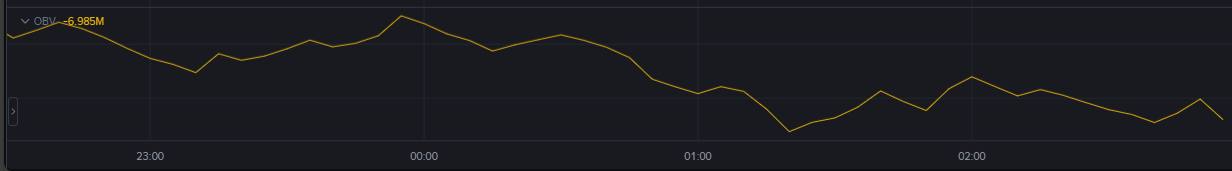
OBV (On-Balance Volume): Tracks where the whales' money is flowing. If OBV rises and the price doesn't, get ready for a rally.
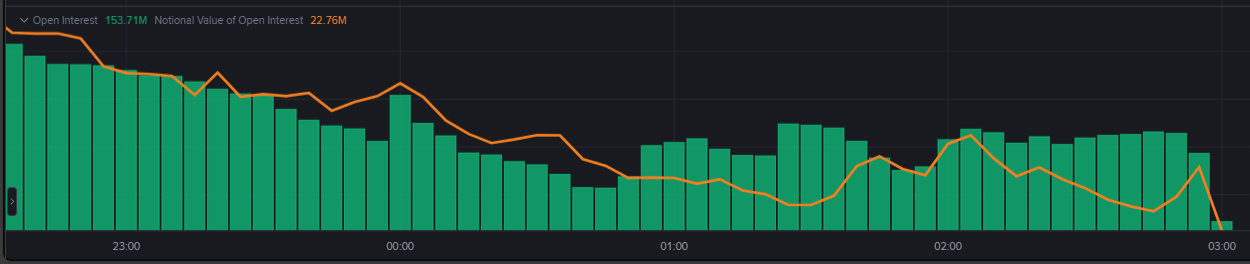
4. The Secret Weapon: Trading Data (Futures)
O.I. (Open Interest): Real money at stake. If the price rises and O.I. rises, the trend is solid.
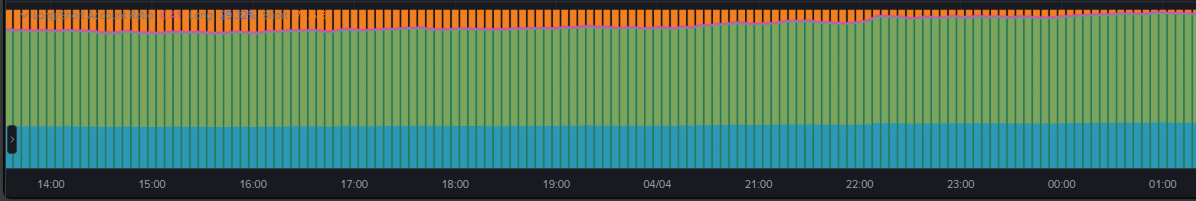
L/S Ratio (Long/Short): The psychology of the masses. If everyone is Long (e.g. 80%), whales often tank the price to liquidate them. Trade against excessive euphoria.
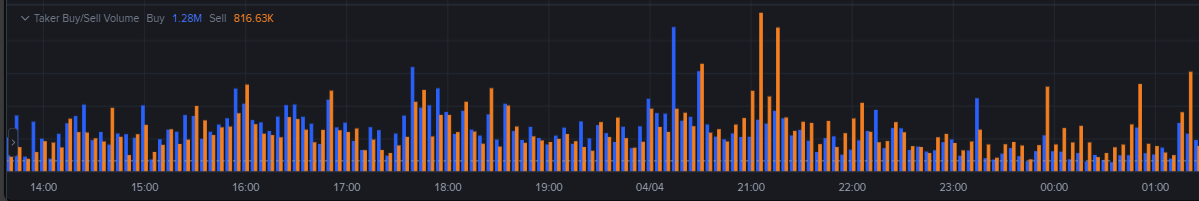
B.S. Vol (Buy/Sell Volume): Tells you who's winning the fight right now: bulls or bears.
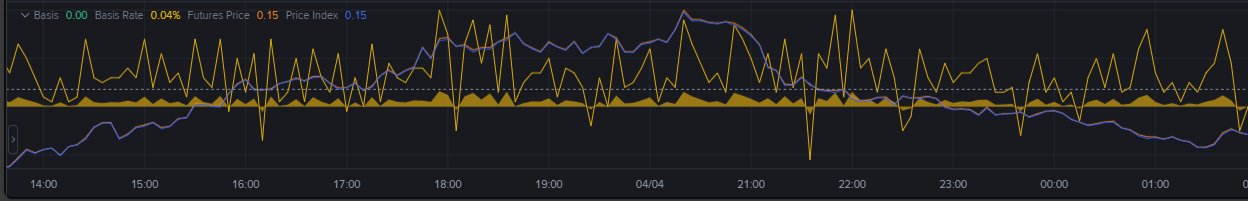
Basis: The difference between Futures and Spot prices. A very high Basis means too much ambition in the market.
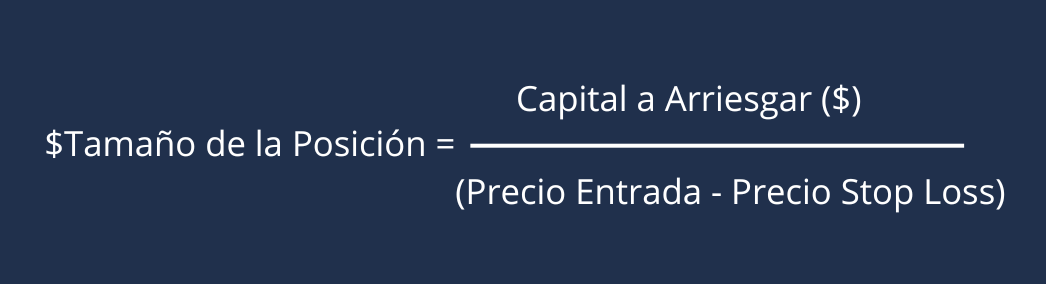
5. Math will set you free
A pro doesn’t gamble, they manage risk. Never risk more than 1% of your account per trade. Use this formula:
Trading is learned through sharing.
What's your favorite indicator and which coin do you use it on the most? I’m reading you in the comments! 👇
Share this guide with that friend who keeps buying at the highest peak.
Hit "Save" so you don't forget how to set up your setup next time you trade.
🔥I invite you to our public group:
The Trading Mavericks! 🔥🚀💵
May the force of the trend be with you! 🔥💚🔥
#trading #indicadores #BinanceSquare #AnalisisTecnico #nuricrypto


