
Our research institute has in-depth studies in technical indicators, major order analysis, custom indicator quantitative strategies, on-chain meme investments, and other fields. We can guide you from multiple dimensions to help you build a complete trading system.
Today, we focus on the core theme - Fibonacci retracement indicators, teaching you step by step how to use it for practical candlestick analysis, accurately identifying support and finding buying points.
Fibonacci is one of the most commonly used technical analysis tools among traders. Its core function is to combine historical price trends to predict potential support and resistance levels in the market. It is important to remember: Fibonacci is a confirming tool that cannot be used alone, and it is best combined with trend lines, trading volume, MACD, EMA, TD, and other indicator combinations. The more signals you overlay, the higher the reliability of the trade.
OKX App download link: https://jump.do/xlink?checkProxy=true&proxyId=24
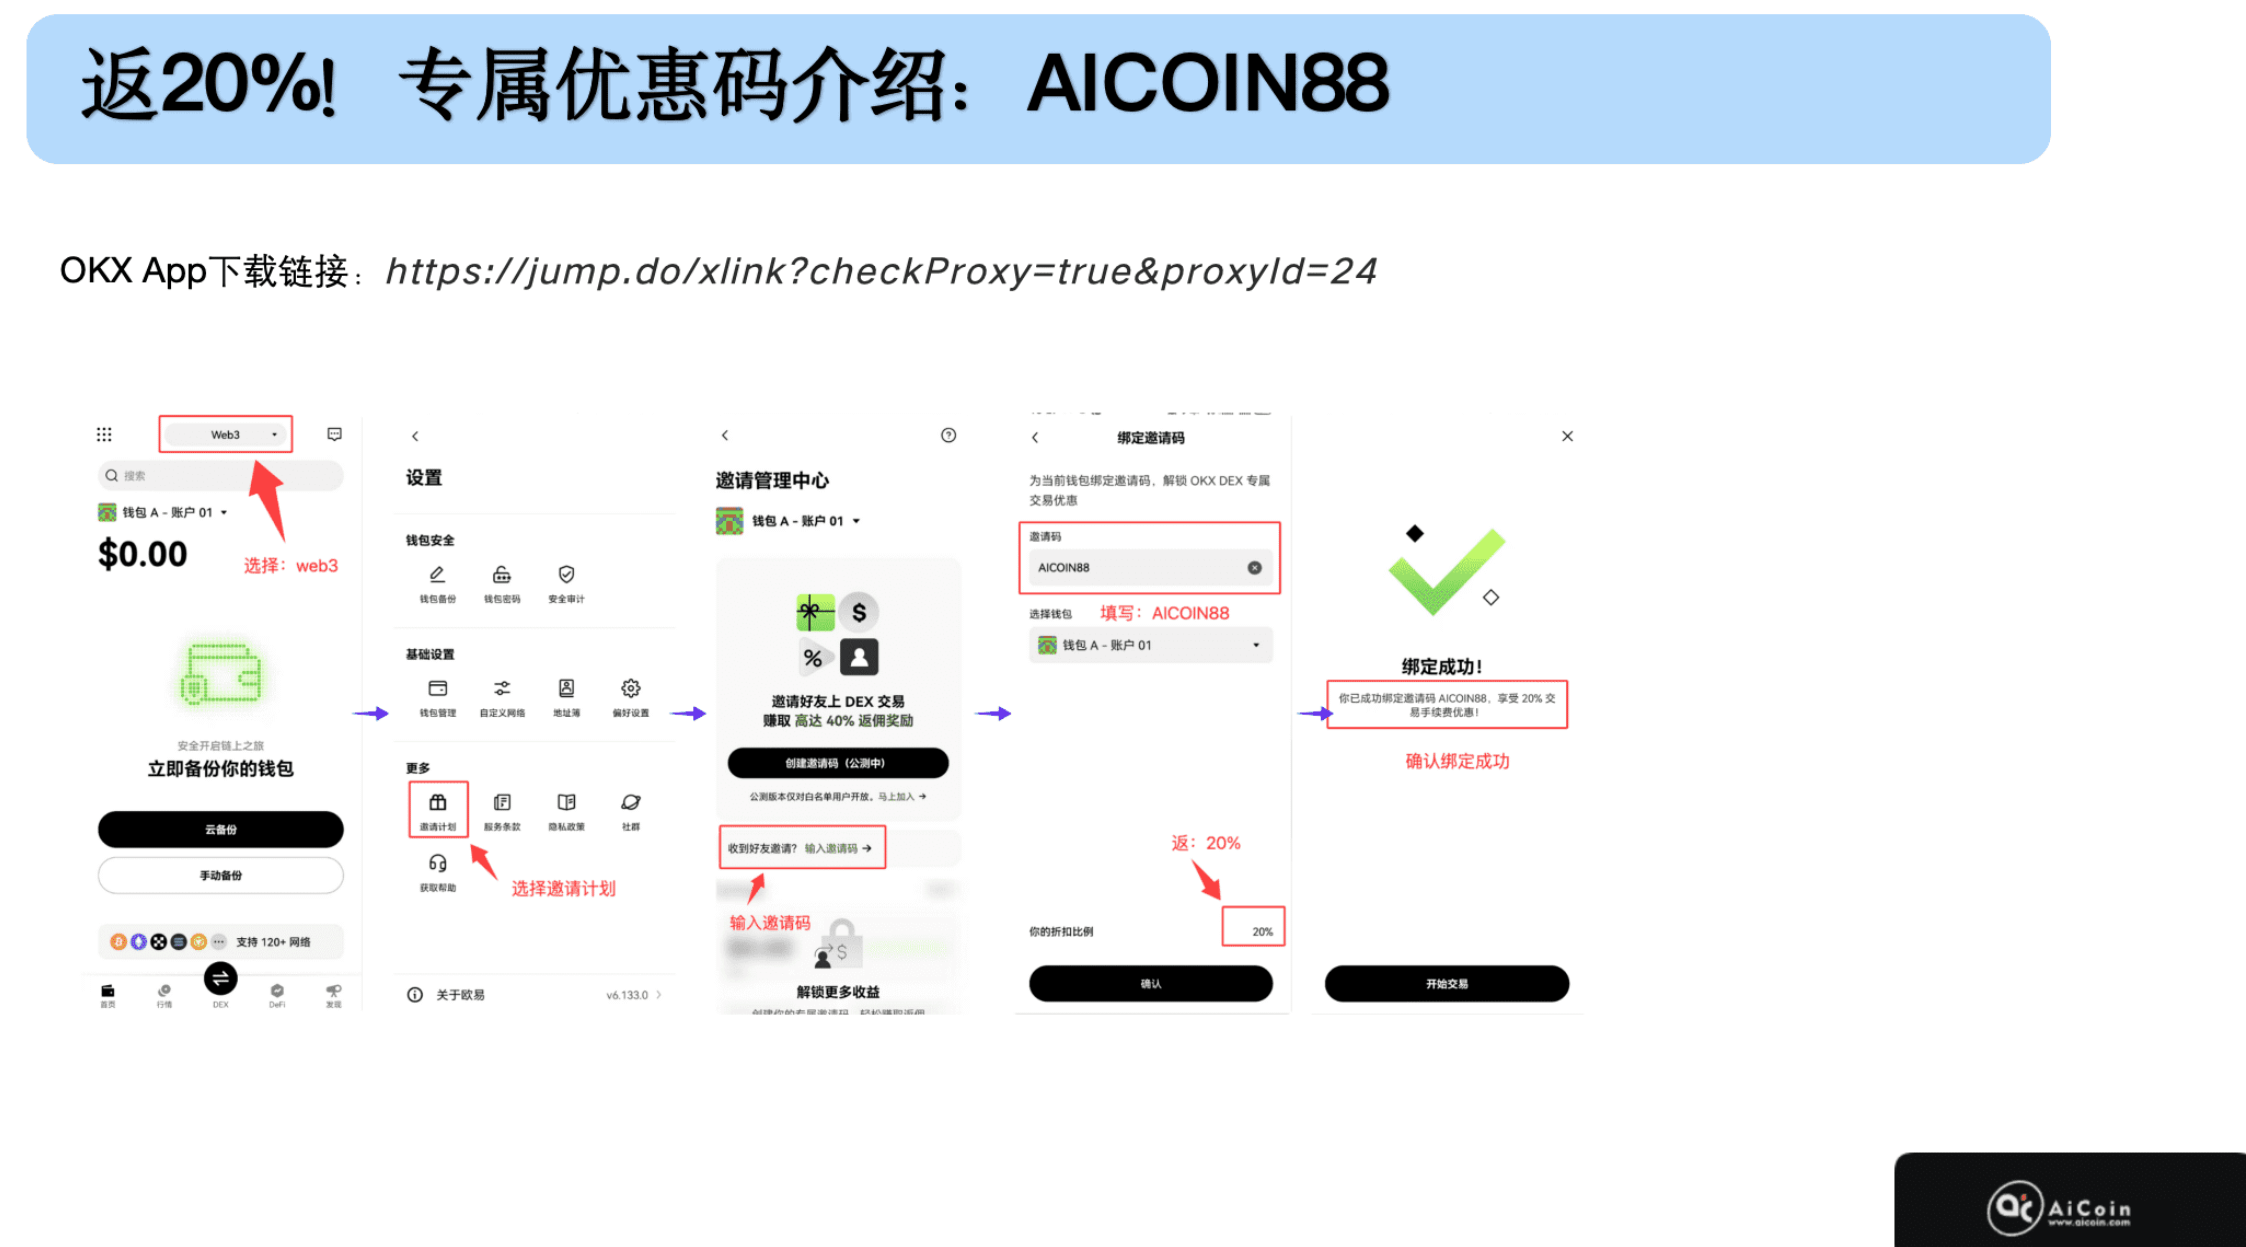
Friends who haven't bound yet can quickly complete the binding; the OKX wallet is very versatile: it can participate in airdrops with zero cost, earning pocket money just by spending time; it can also trade on-chain assets like oil and gold on Hyperliquid, connecting to global markets.
I. Core usage of Fibonacci
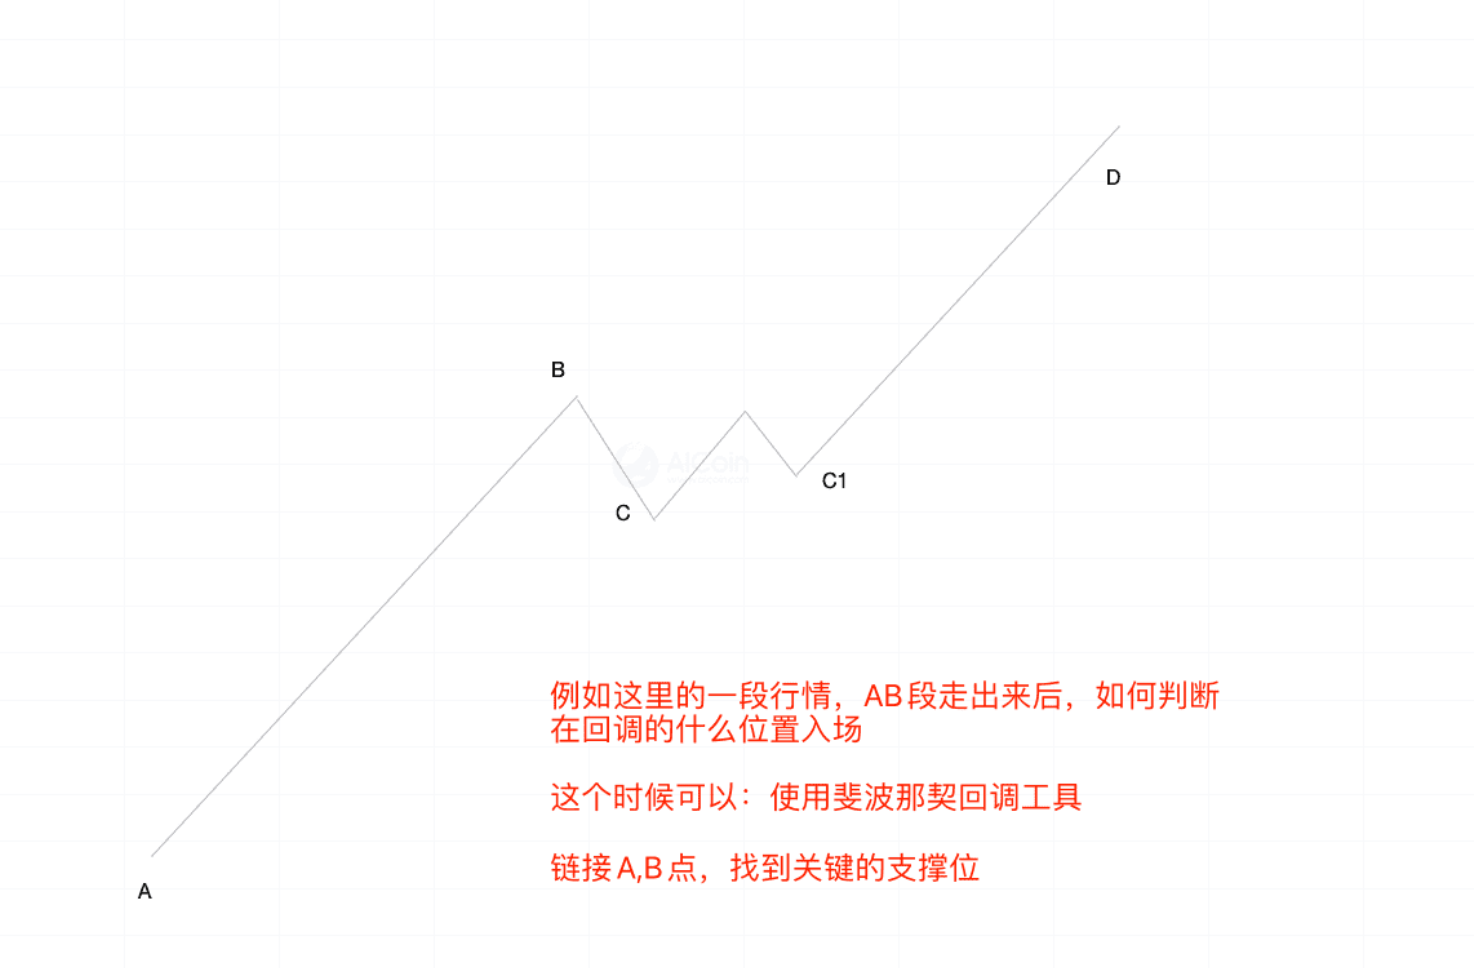
Core value: Find the best entry position, develop a precise stop-loss plan.
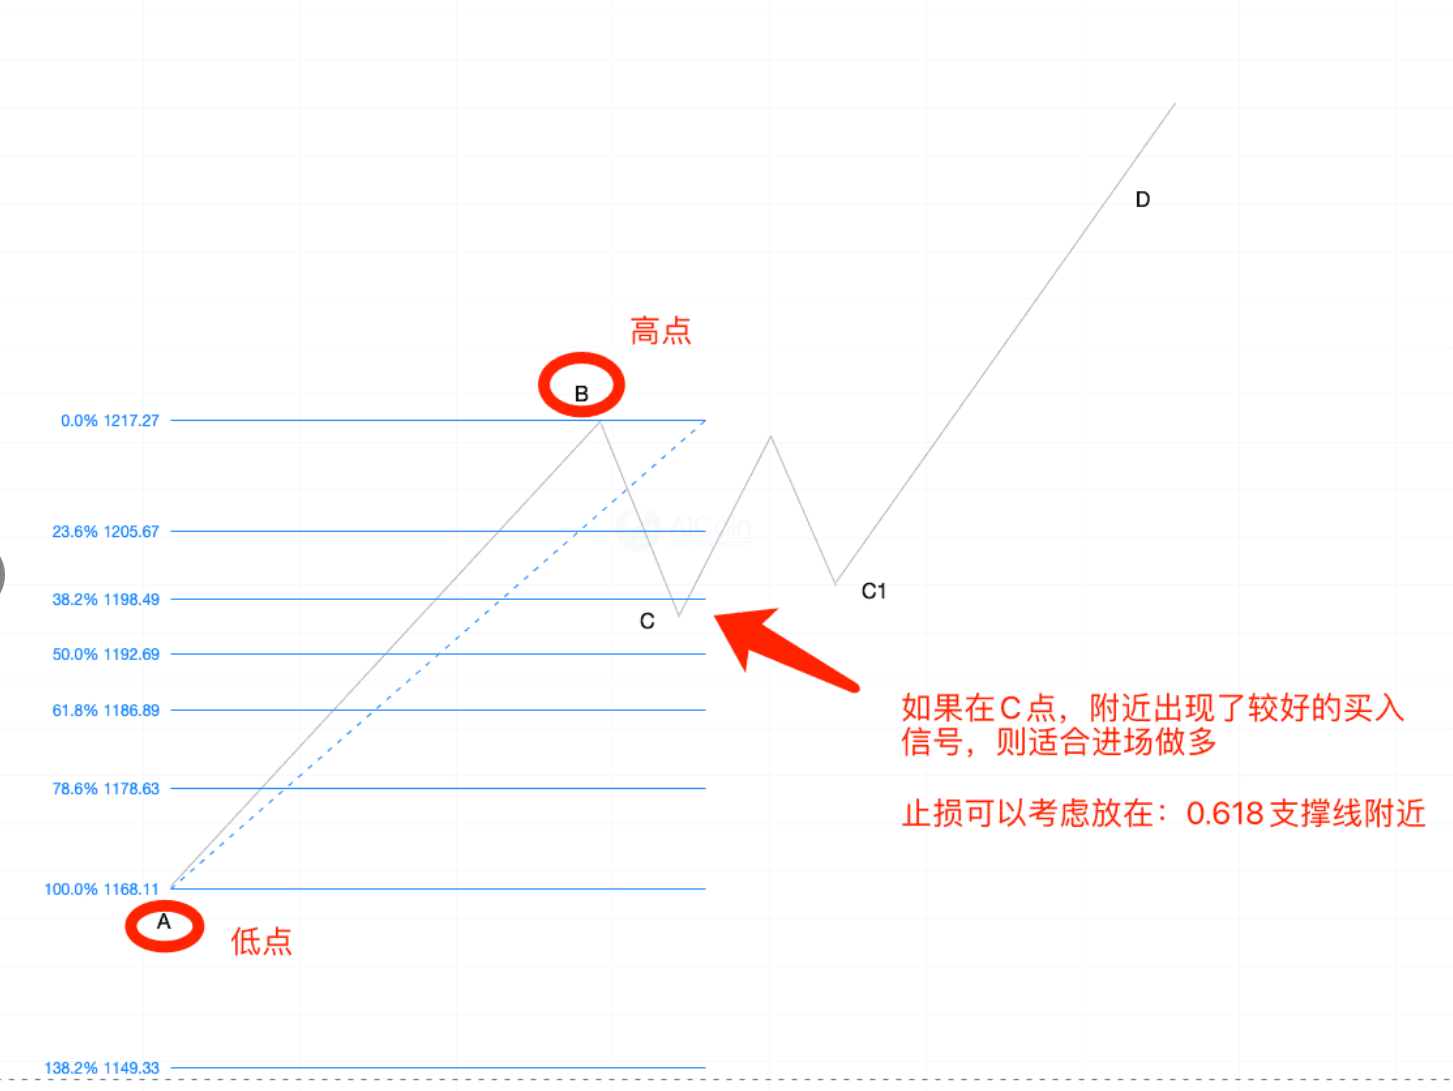
Bullish market: Connect low points to recent high points, focusing on the three major support levels of 0.382, 0.5, and 0.618.
Bearish market: Connect high points to recent low points, focusing on the three major resistance levels of 0.382, 0.5, and 0.618.
Key to practical operation: accurately grasp high and low points, and closely monitor key ratio levels.
II. How to choose high and low points? (Newbie zero threshold)
No need to get entangled in complex theories; just find based on this simple standard:
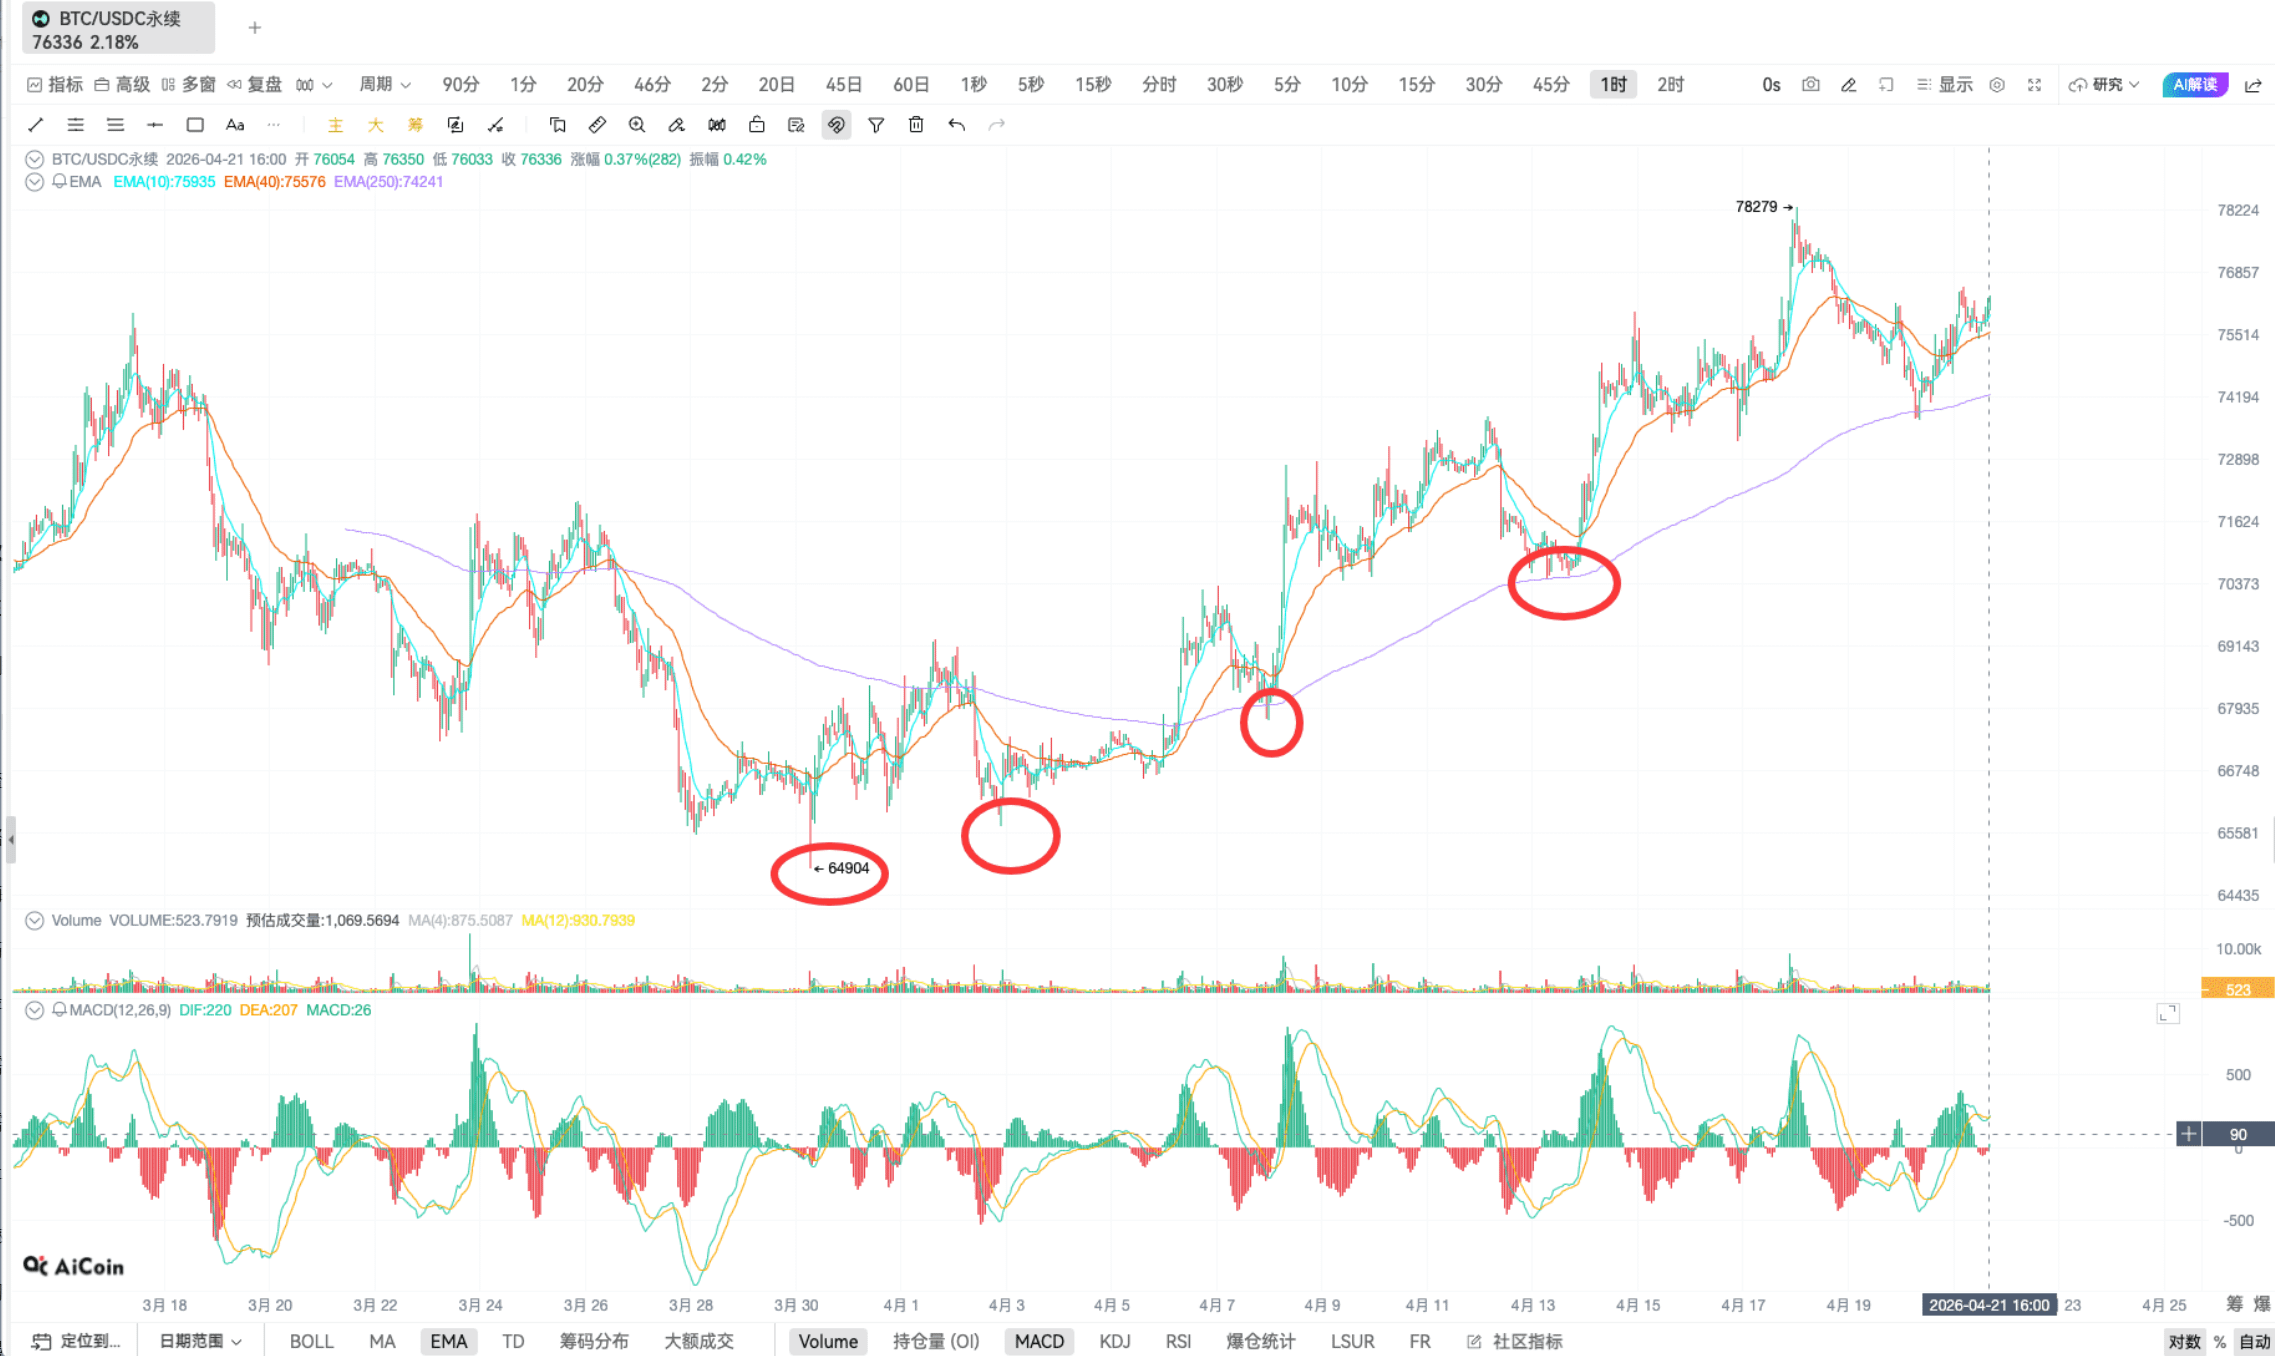
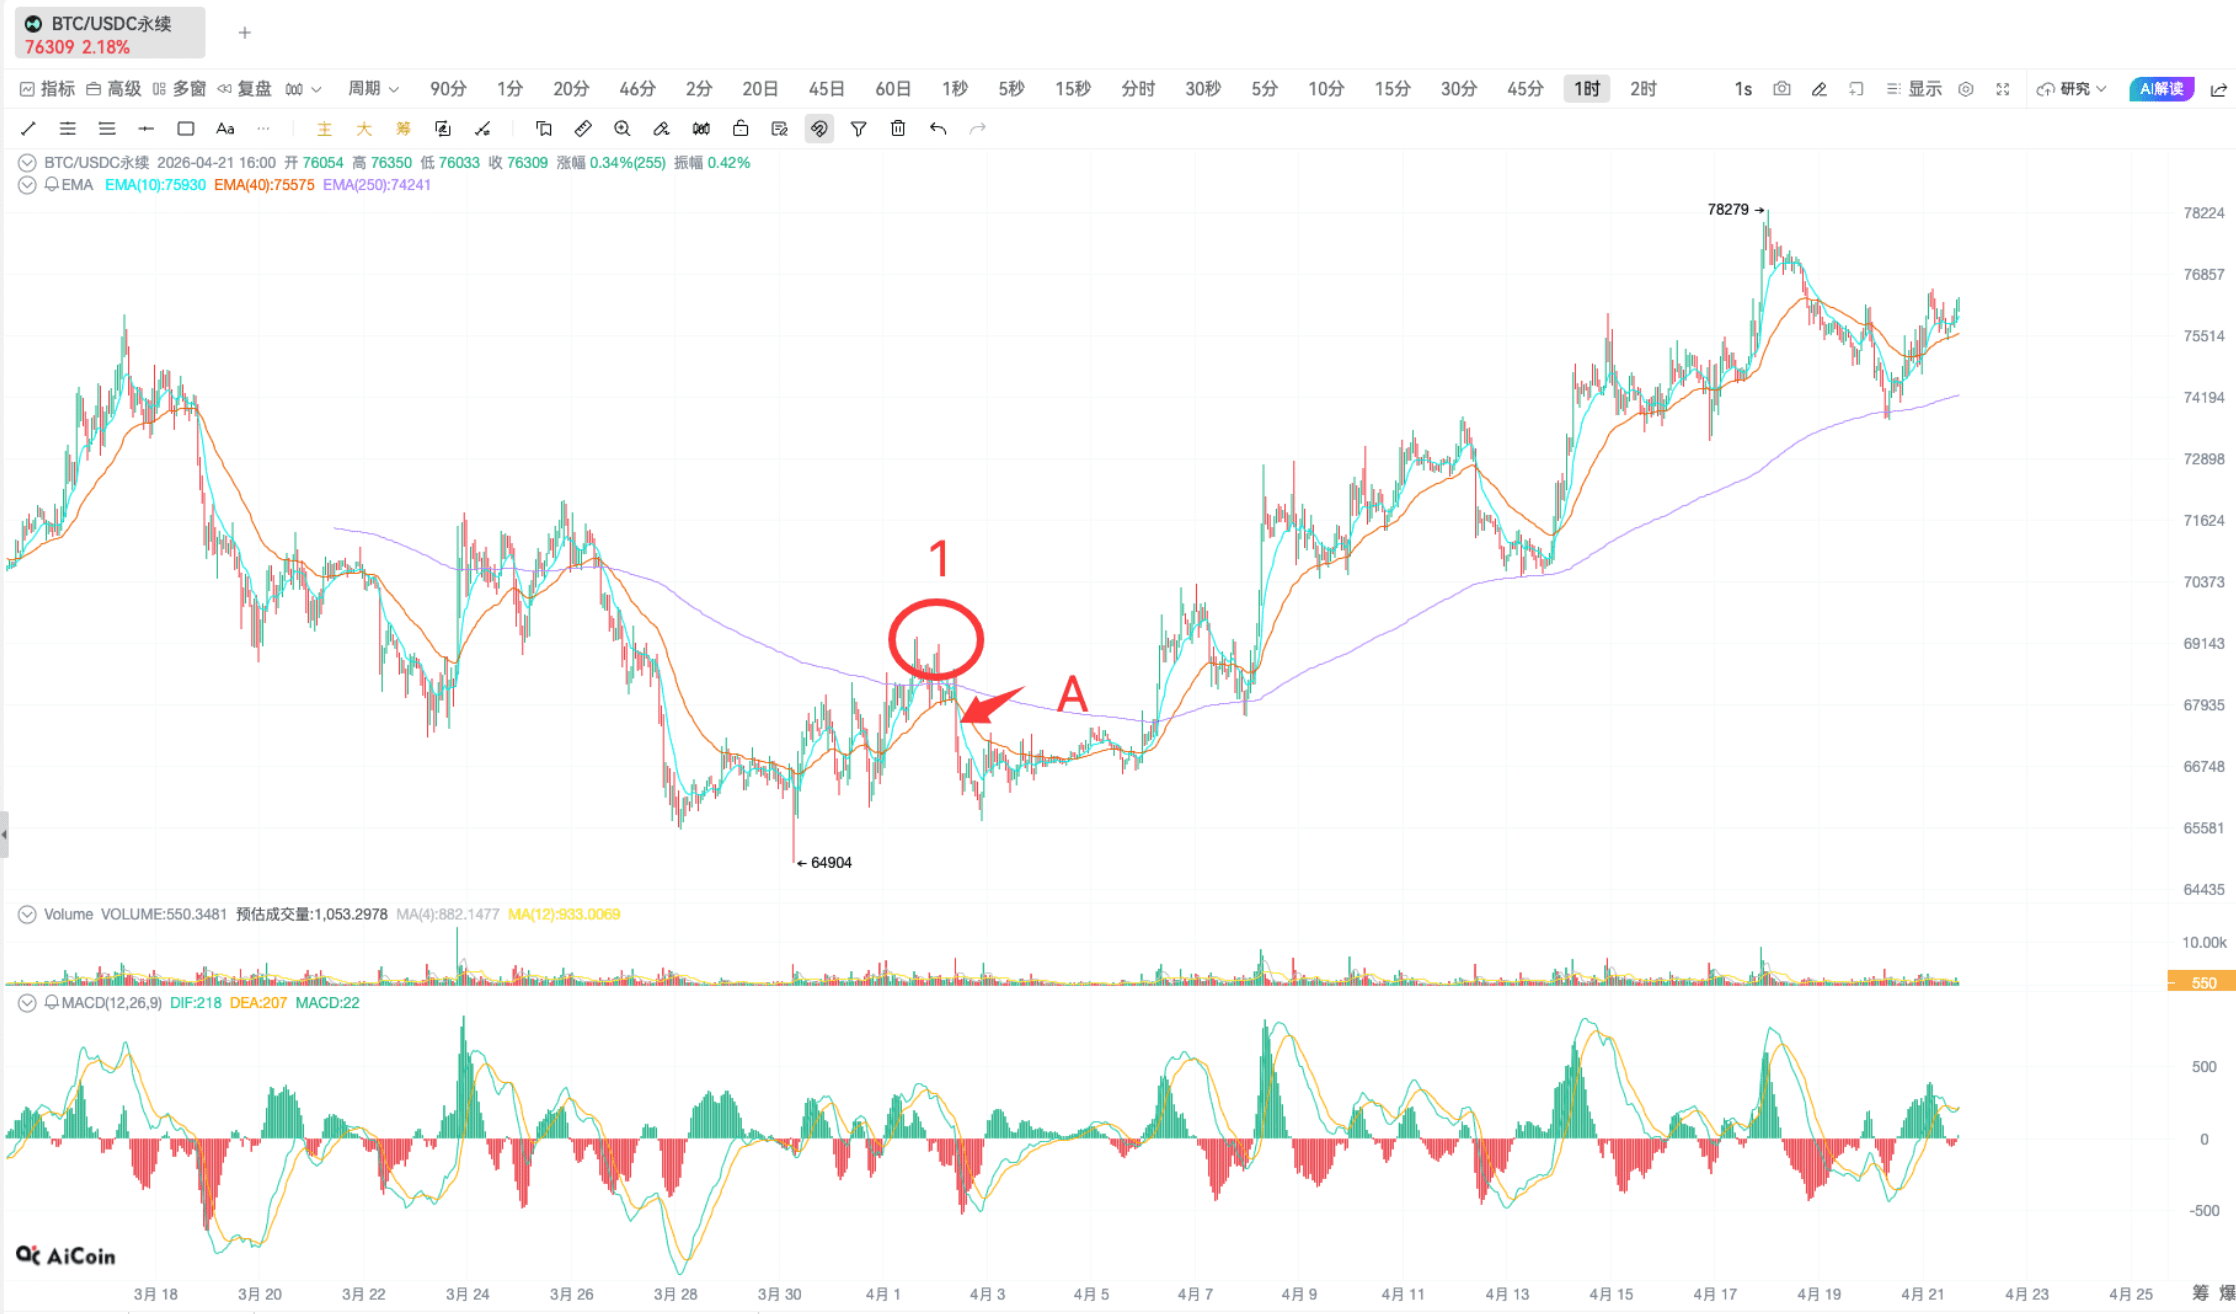
Low point: Clearly defined low price recently appeared in K-line (V-shaped bottom, stage low position)
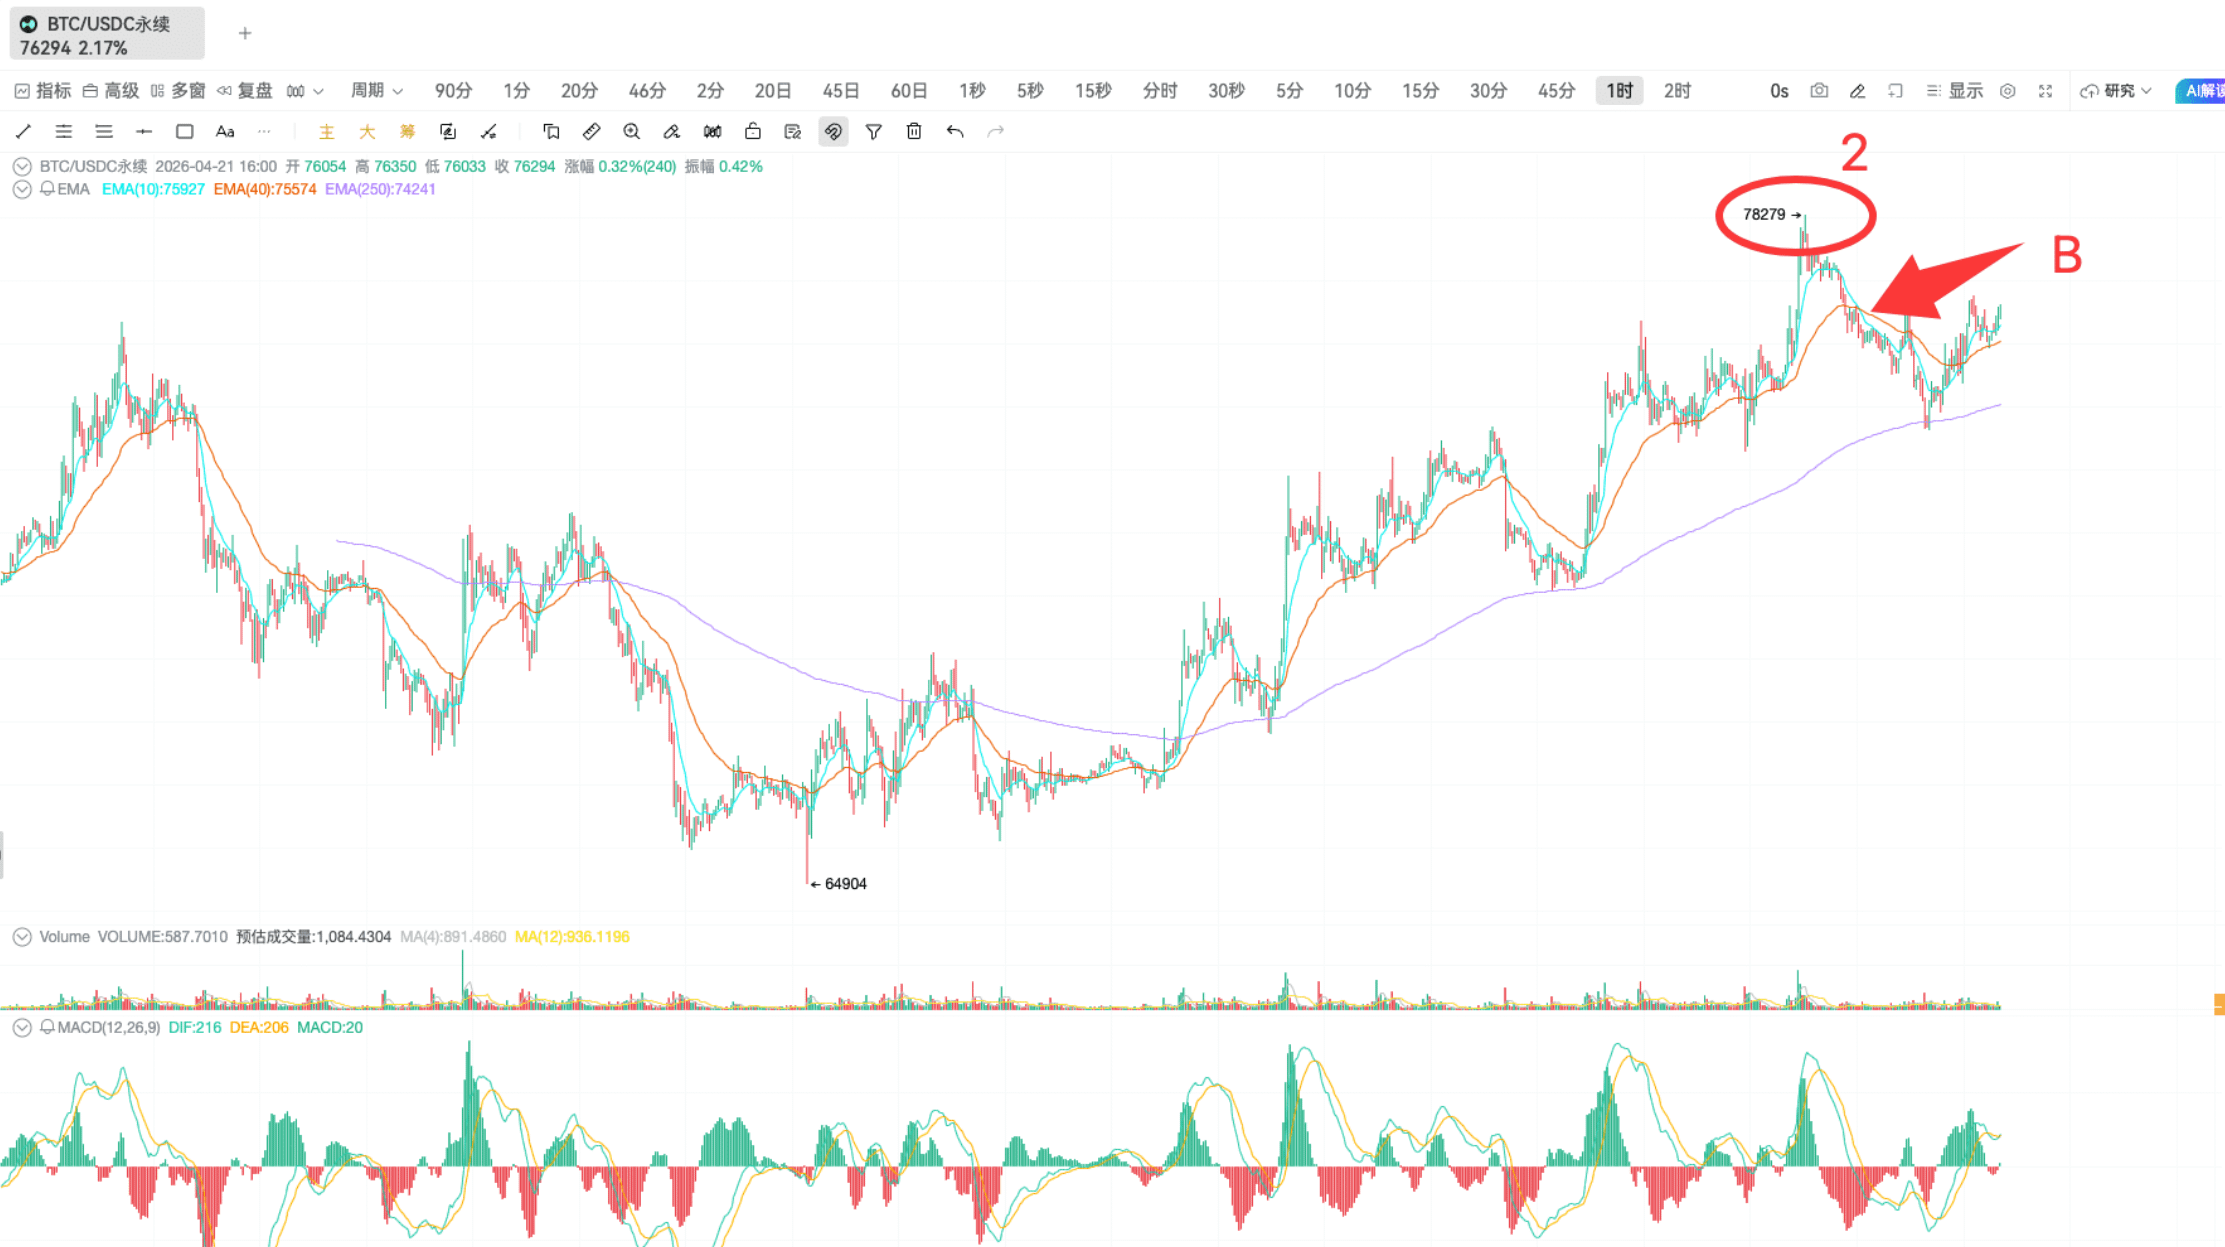
High point: K-line creates a new high and then retraces, forming a clear peak (only effective when it has moved out, not considered before retracement)
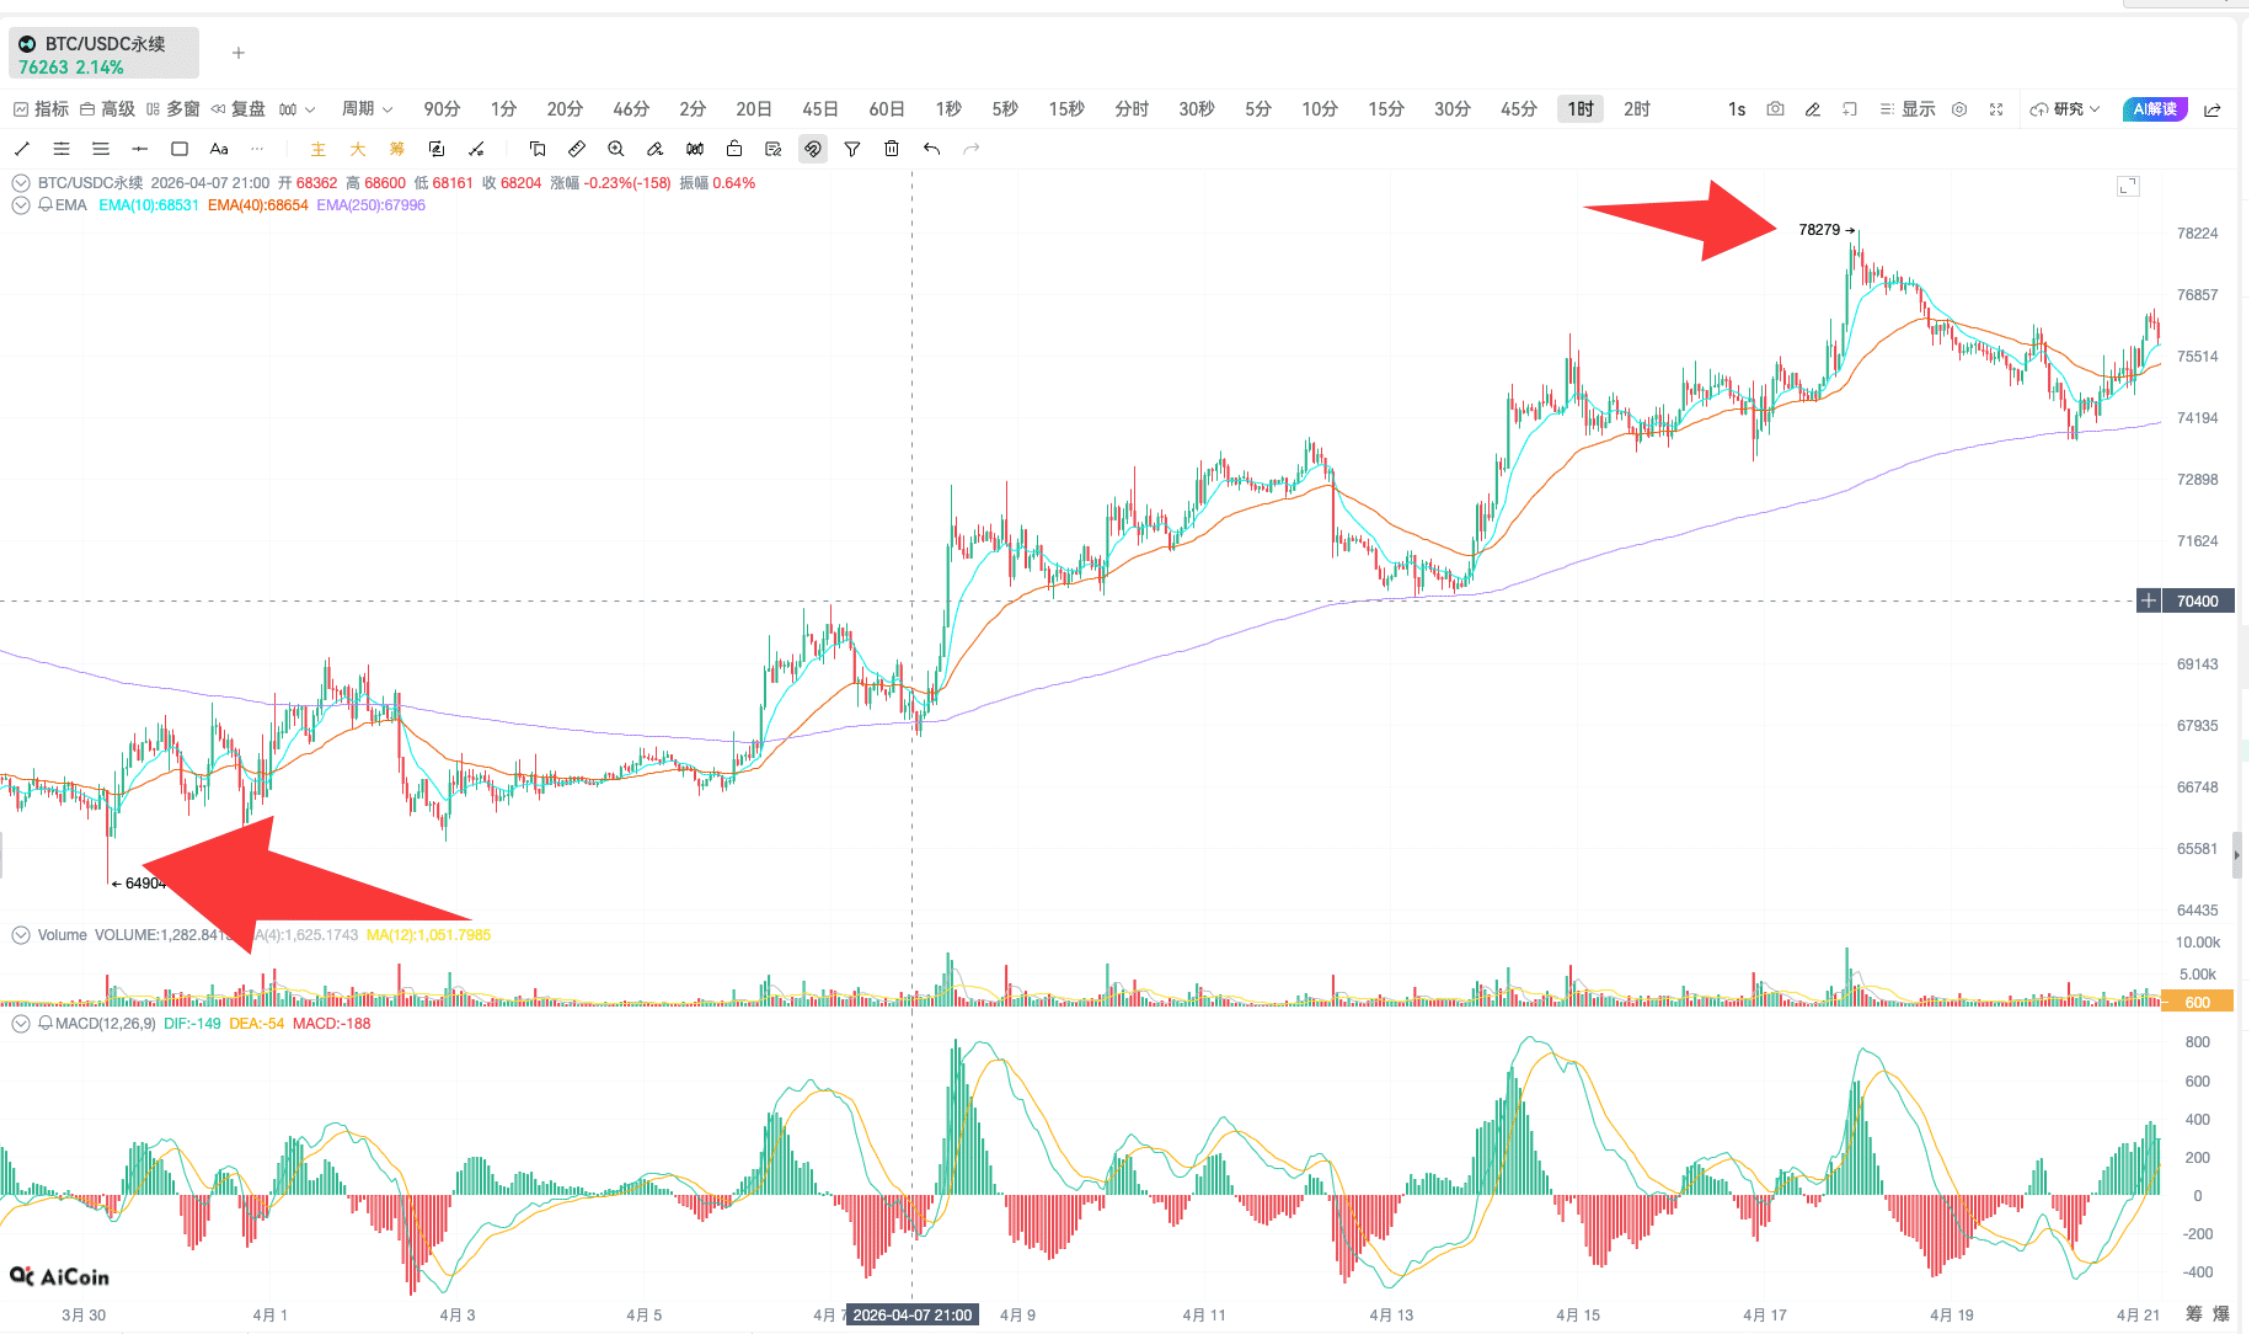
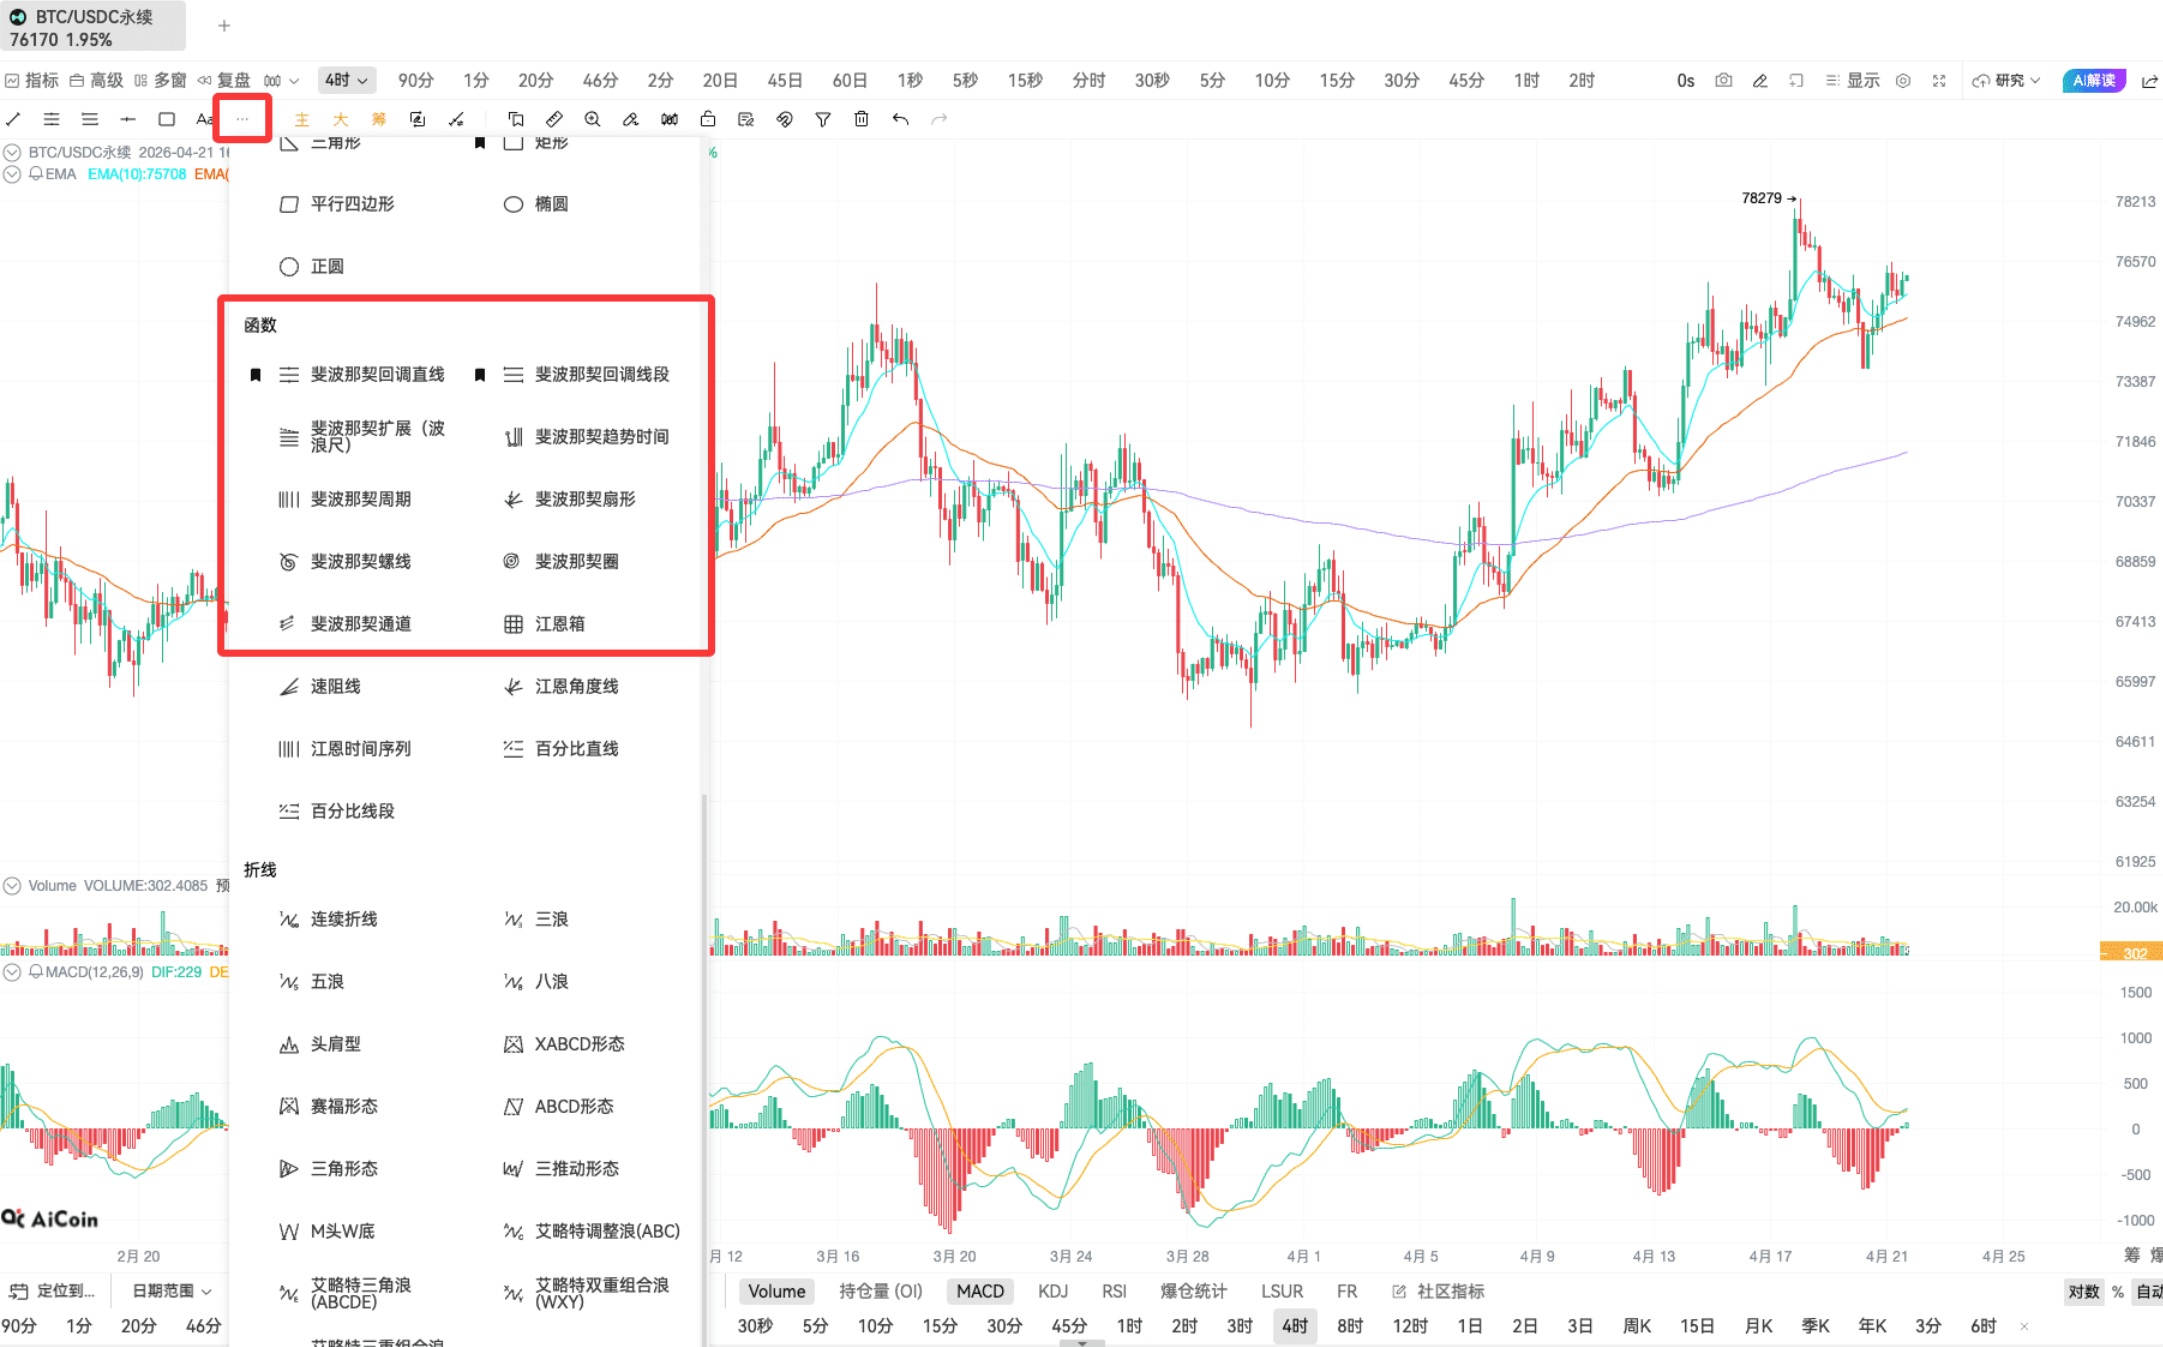
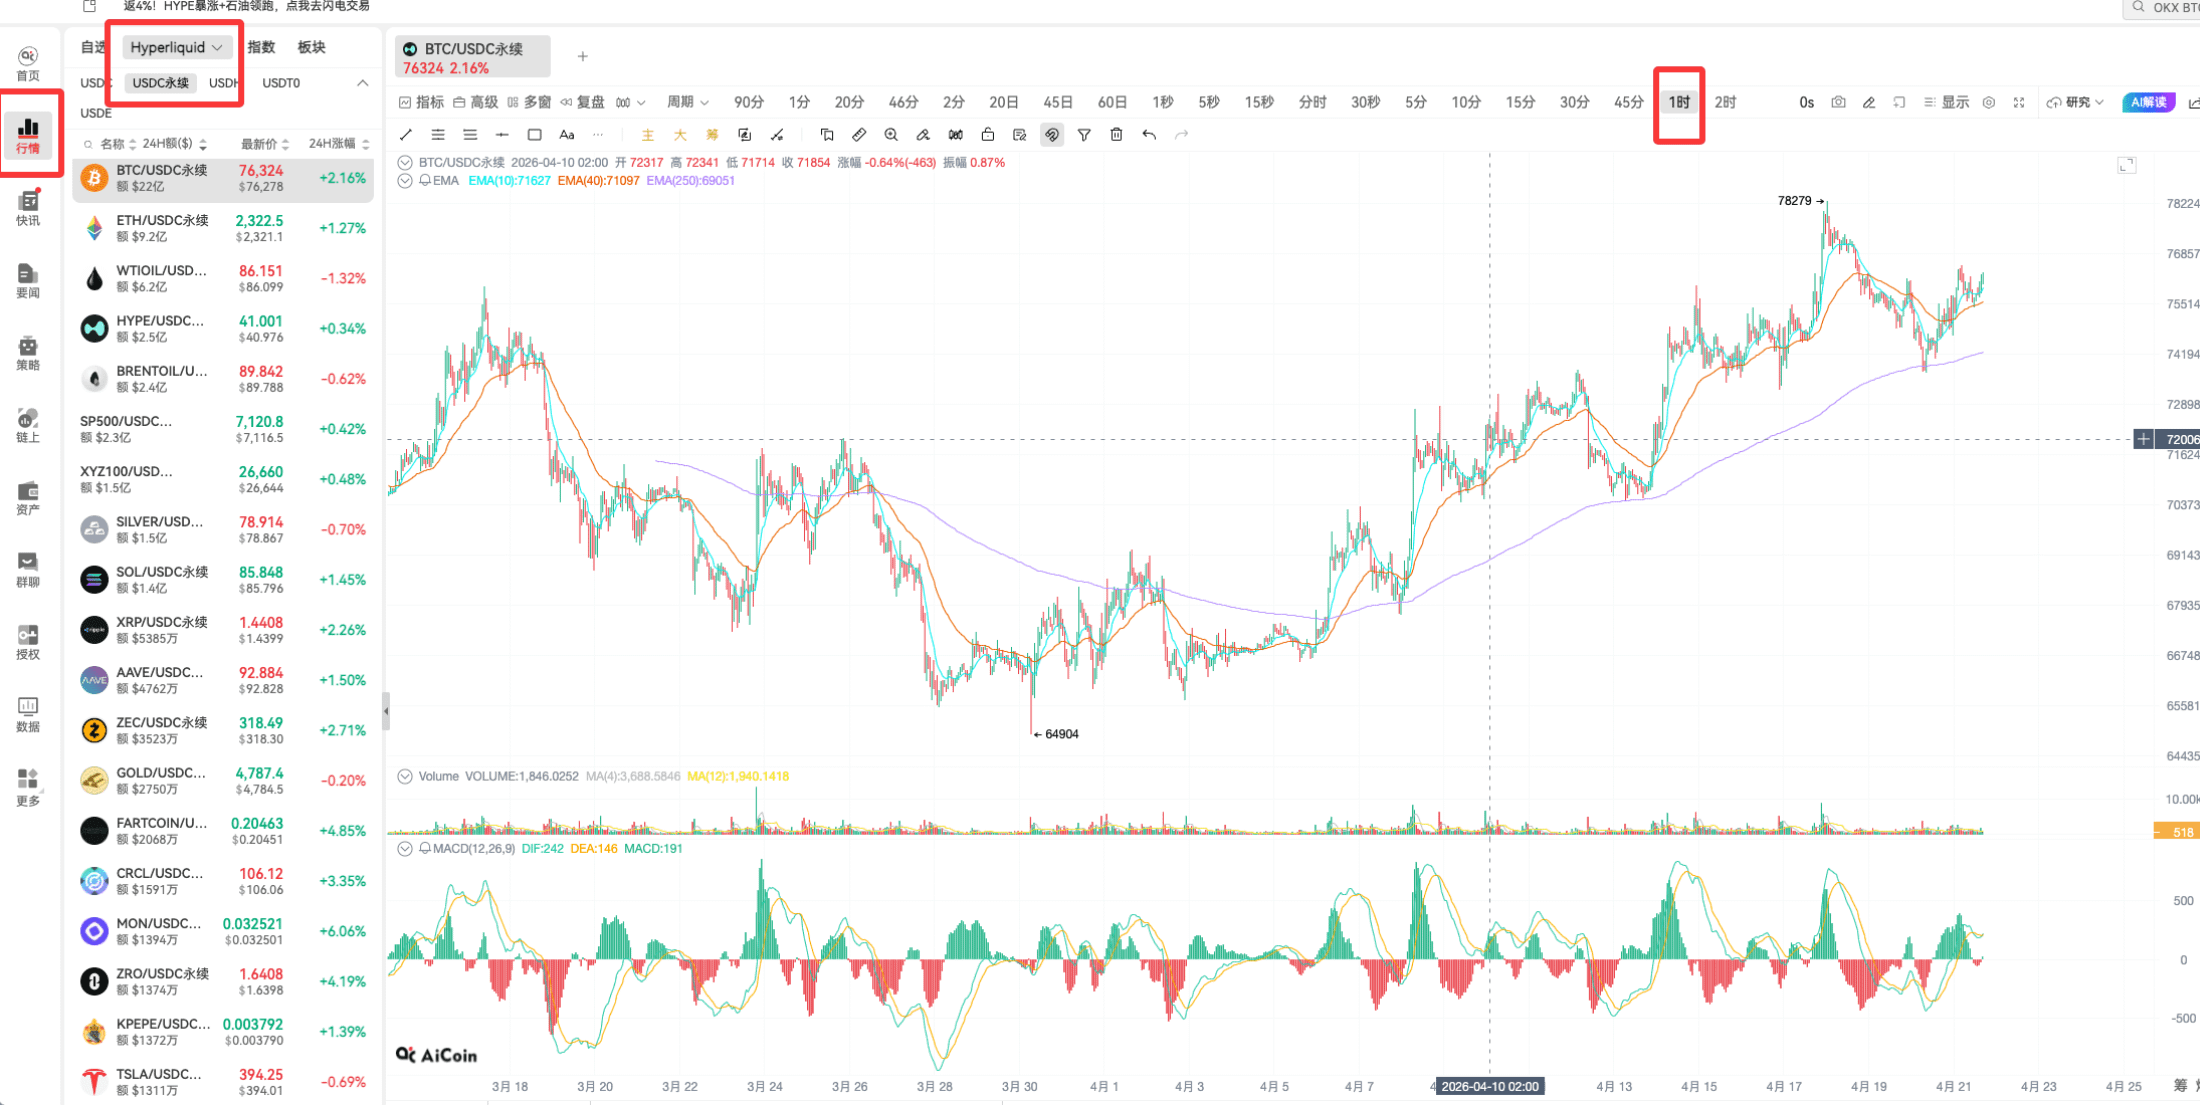
Real trading demonstration: Hyperliquid platform BTC perpetual contract 1-hour cycle
For short-term trading: choose the nearest high and low points (corresponding to the theory of 'one wave of market')
For swing trading: choose the maximum high and low points of the stage (corresponding to the theory of 'one segment of market')
III. Essential principles: Algorithm consistency
When drawing Fibonacci, it must be fixed standards; absolutely do not mix shadows and real bodies:
If you are accustomed to using shadows (pin bars) to determine high and low points, then use shadows throughout.
If you are used to using K-line bodies to determine high and low points, then use bodies throughout.
In my personal analysis, I often use candlestick shadows as high and low points, which are more in line with the true market fluctuations. Maintaining standardization ensures a systematic analysis.
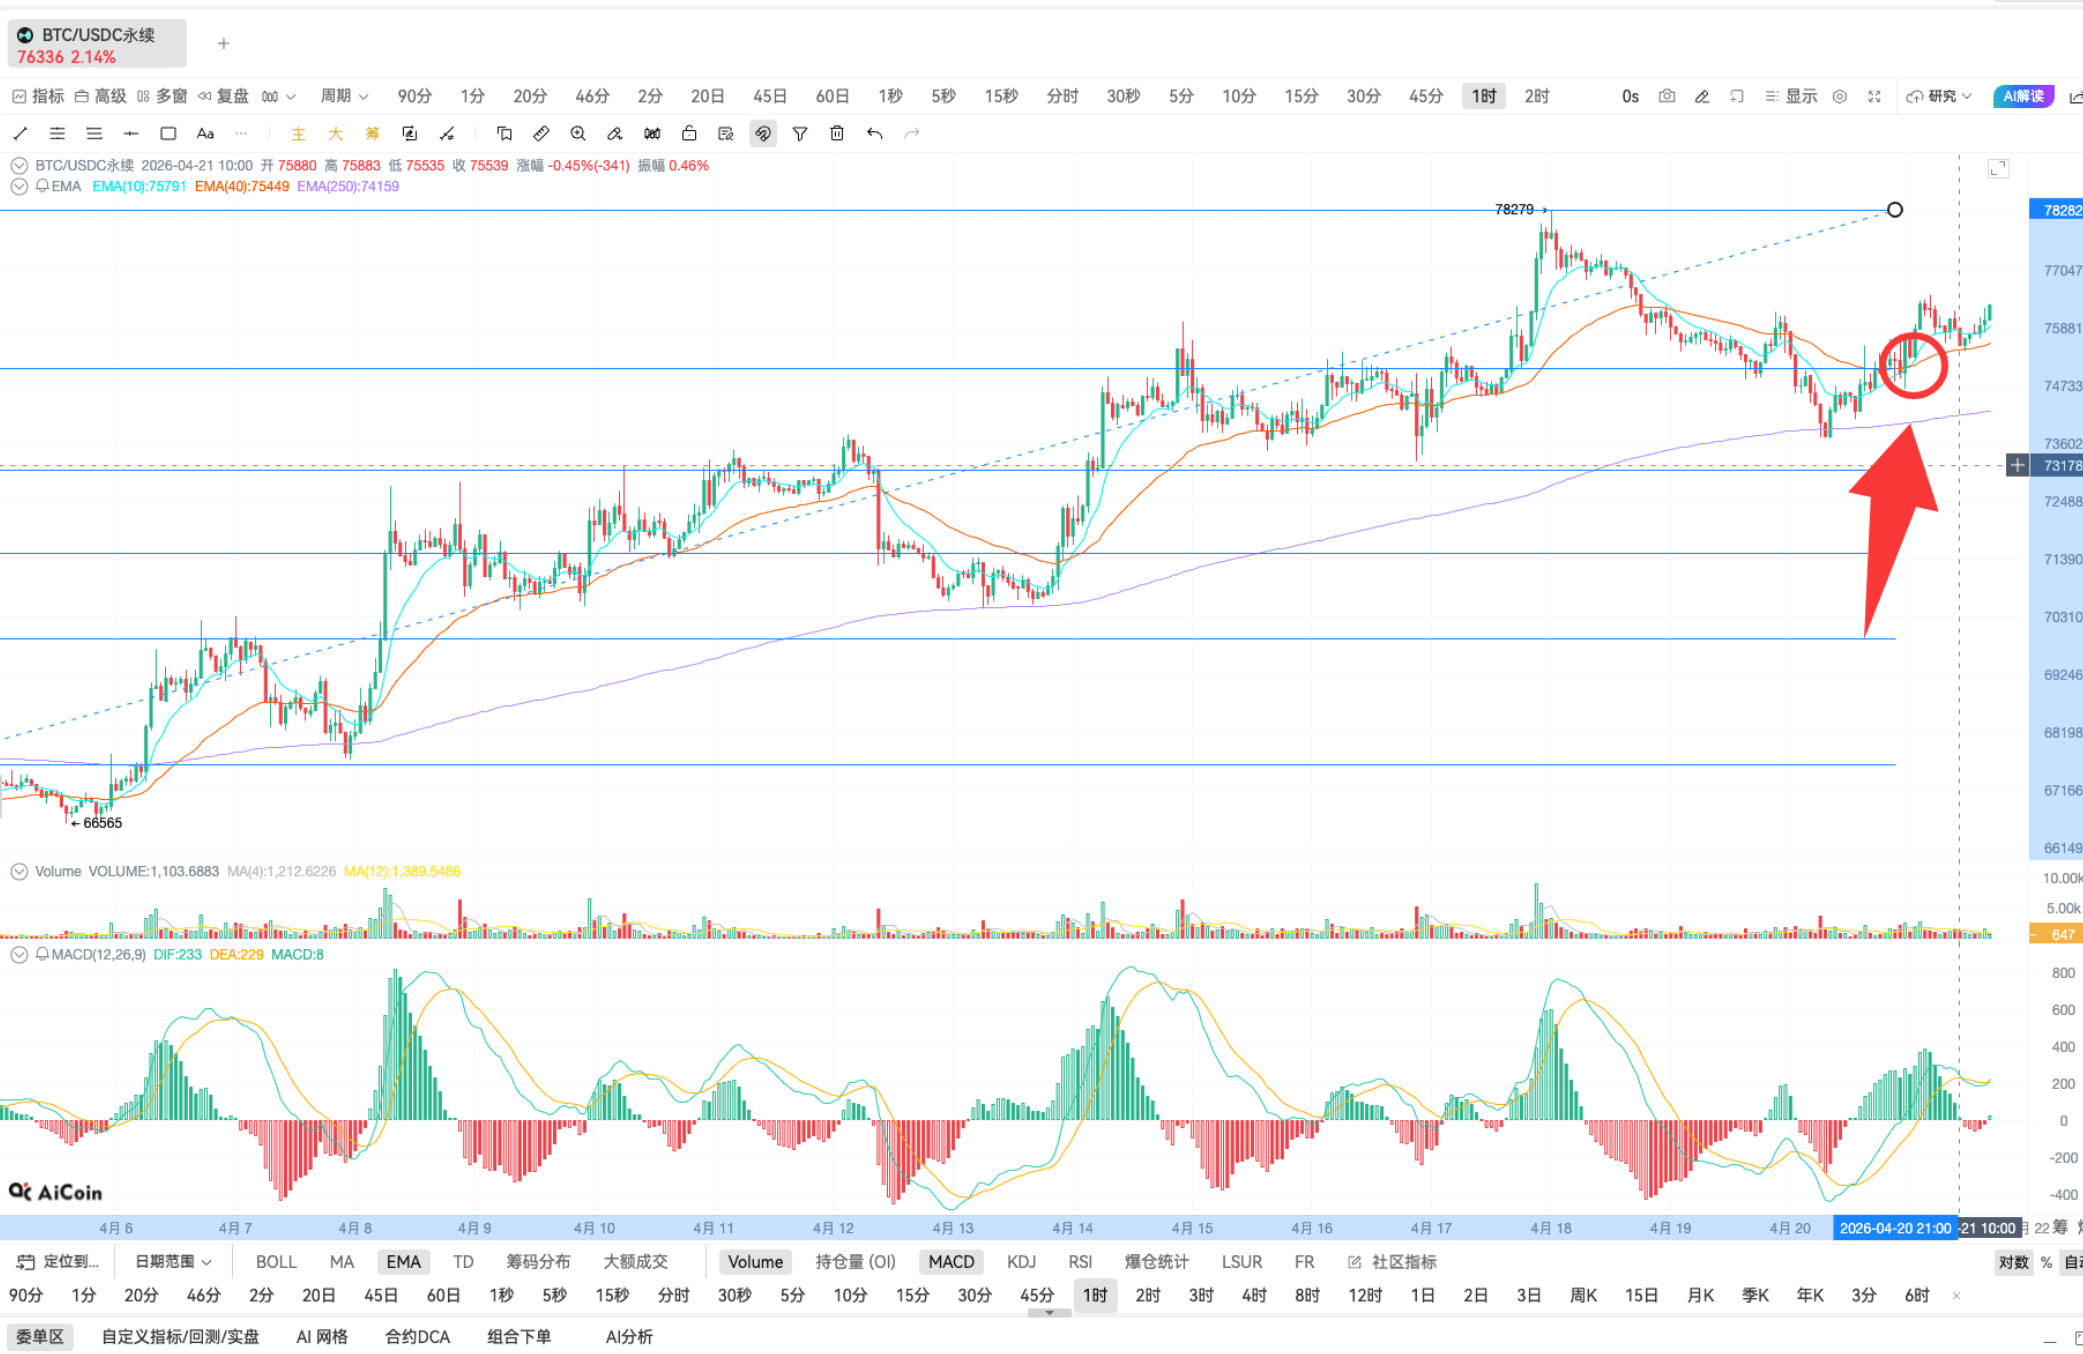
IV. Indicator Overlap Practical Combat (The Strongest Combination Strategy)
Fibonacci + EMA + MACD, three signal resonance, greatly improves win rate:
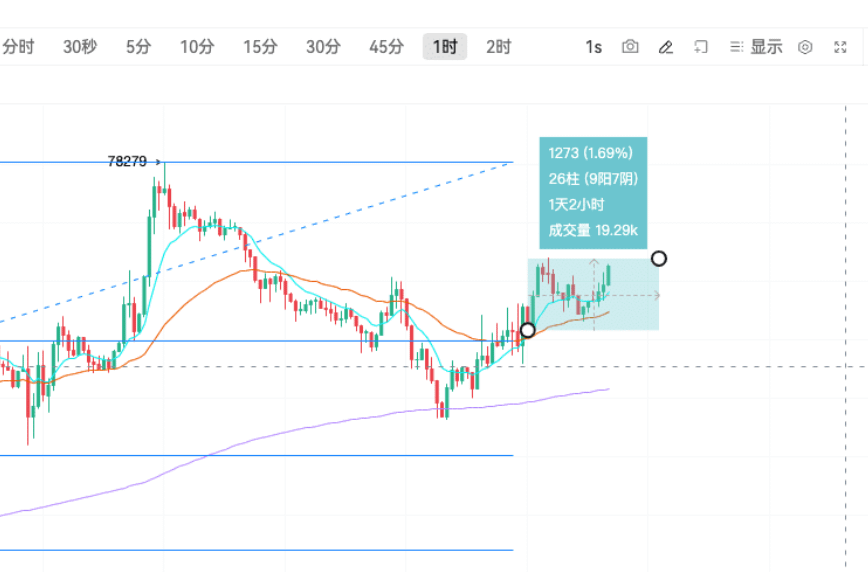
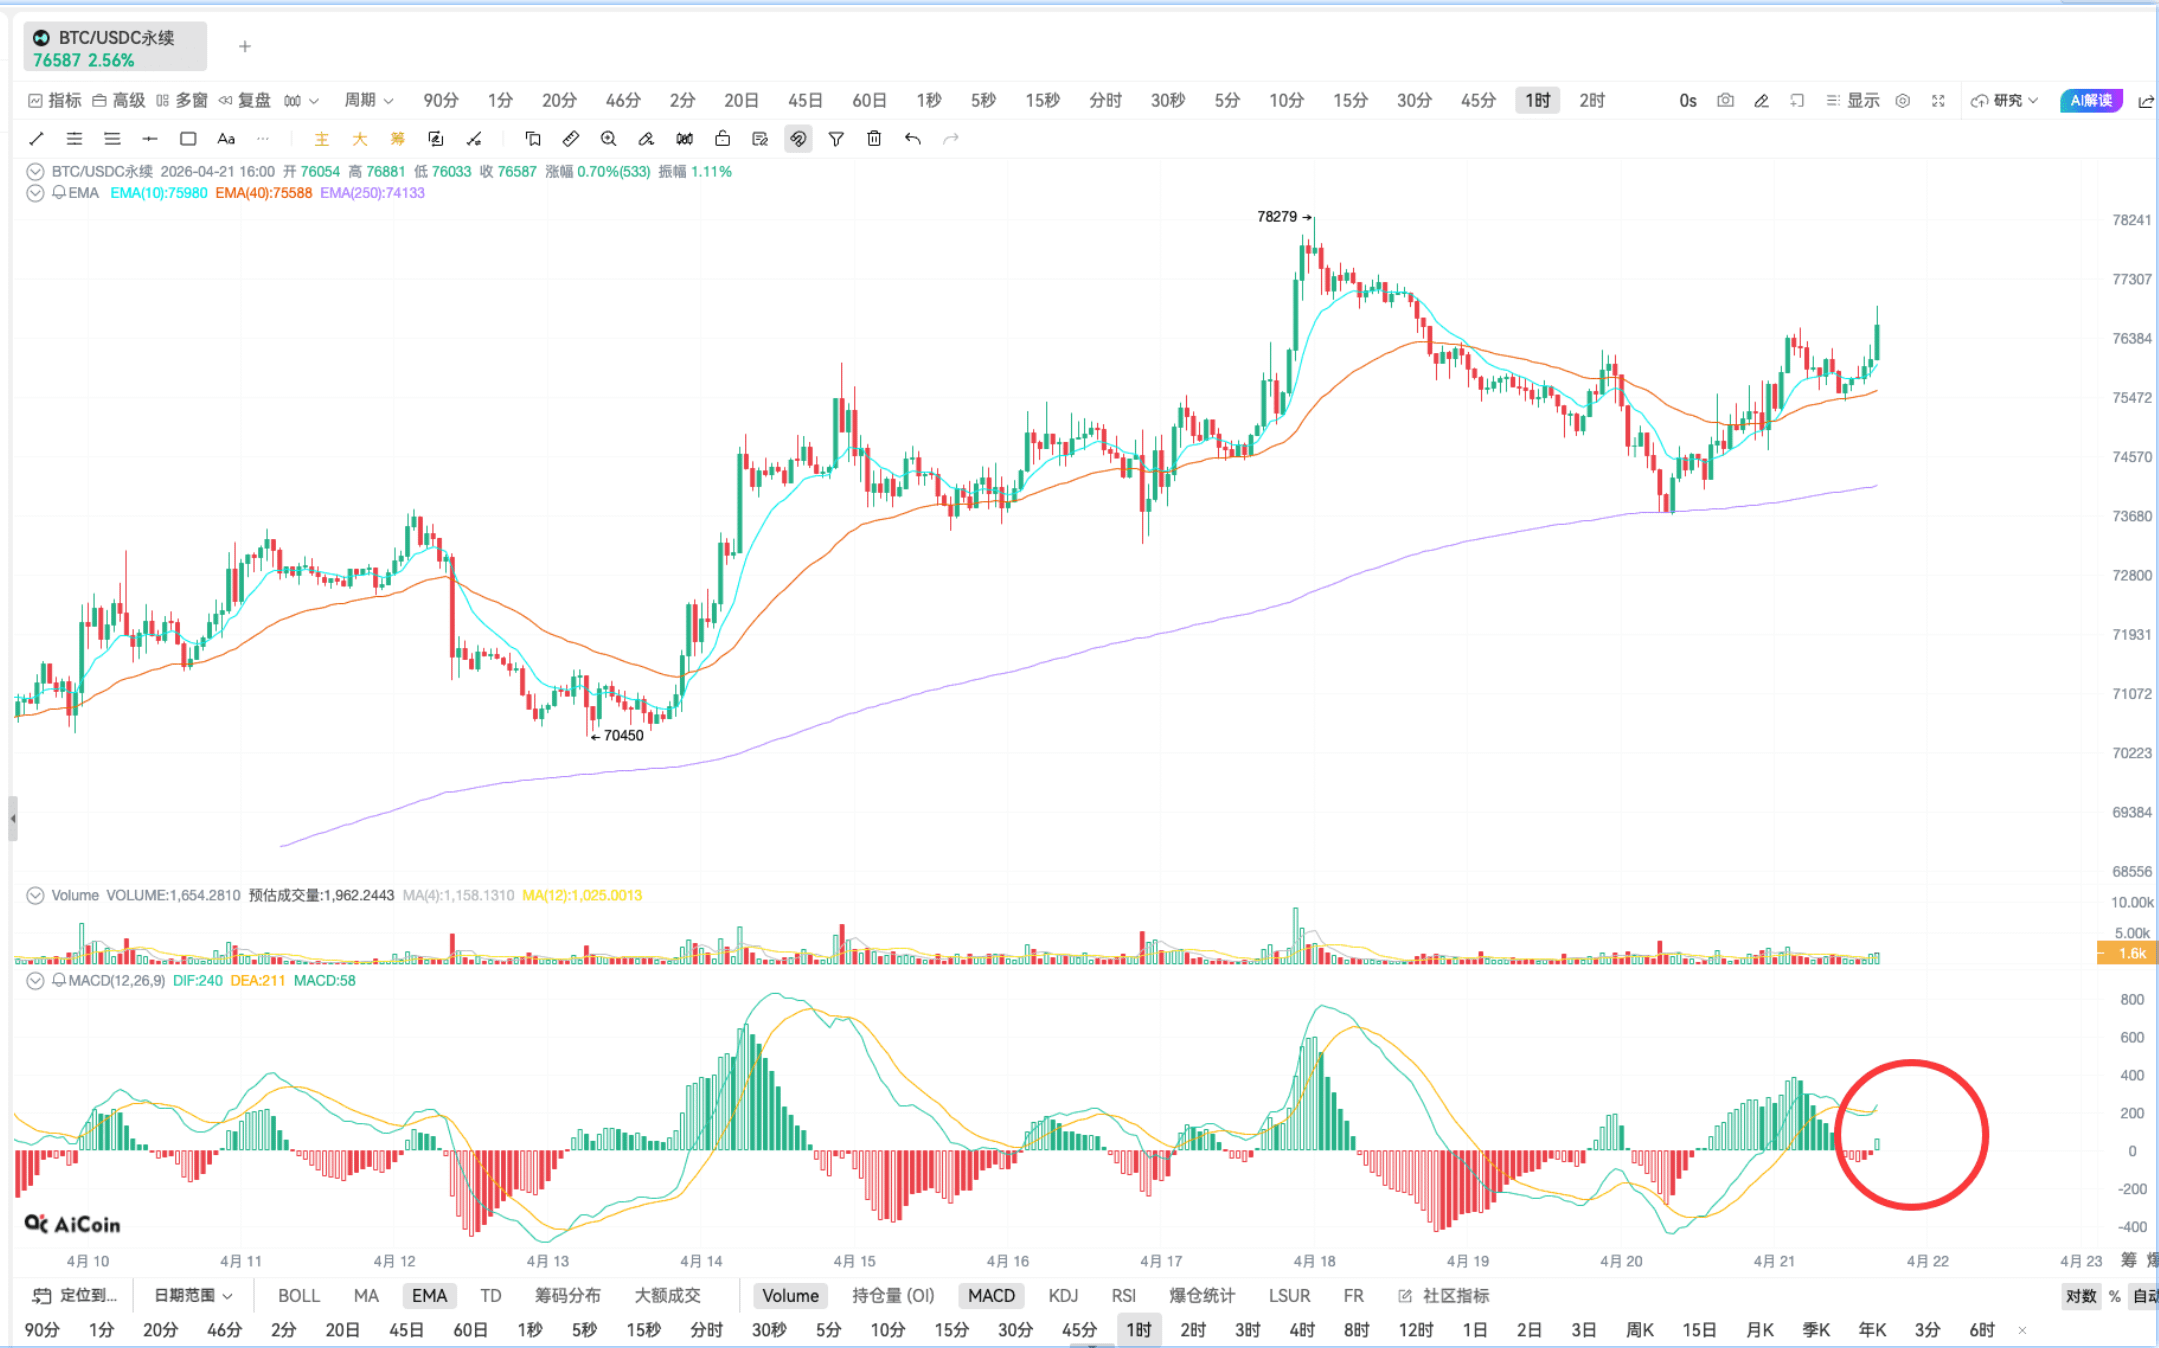
1-hour cycle practical rising market connects, price retraces to 0.236 strong support level, simultaneously triggering:
EMA: Price above EMA250 (bullish big trend) + EMA10 golden cross EMA40 signal confirmation, price directly rises 2%, clear support, and stronger confidence in entry.
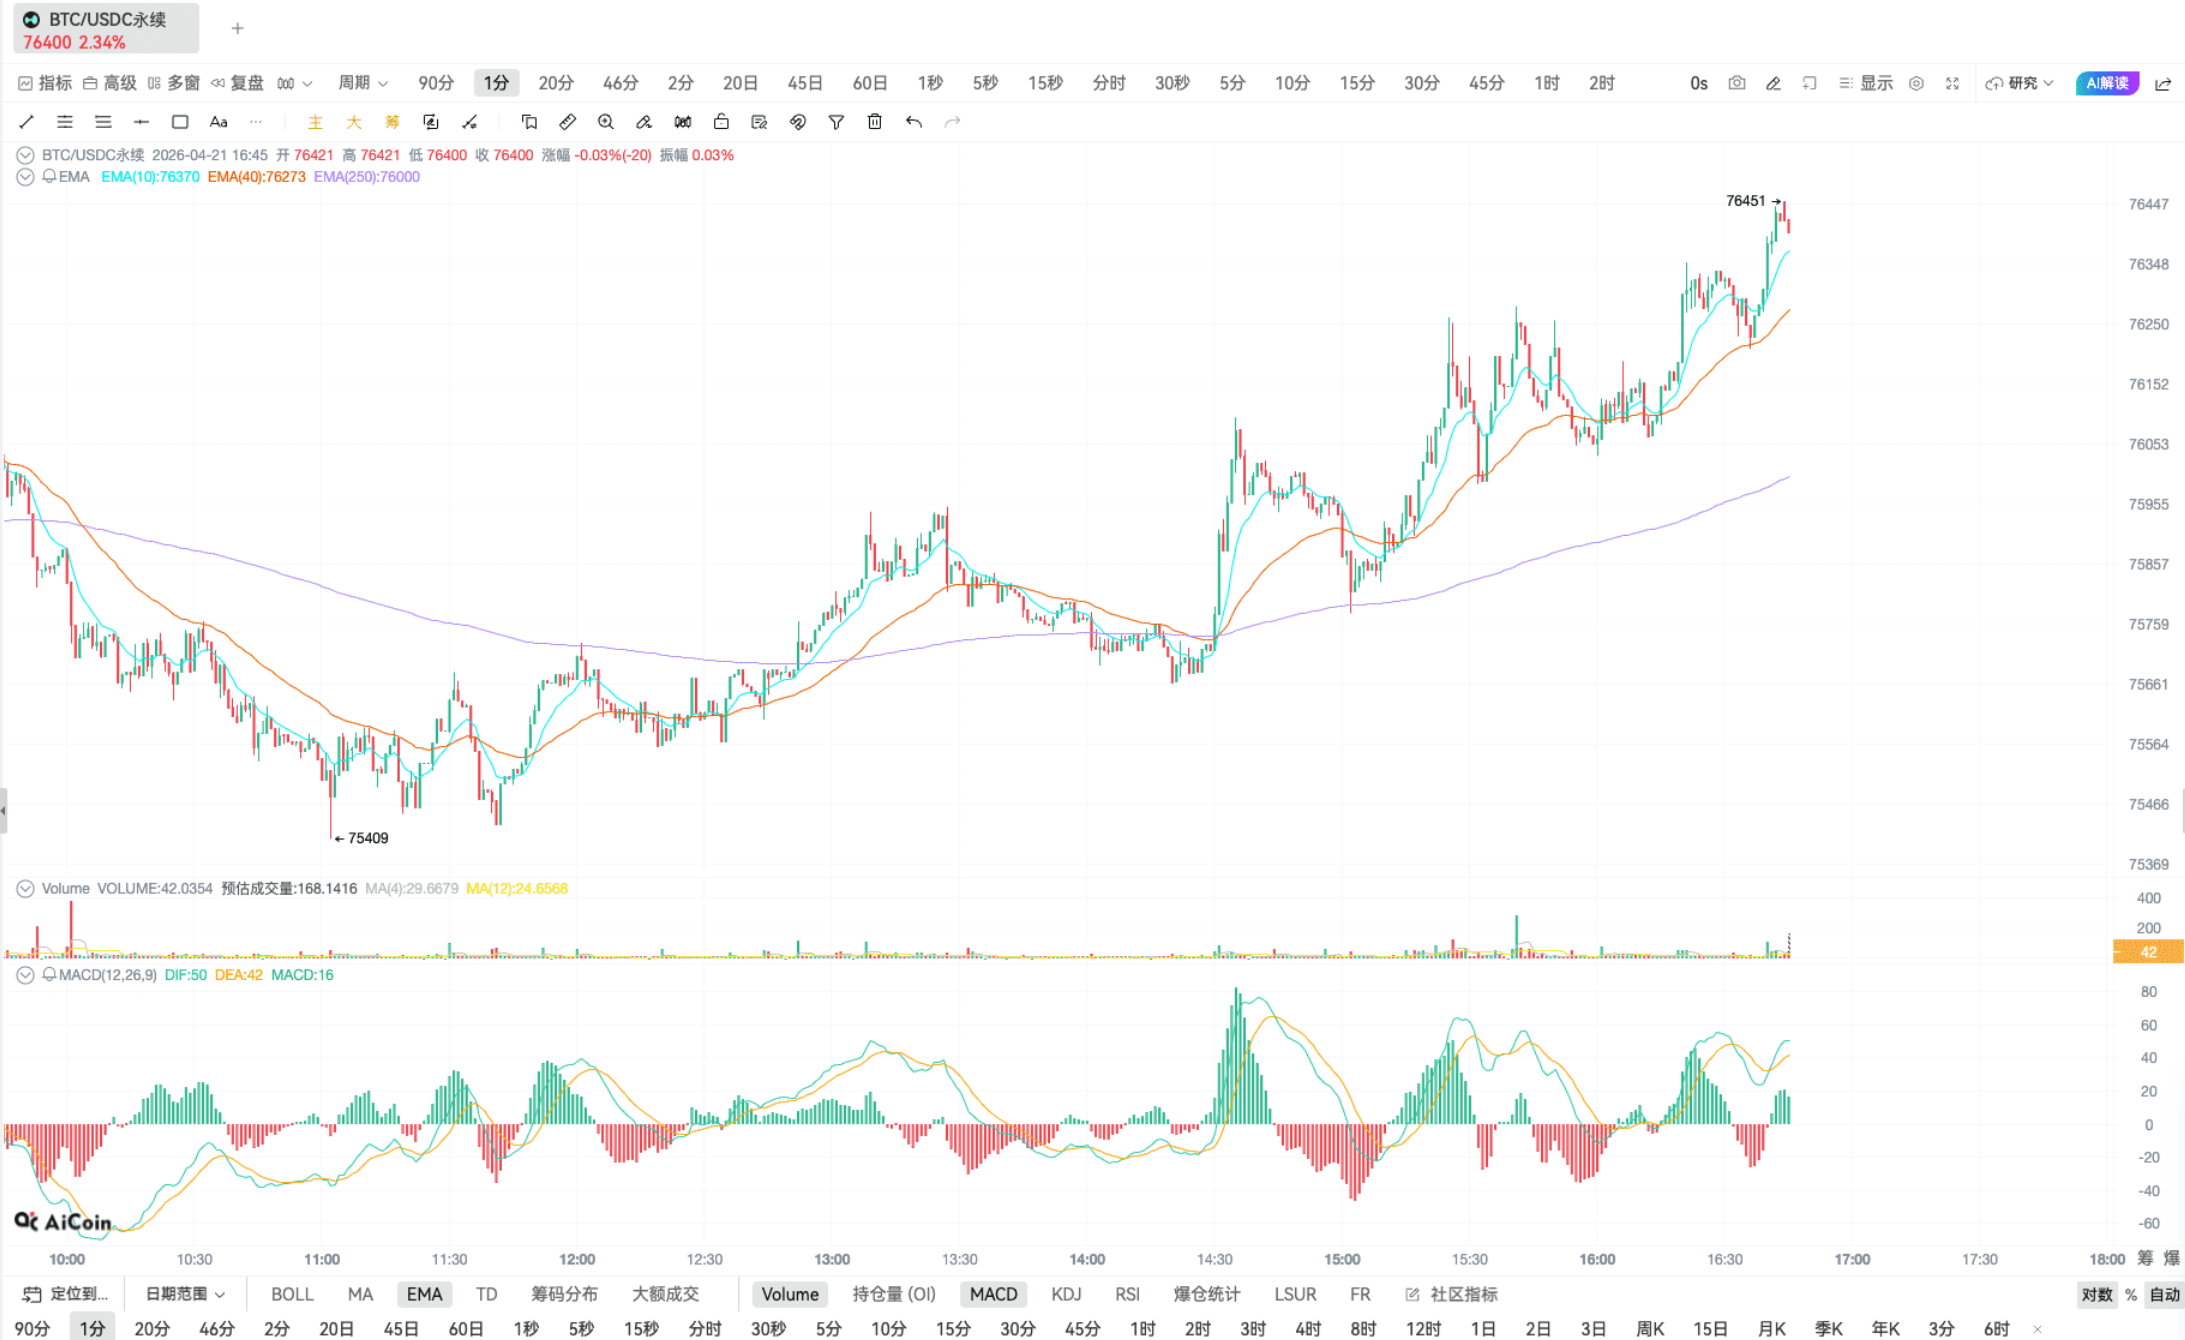
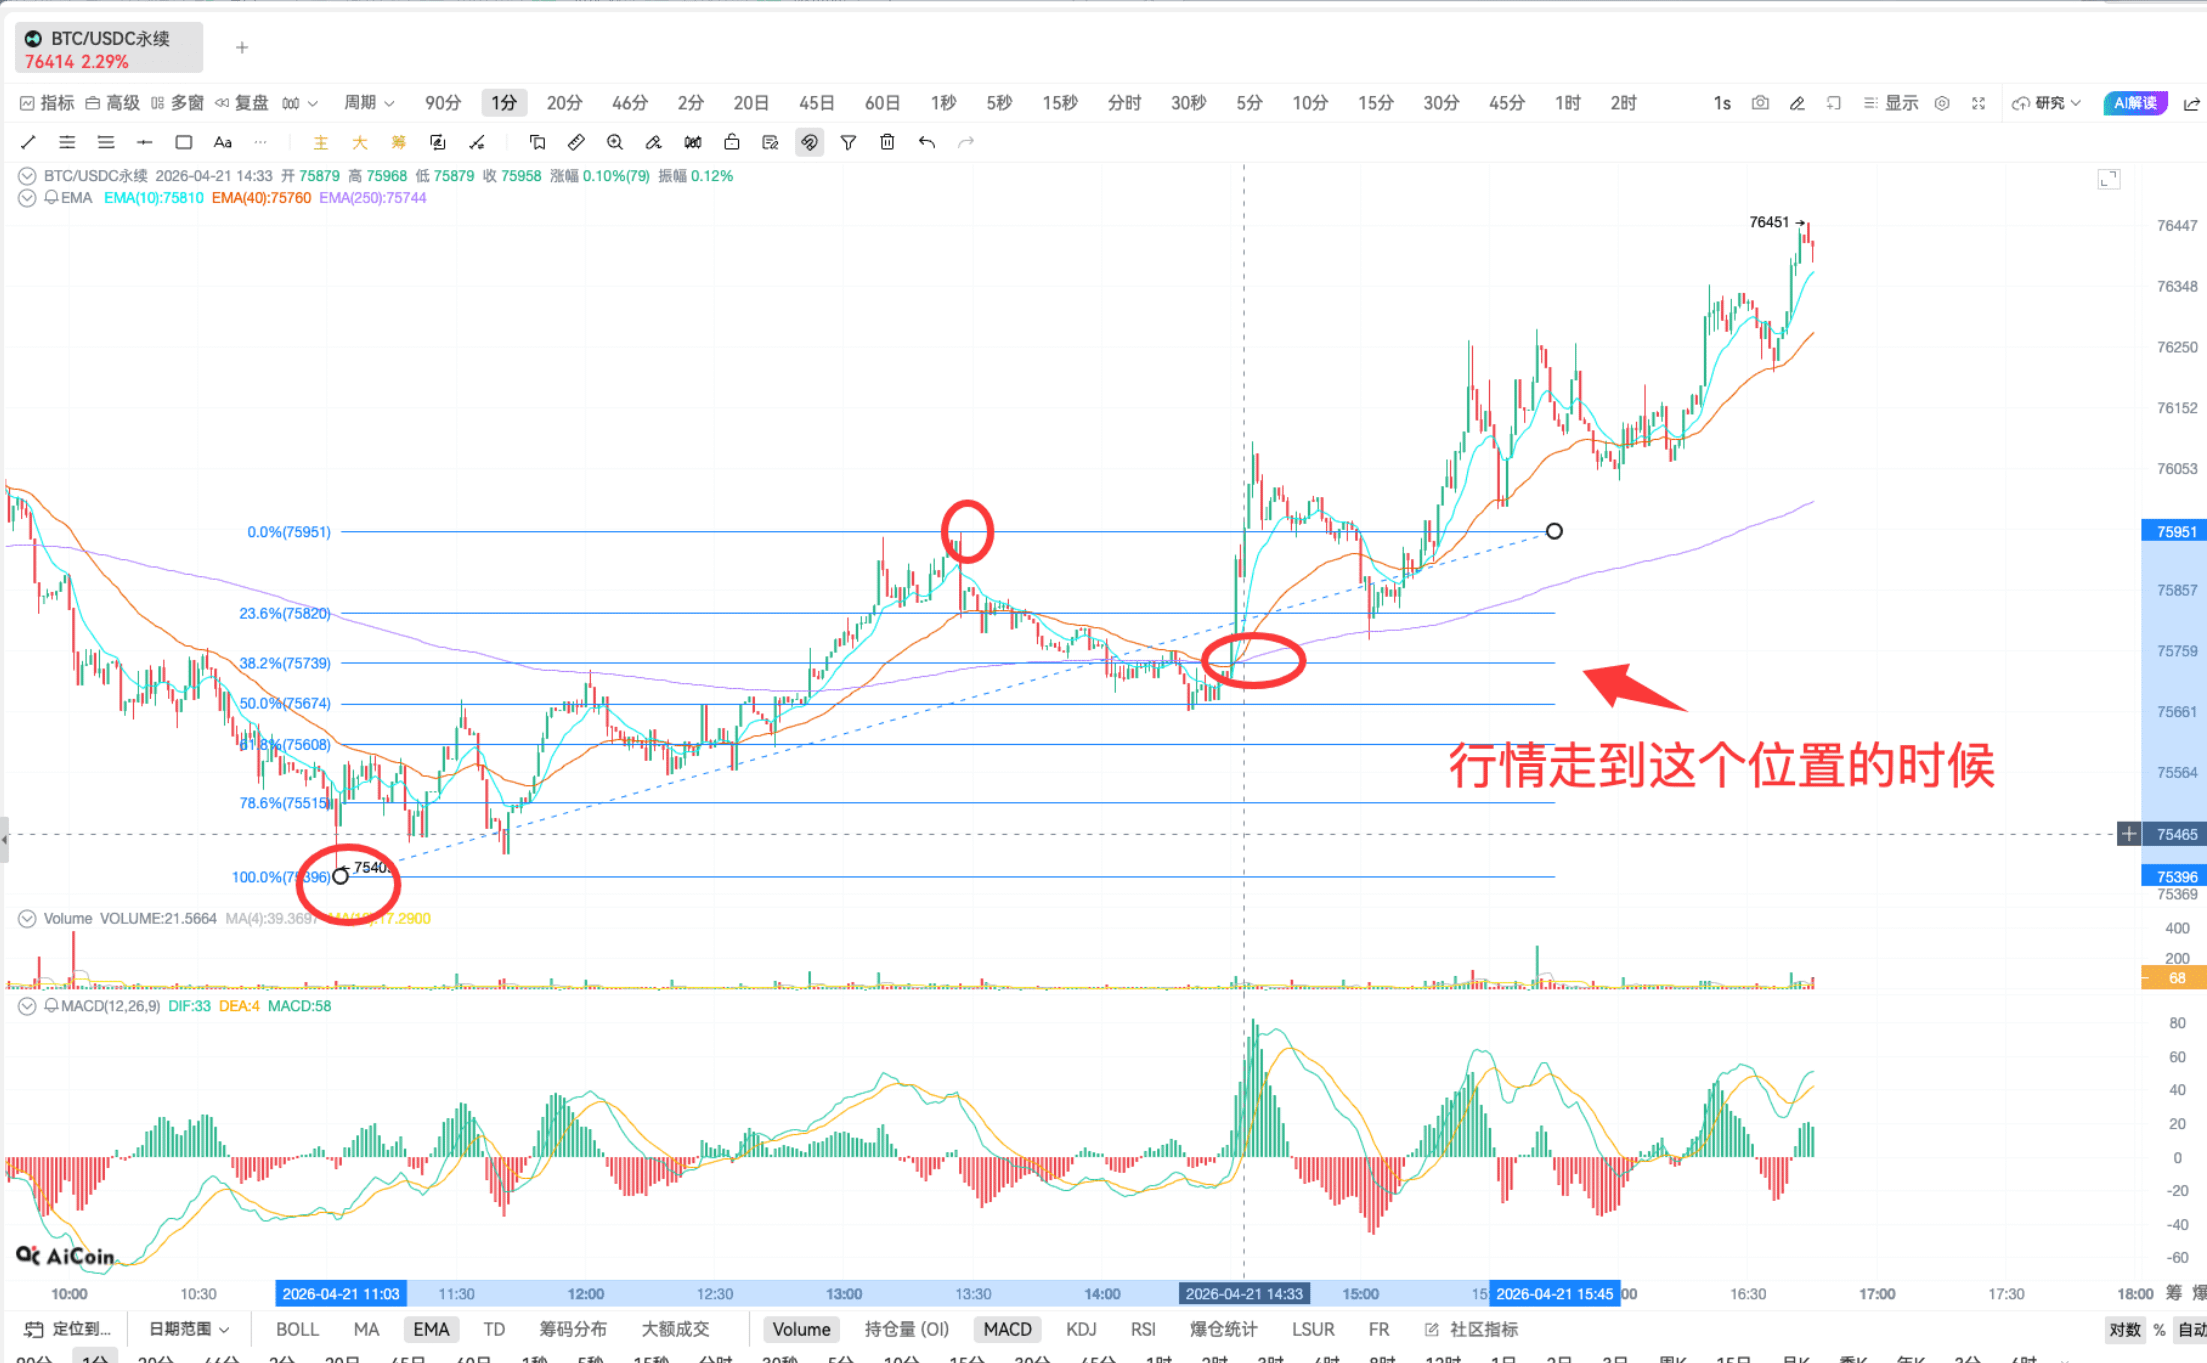
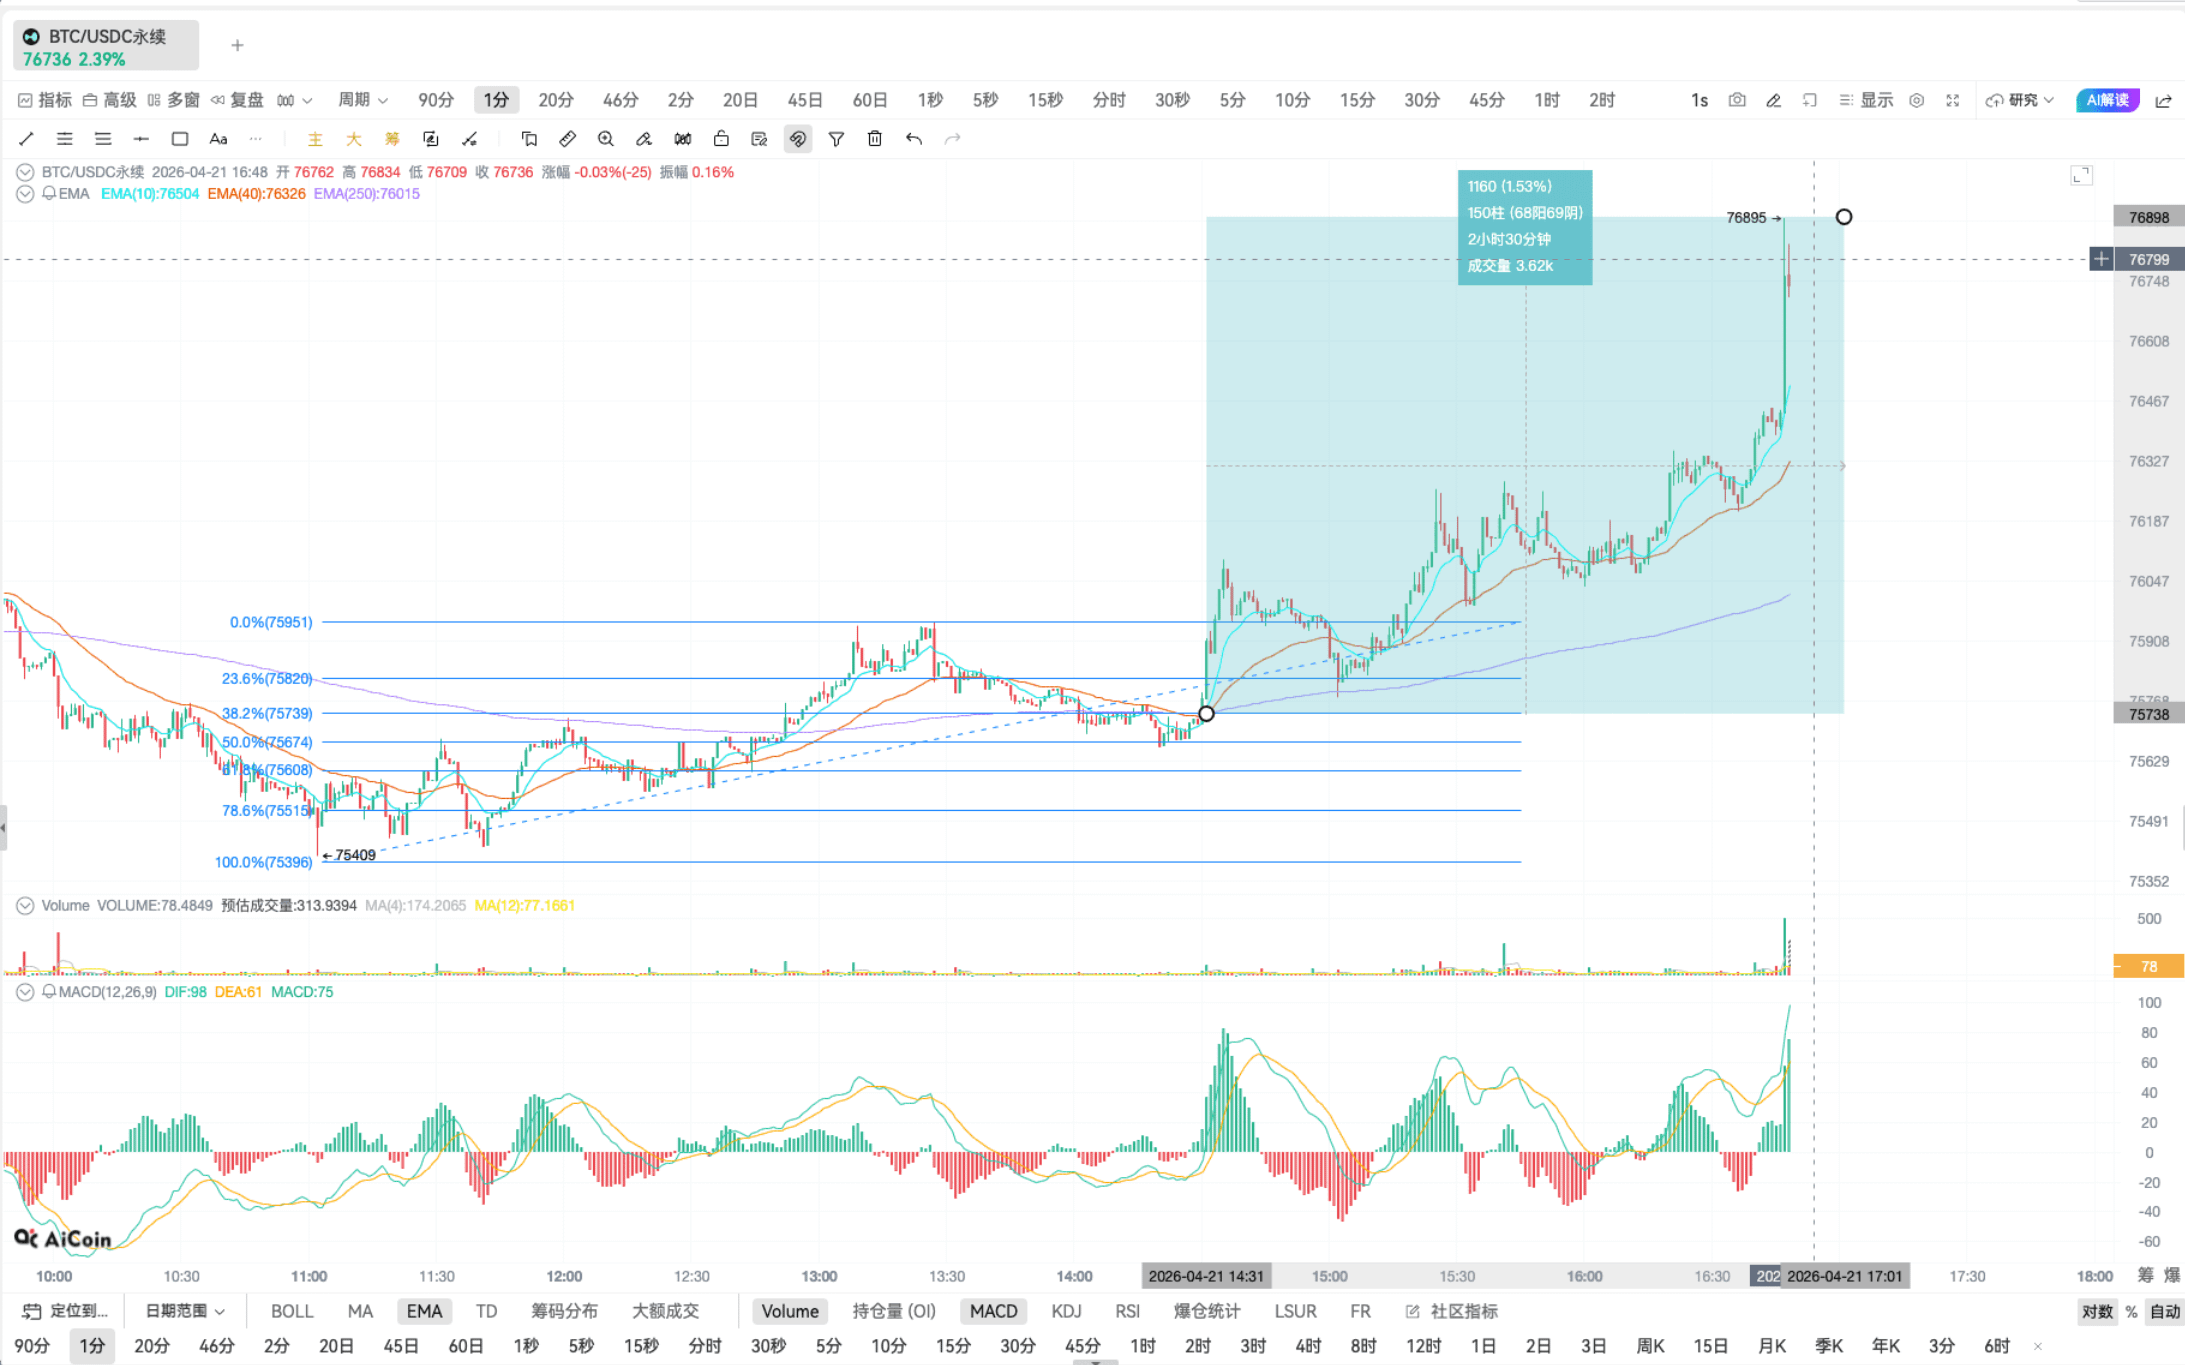
1-minute cycle practical market retracement to 0.382 strong support level, overlapping three signals:
Key Fibonacci support
EMA: Three moving averages resonance golden cross
MACD: Crosses above the zero axis directly triggering a wave of strong short-term rise, accurately capturing the explosive point.
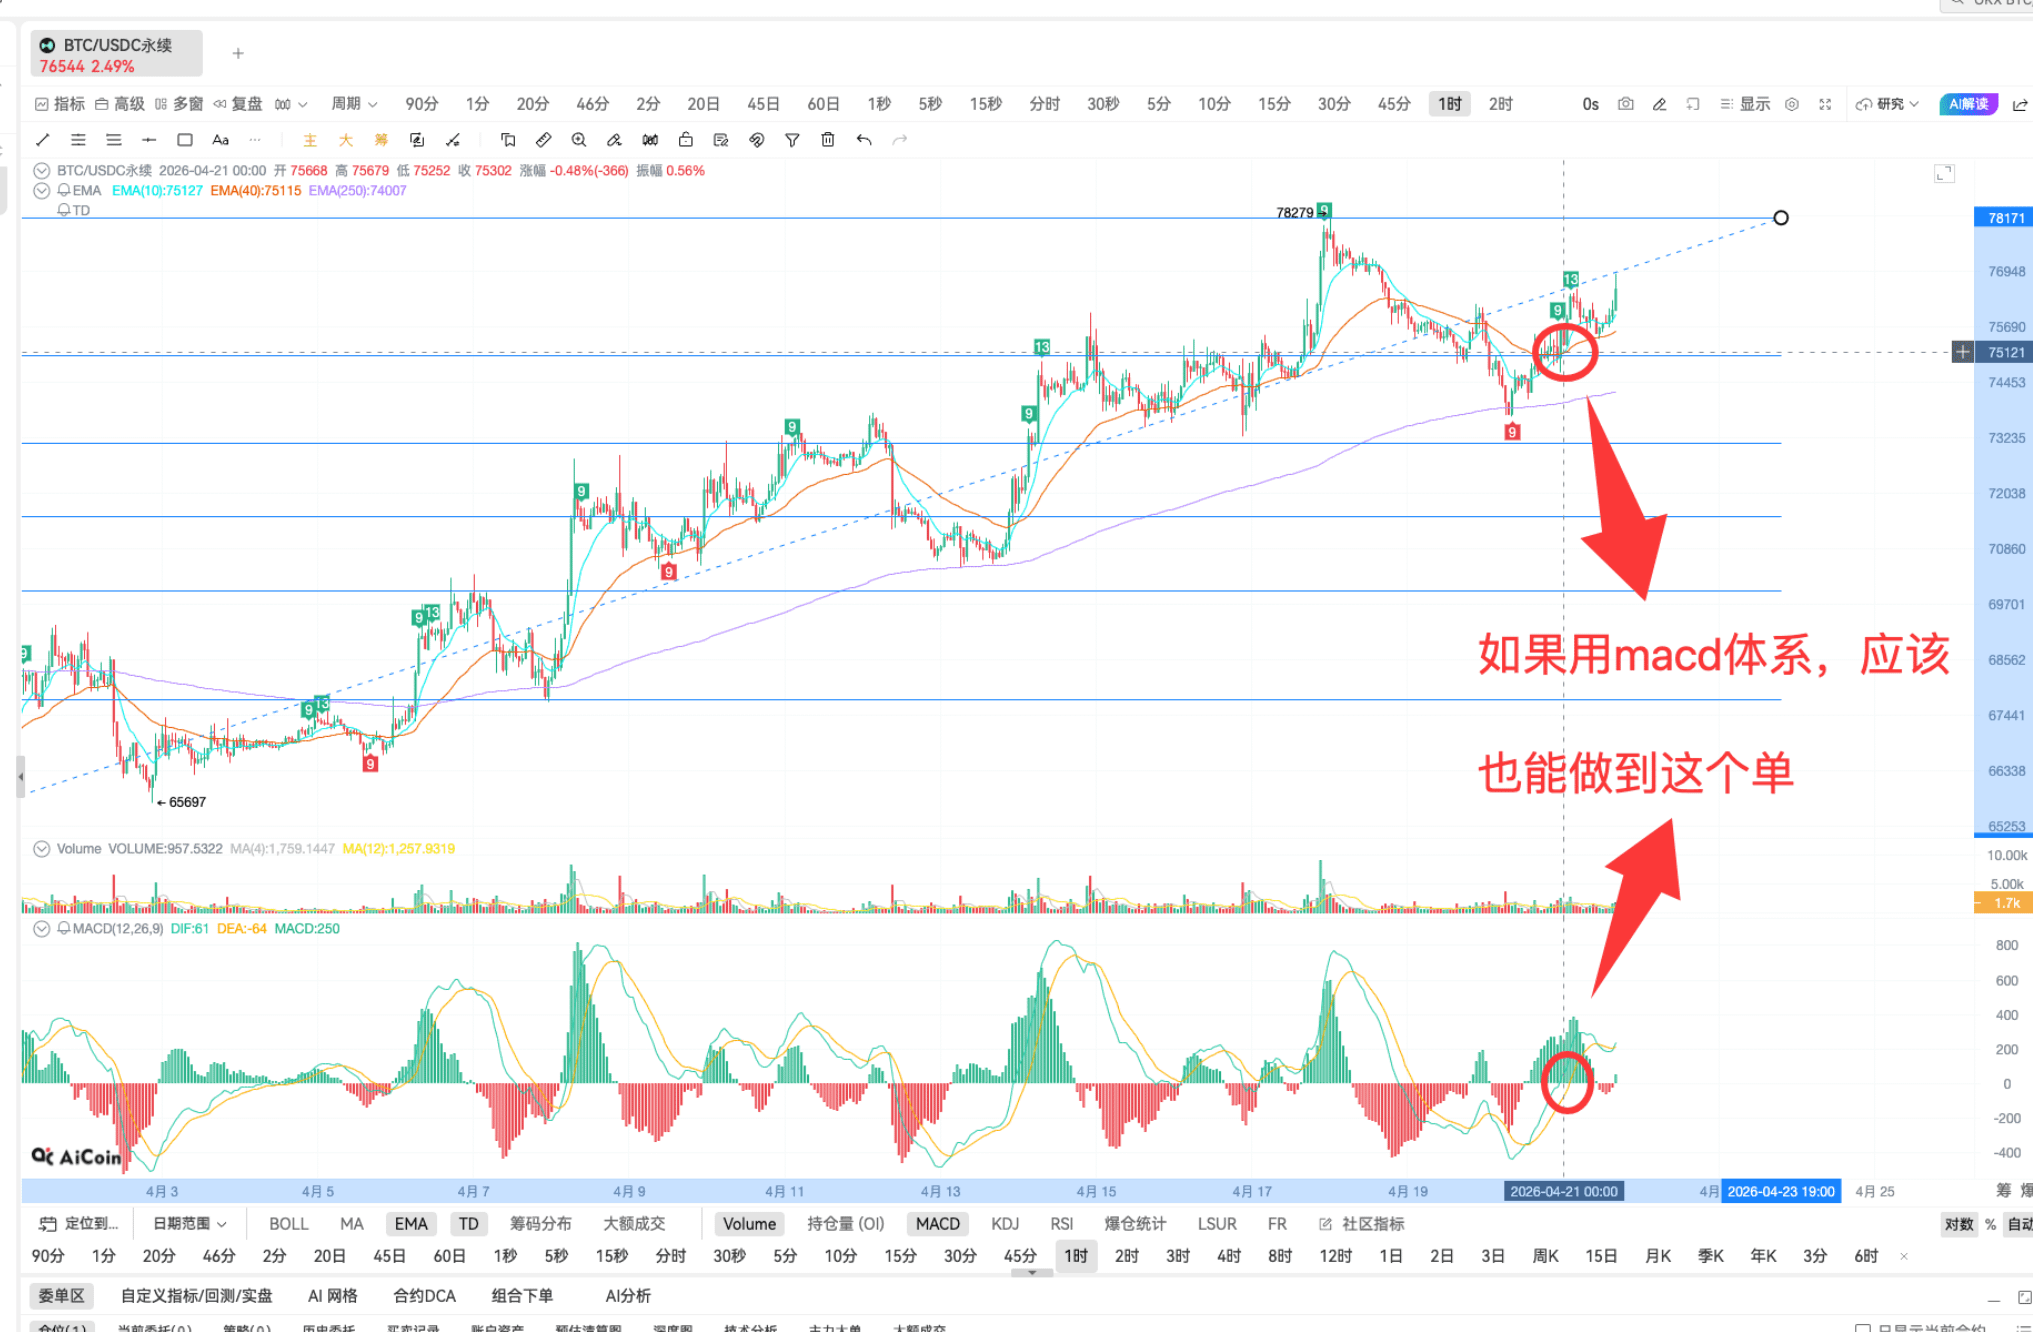
V. Scope of application and supplements
Fibonacci is universally applicable in the market, frequently used in gold, forex, and cryptocurrency markets. Our research institute will also use it frequently in on-chain K-line analysis. Using the TD indicator alone may miss out on BTC's current rise, but paired with Fibonacci, it can perfectly avoid signal deviation, and small-cost trial and error can master the strategy.
Newbie benefits
Hyperliquid zero-basic trading tutorial: https://www.aicoin.com/zh-Hans/article/510225
Hyperliquid binding link: https://app.hyperliquid.xyz/join/AICOIN88
As long as you bind the OKX wallet, you can easily navigate on-chain DEX trading, opening up global asset trading channels.