Hey, everyone! 🚀 Today I took some time to take a deep dive into the Bitcoin chart $BTC and want to share with you what I’m seeing. If you’re just starting out in this crypto universe, don’t be scared by all these lines, colors, and numbers on the chart above. I’ll break it down for you in a simple and straightforward way so you can understand what’s happening in the market today!
📊 What is the Chart Telling Me?
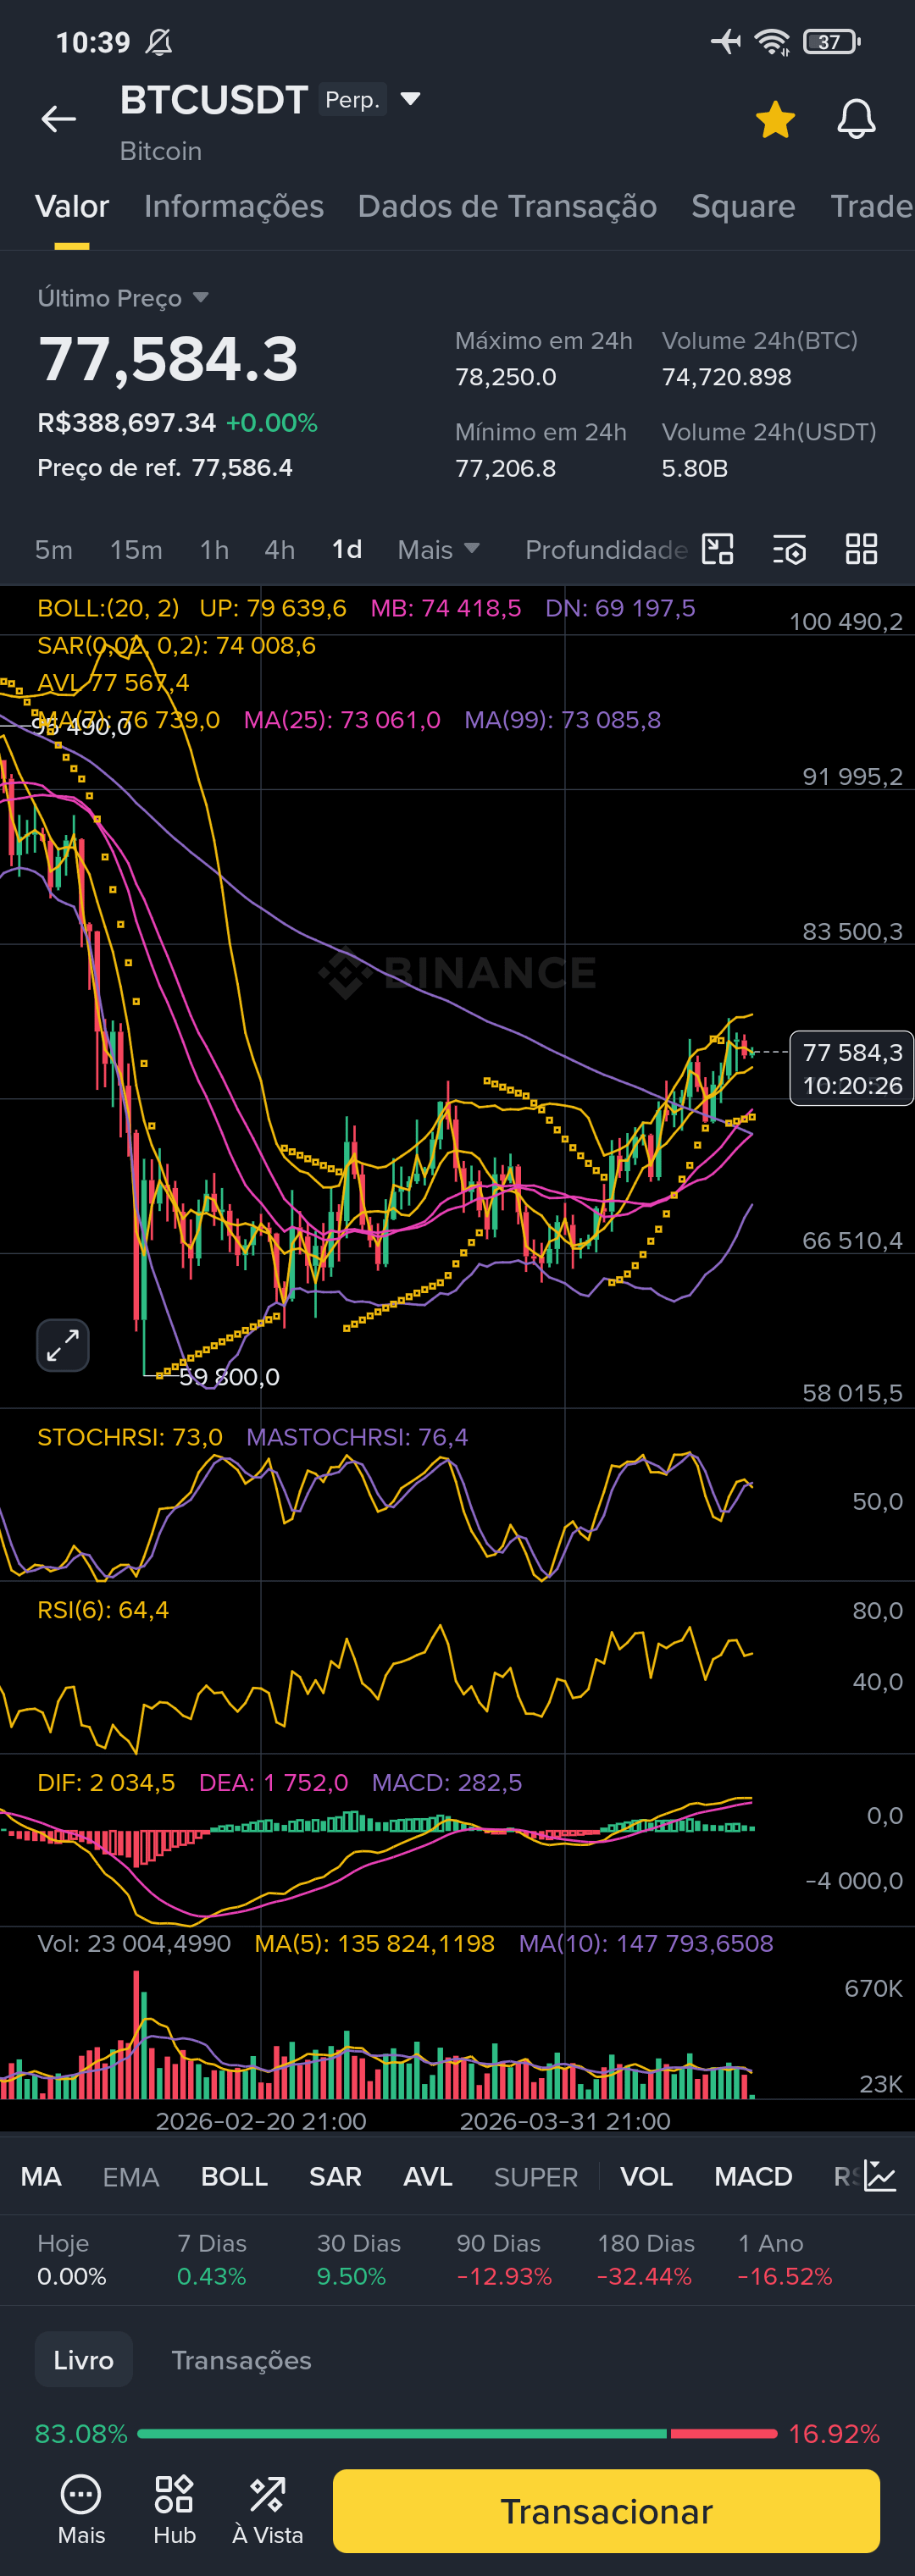
Looking at my screen, Bitcoin is trading around $77,584. What stands out to me is the beautiful recovery the asset has made. If you look at the bottom of the chart, the price touched near $59,800 a while back and has since been building a true "staircase" of upward movement.
The Trend: Those colored lines that follow the candlesticks (called moving averages) are crossing upwards. In plain English: the main trend in the short/medium term right now is bullish. The market is gaining confidence.
Market Strength: There’s an indicator down there called the RSI (Relative Strength Index), which is sitting at 64.4. Think of the RSI as a thermometer: below 30 the market is "frozen" (no one wants to buy), and above 70 it's "boiling" (everyone is buying like crazy). Being at 64 means buyers are dominating the game, the market is warm, but there's still room to grow before it gets overheated.
The MACD: That other chart with growing green bars shows that the momentum (the "swing" of the price) is favorable for those betting on the bullish trend.
🌍 Connecting the Dots with Global News
But why does the chart look so bullish? When I cross-reference this visual analysis with what's happening in the world, the pieces of the puzzle fit perfectly.
The global macroeconomic scenario remains challenging. With uncertainties about persistent inflation in various countries and central bank decisions regarding interest rates, the money from big investors is looking for a safe haven. This is where Bitcoin shines! Today, it’s not just seen as an "internet currency," but as a true digital store of value – a hedge against the loss of purchasing power of traditional money.
Moreover, the massive influx of institutional money (the big players and funds from Wall Street) through Bitcoin ETFs has changed the game. There's a lot of "big fish" buying and holding, which reduces the number of coins available for sale and, naturally, pushes the price up, just like the chart is showing us.
💡 My Conclusion for You
The chart shows me buying strength, and the global scenario provides the perfect fuel to sustain this. However, a friendly warning for those just arriving: the crypto market is volatile! Straight-line increases don't exist. Corrections and dips along the way are completely normal and healthy for the market to breathe.
The golden rule is: never invest money you’ll need to pay next month's bills. Study, understand the tech, and think of Bitcoin as an investment for your future.
And what about you? Have you made your first investment, or are you still just watching from the sidelines? Drop your questions in the comments below! 👇
#BTC #StrategicTrading #globaleconomy #strategy #bitcoin