
🐸 Memecoins do not move on fundamentals; they move on Attention and Momentum. And the PEPE chart is shouting "Momentum" at this moment.
1️⃣ Momentum and Euphoria (RSI and MACD)
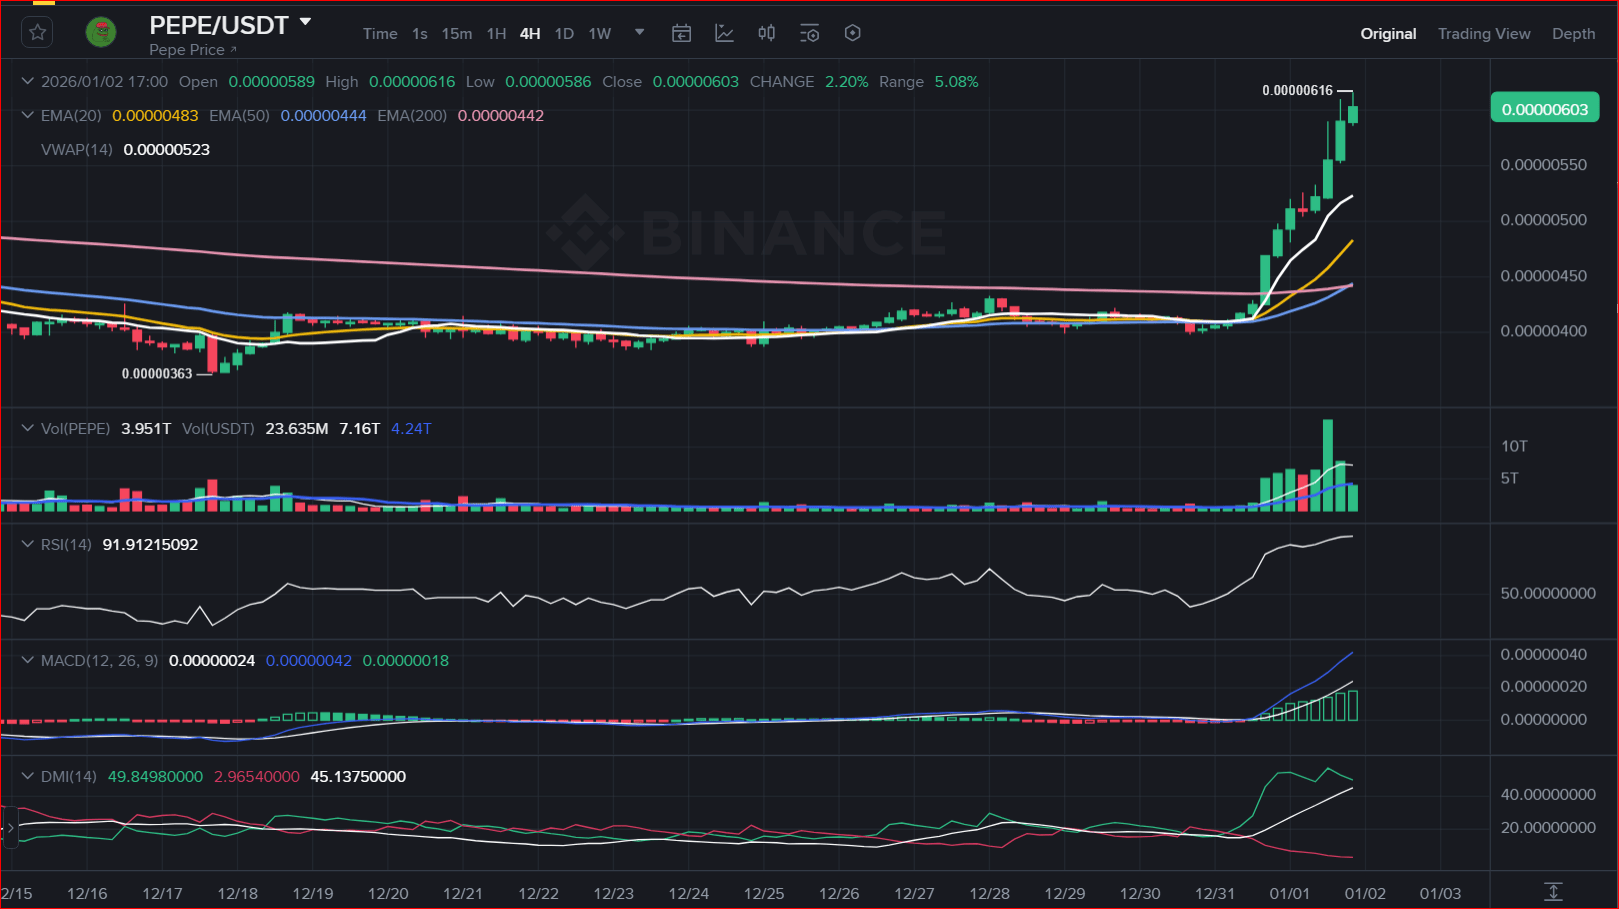
RSI (White Line): In memecoins, RSI is king. If it breaks the 50 barrier upwards with strength, the crowd is buying.
MACD: Look for the Blue line (DIF) to separate from the White line (DEA) upwards. The wider the "mouth" between the two lines, the stronger the euphoria.
2️⃣ Sustained Trend (EMAs)
In the 4H chart: The ideal support is the EMA 20 (Yellow Line). In parabolic rises, the price usually "surfs" on the yellow line. If it loses it and touches the Light Blue (EMA 50), it's a sign of weakness.
Structure: PEPE usually anticipates movements of $ETH . If ETH rises, $PEPE flies (High Beta).
3️⃣ Danger Signal (ADX)
Look at the ADX (White Line).
If it is rising vertically along with the price: Buy strongly.
If the price rises but the ADX flattens or drops: Divergence (Danger of a fall).
My vision:
PEPE is pure speculation. Technically, as long as the +DI (Green) dominates the -DI (Fuchsia), the trend is your friend. Don't seek logic; look for volume and follow the Yellow line.
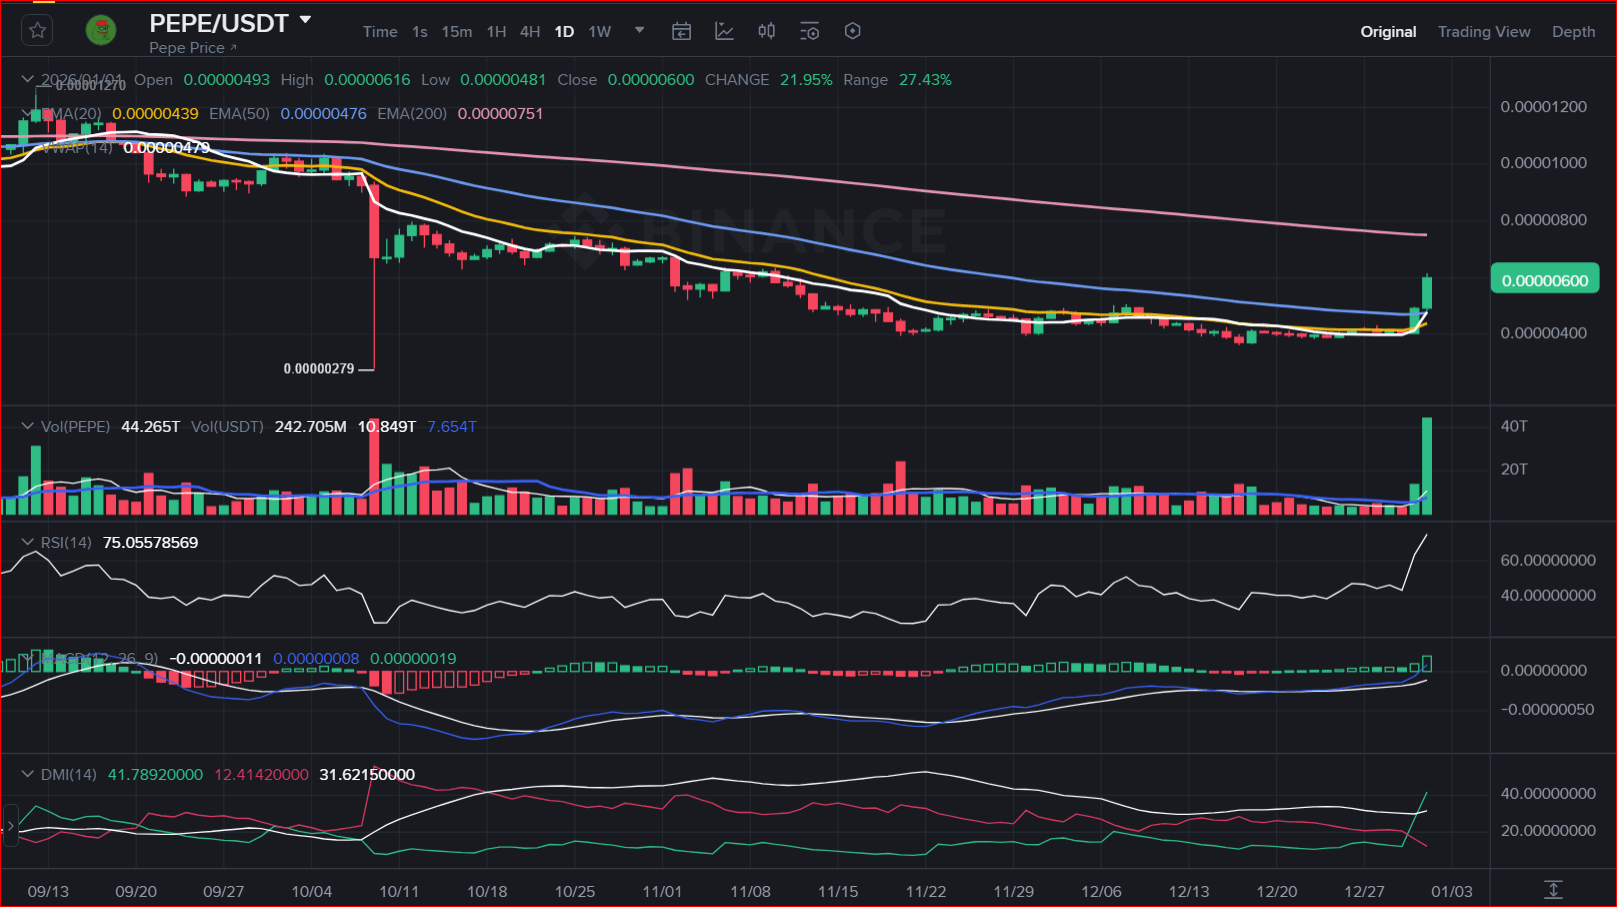
Look at what was discussed in both charts to draw your conclusions
👇 Is PEPE to the moon or is it time to take profits? I'm listening.
#memecoins #cryptotrading #MemeSeason #TechnicalAnalysis #BinanceSquare
🇬🇧 English Summary:
PEPE Momentum Check. Memecoins rely on hype and technicals. Currently, PEPE is "surfing" the 20 EMA (Yellow) support. MACD (Blue/White) expansion indicates strong buying pressure. Watch the ADX (White): rising ADX confirms the trend strength. If ADX drops while price rises, expect a correction.
⚠️ Disclaimer: This content is for educational and informational purposes only. It does not constitute financial advice. Do your own research (DYOR).

