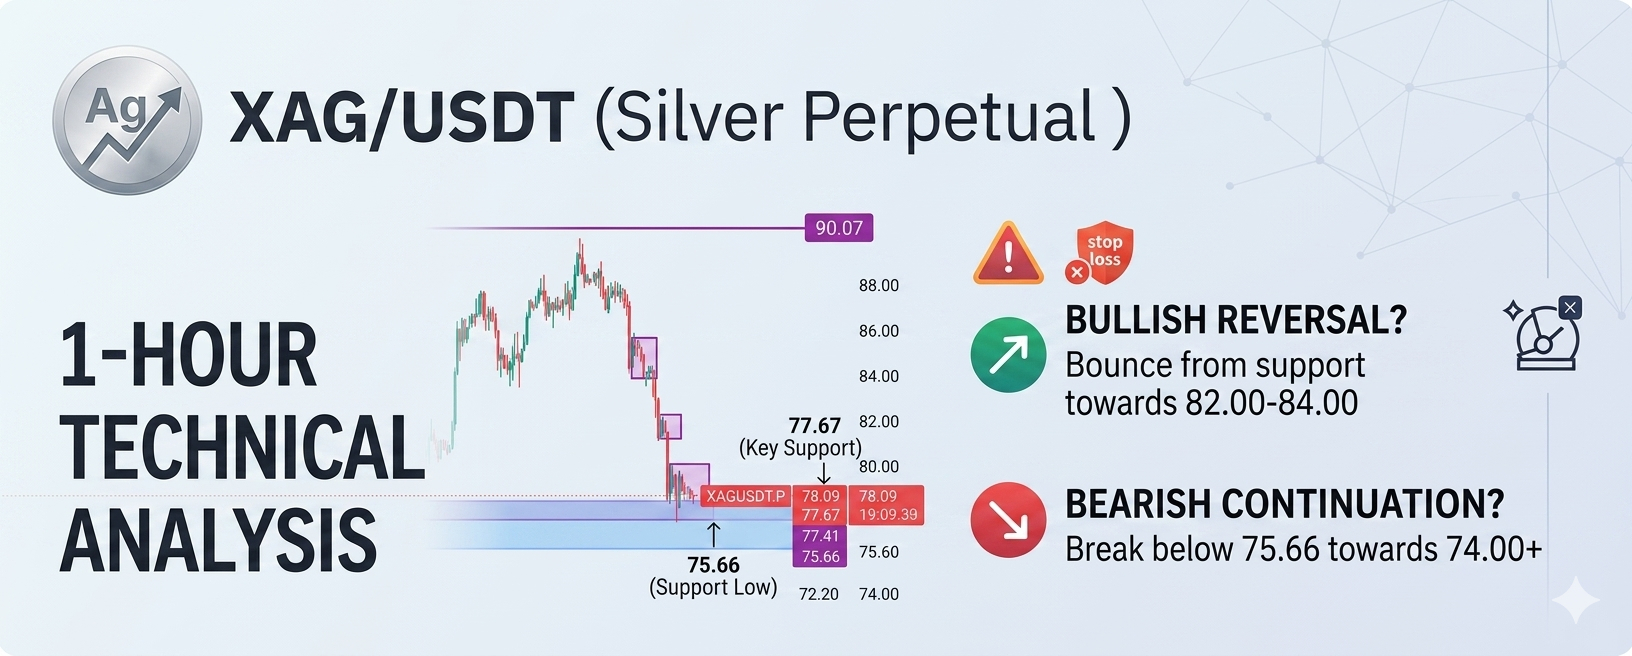
This chart is for XAG/USDT (Silver Perpetual) on the 1-hour (1H) timeframe. Here's a technical analysis based on the current price action:
### Current Market Situation:
1. Intense bearish momentum: The chart shows a significant drop from the 90.07 level. It is currently in a strong downtrend.
2. Support Zone: Price is currently very close to a support zone ranging from 77.67 to 75.66 (marked by the purple box). This level is crucial; if price doesn't bounce from here, we could see a bigger drop.
3. Bearish Consolidation: Price has been consolidating in small boxes (purple boxes) on the way down, and each time it breaks those boxes, it falls further. Currently, price is consolidating right at the bottom zone.
### Potential Movement:
*Bullish Scenario (Reversal):** If a reversal candlestick pattern (like a hammer or bullish engulfing) forms from this support zone, price could pull back to the 82.00 or 84.00 levels.
*Bearish Scenario (Continuation):** If price closes below the 75.66 level, the next target could be 74.00 or lower.
### Caution and Advice:
*RSI and Volume:** The chart isn’t showing any RSI or volume indicators, but after such a sharp drop, the market is typically in the 'oversold' zone. So taking a direct short entry now could be risky.
*Stop Loss:** If you want to take a trade, make sure to use proper stop loss as the market is volatile.
Remember: This is not financial advice, just an analysis based on chart patterns. What do you think, will it bounce back from this support zone?
#silver #BitcoinETFsSee$131MNetInflows #SouthKoreaNPSIncreasesStrategyStake