
 #Sui #SUIUSDT #TrumpTariffs #USJobsData
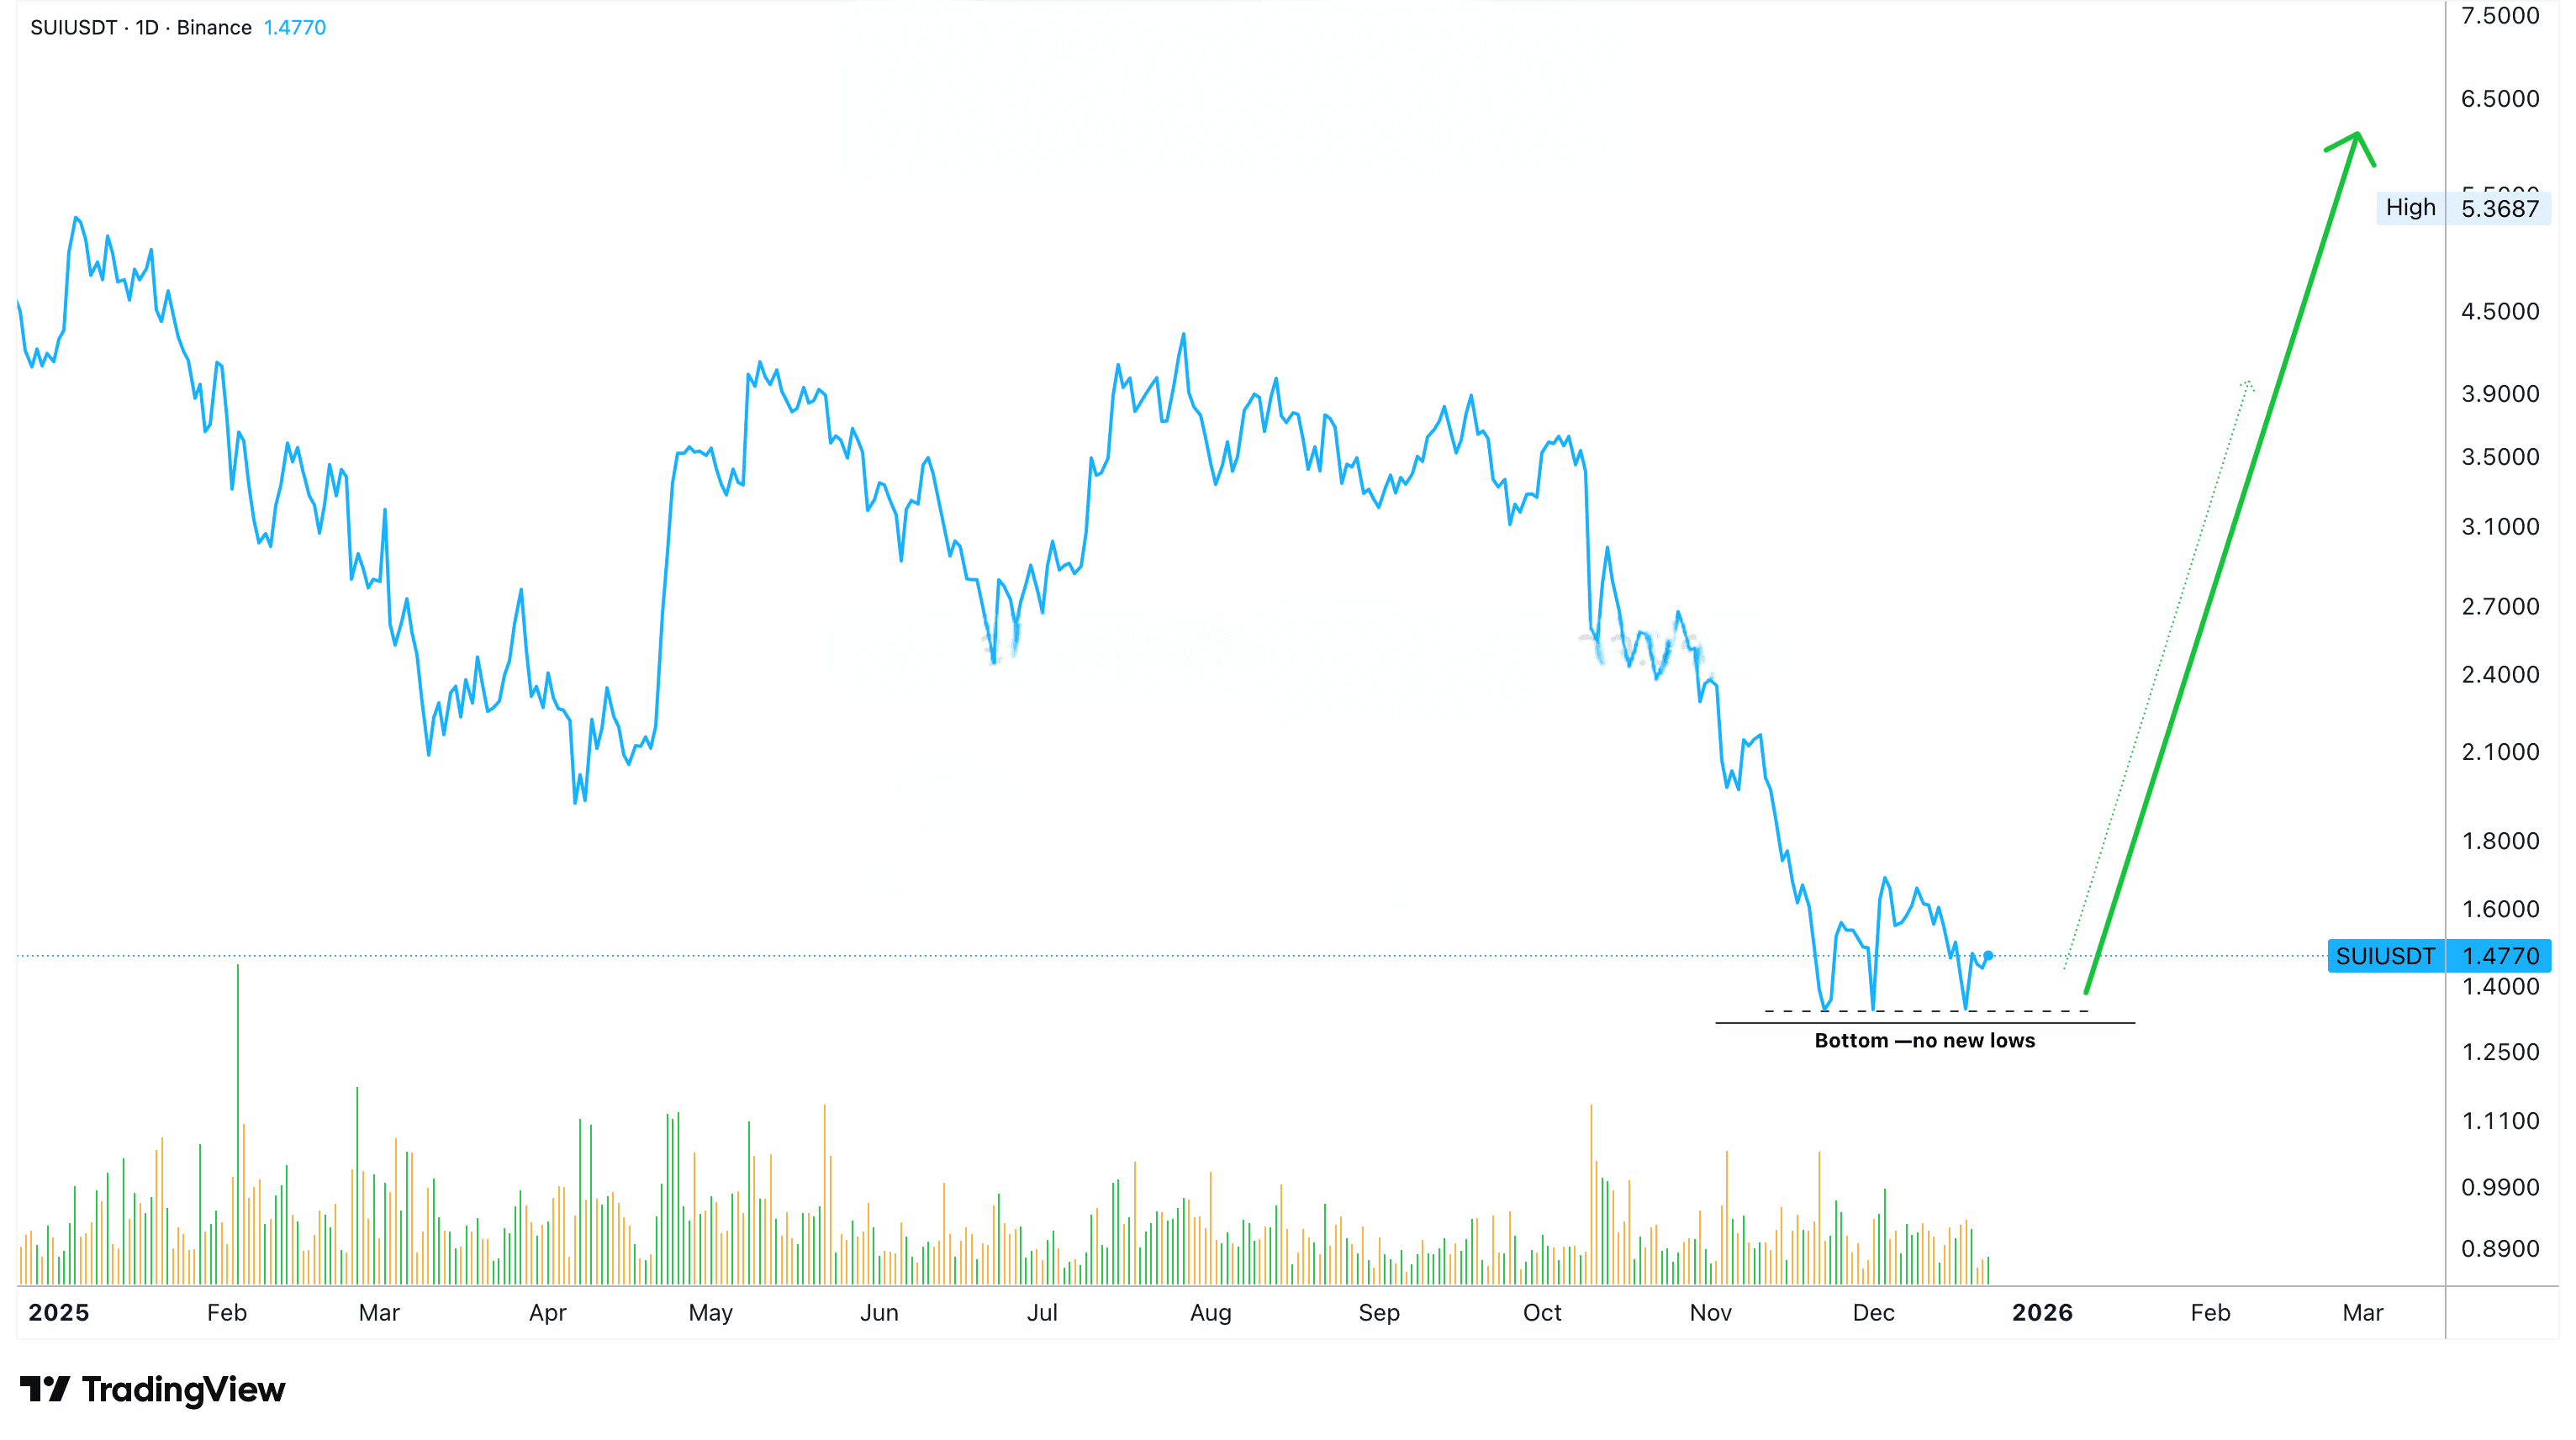
Stay simple with a linear chart —SUIUSDT. Note how after November there were no new lows. There was a significant crisis, and the crisis suddenly stopped. Not only did it stop, but there was no resumption of the downward process, that's it. This tells us that the downward wave has ended.
Again, the same volume signal is present. Sui started to decline around July, with a slight downward bend. It gained momentum in October, leading to the highest downward volume at that time. After that, the downward movement continued to dissolve, but the trading volume became less and less.
The bottom. Then comes the final bottom in November followed by no new bottoms. You can see the ideal straight line on the chart. This is the bottom pattern. The bottom leads to a reversal. The reversal means the beginning of a new upward wave.
SUIUSDT is rising. We are looking for the best possible entry prices and timing.
⚠️ Disclaimer:
This analysis is for educational purposes only and does not encourage trading in futures or any prohibited transactions. The goal is to clarify potential market movements, not a direct recommendation to buy or sell.
💡 Important notes:
- This analysis is for educational purposes only.
- Please study the market and make decisions based on your ability and risk tolerance.
- The author is not responsible for others' trading or their profit results.
Thank you for reading.
Namaste.
✅ Trade here on $SUI