The crypto market operates in cycles, and few phases capture the imagination of investors like Altseason—the period when altcoins surge, often outpacing Bitcoin's (BTC) gains.1 But how do you know when it's truly time to shift gears from your Bitcoin-heavy portfolio?
The answer, many veteran traders agree, often lies in a single, powerful metric: the ETH/BTC Ratio.2
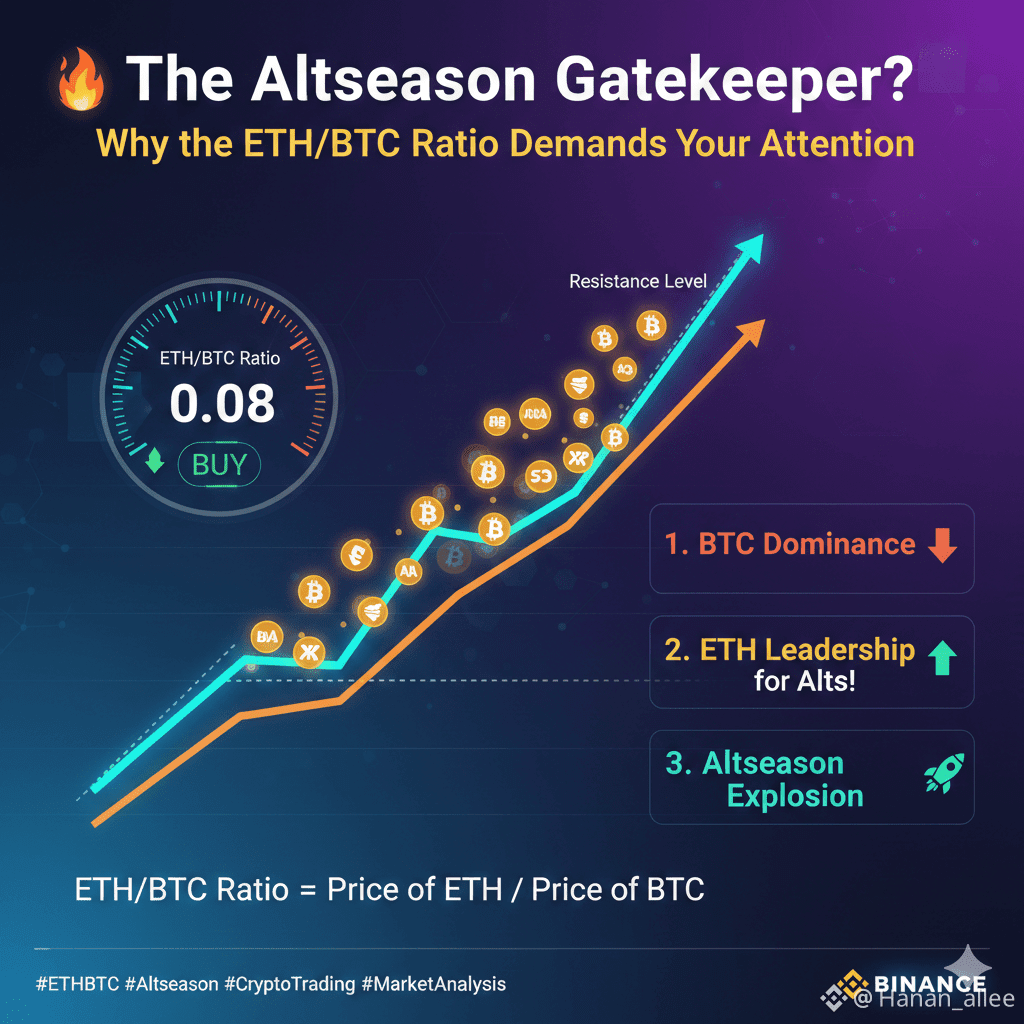
📈 What is the ETH/BTC Ratio?
Simply put, the ETH/BTC ratio represents the price of one Ether (ETH) denominated in Bitcoin.3
If the ratio is $0.07$, it means $1$ ETH is worth $0.07$ BTC. The ratio serves as a direct, real-time indicator of Ethereum's relative strength against Bitcoin, the market's benchmark asset.4
🔑 The Gatekeeper: Why it Signals Altseason
Historically, the market moves through distinct phases, and the ETH/BTC ratio acts as a crucial Phase Transition Indicator:5
1. The Bitcoin Dominance Phase (BTC Leads)
Ratio Movement: Flat or Declining.
Market Action: Funds are primarily flowing into or concentrated in Bitcoin. BTC's dominance rises.6 Investors view BTC as the safest or primary play. Altcoins struggle to maintain momentum against BTC.
2. The Ethereum Leadership Phase (ETH Takes Over)
Ratio Movement: Rising significantly.
Market Action: The ratio breaks key resistance levels and starts an uptrend.7 This signals that Ether is appreciating faster than Bitcoin, demonstrating its own market strength.
The Signal: This is the critical moment. When ETH, the largest and most established altcoin, begins to strongly outperform BTC, it suggests that risk appetite is returning to the market.8
3. The Altseason Explosion (Alts Follow ETH)9
Ratio Movement: Continues to rise or consolidate at a high level.
Market Action: Following ETH's lead, capital cascades down the risk curve.10 Investors who profited from BTC and then ETH start pouring funds into smaller-cap altcoins, leading to the massive, rapid gains characteristic of a full Altseason.
💡 Trader's Insight: A rising ETH/BTC ratio is often interpreted as the "Green Light" for altcoins.11 If ETH—the Gatekeeper—cannot outperform BTC, it's highly unlikely that smaller, riskier altcoins will sustain a rally.
📊 Key Levels to Watch
While no indicator is a crystal ball, historical patterns offer valuable context. Key psychological and technical levels on the ETH/BTC chart have often marked major turning points:
Ratio LevelHistorical Significance$0.1$A major long-term resistance and psychological milestone. Breaking and holding this level has historically fueled significant altcoin rallies.$0.07 - 0.08$A strong mid-range zone. A move above this region often confirms the start of the "Ethereum Leadership Phase" and increases confidence in a coming Altseason.Below $0.05$A potential danger zone. This suggests strong Bitcoin dominance and a market sentiment where most altcoins are likely struggling against BTC.
✅ Summary for Your Trading Strategy
The ETH/BTC ratio is not just a price chart; it's a flow of funds indicator.12 It tells you where the market's institutional and sophisticated capital is moving.13
Monitor Closely: Track the ratio daily for trends and breakouts.
Look for Confirmation: Wait for the ratio to break and hold above significant resistance levels (like the 14$0.07$ or 15$0.08$ mark) before making major portfolio adjustments.16
Risk Management: Even in an Altseason, volatility is extreme.17 Never invest more than you are willing to lose, and always maintain a strong risk management strategy.
The ETH/BTC ratio provides the clearest lens through which to gauge the market's risk appetite. By understanding its movements, you can better position yourself to navigate the cycles and unlock the opportunities that a true Altseason offers.
Disclaimer: This article is for informational purposes only and should not be considered financial advice. Cryptocurrency investments are subject to high market risk.18 Please do your own research and consult with a financial advisor before making any investment decisions.
#ETHBTC #Altseason #CryptoTrading #Binance #MarketAnalysis


