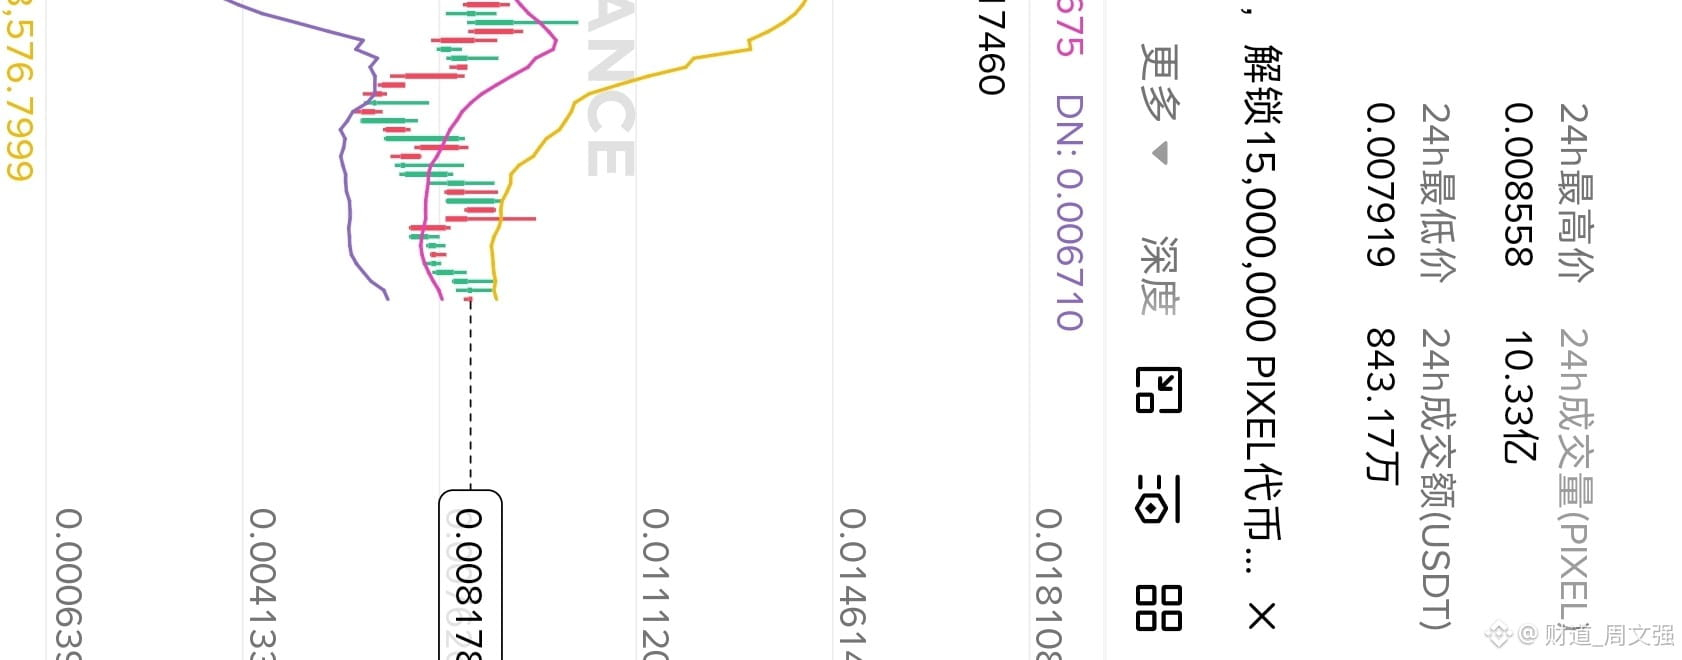
Currently, PIXEL is priced at 0.008178, with a slight increase of 2.51% over the last 24 hours. It might not look like much, but overall, it's slowly lifting from the previous low consolidation zone. The Bollinger Bands are all trending upwards, with the middle band at 0.007675, the upper band at 0.008640, and the lower band at 0.006710. The price is now hovering near the upper half, indicating that the bulls are still in control in the short term, but the momentum isn't strong enough to break through the upper band in one go. As long as the price doesn't drop back below the middle band, this small bounce structure can be maintained.
Volume is an issue. Right now, the volume is only 86.63 million, but the 5-day average is 1.11 billion and the 10-day average is 1.25 billion, showing a significant decrease. A volume drop followed by a bounce usually indicates weak buying pressure, making it tough to just blast through and start a main uptrend from this position. It's more likely we’ll be grinding between 0.0076 and 0.0086, using time to gain space, waiting for the moving averages to converge further.
In terms of trend, the short-term looks decent, but the long-term paints a different picture. It's down 51% over the past 180 days and a whopping 80% over the year, making it a classic deep bear asset. This current uptick should only be seen as a low-level bounce; don't read too much into it—it's not a reversal.
The upper resistance is first at the previous minor high around 0.00845, and above that is the Bollinger upper band at 0.00864. If we see increased volume breaking through that level, we can look for higher targets, but short-term, I doubt the probability is high. For support below, first watch the 24-hour low at 0.0079, then the Bollinger mid-band at 0.0076. This level is the dividing line for bulls and bears; if it can't hold during a bounce, it’s game over.
What's the next move? If you're going long, don't chase it; entering at the current price doesn't offer much value. It's better to wait for a pullback to the 0.0077 to 0.0078 zone, stabilize there, and then test the waters with a small position. Set a wider stop-loss below 0.0074. For shorts, keep an eye on the area above 0.0085. If the price hits that level and shows a clear rejection candlestick pattern, like a long upper wick, you can take a small short position. Place your stop-loss above 0.0087, targeting a return to the mid-band. However, the overall range isn't that large; in this low-volume choppy market, the profit potential is generally limited, so don't go too heavy on your position. Managing risk is more crucial.