Brothers, I am Mig.
XRP has dropped again, many people ask me: 'Mig, isn't there an ETF inflow? Why is it still dropping? Is there no hope?' Don't worry, today I will explain the news, technical aspects, and your doubts all at once.
News: The 'good news' you see may just be a play acted by others.
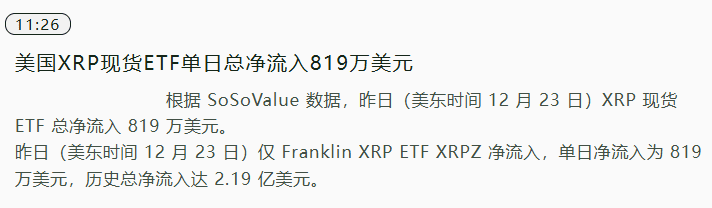
Yesterday, the net inflow of XRP spot ETF in the US was $8.19 million, which seems like good news on its own.
But if you think carefully: why is the capital flowing in, but the price is plummeting? There is only one explanation - institutions are taking advantage of market panic to suppress prices and quietly accumulate.
Retail investors see panic selling, while big players see cheap chips. This 'divergence' is the key signal; it often appears in the phase bottom area, not on the eve of an immediate surge.
Mig's opinion: What you see is only what the operators want you to see; the positive news can no longer support XRP's rise. In the case of divergence, we need to grasp the indicators given by the technical aspect. If you are unclear about the specific timing, you can follow the lord, who provides real-time village reminders for friends who have followed me for 24 hours. Chat Room
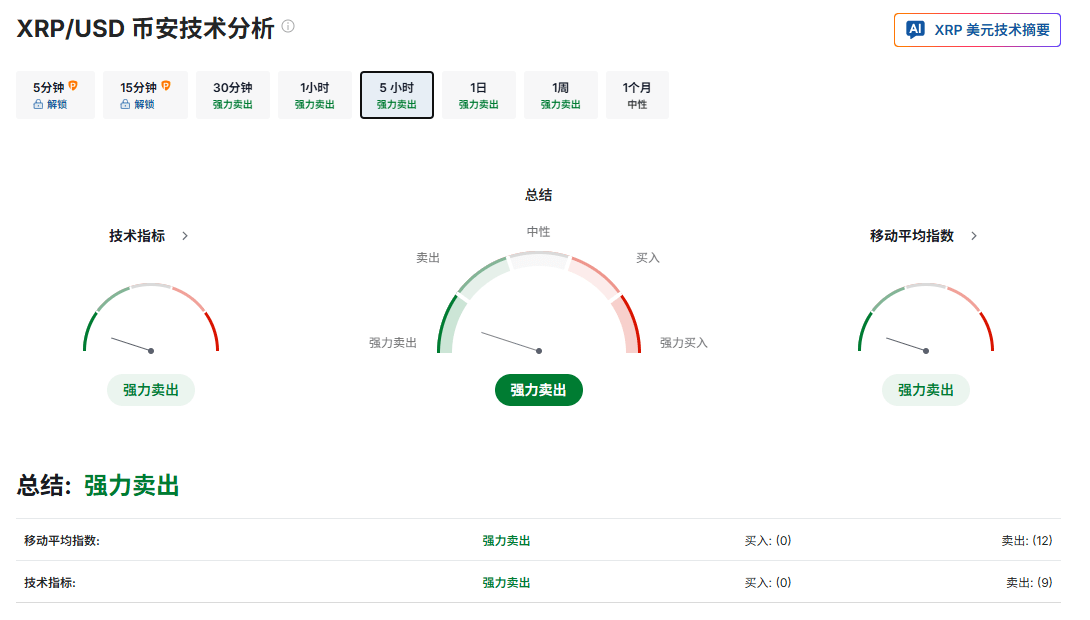
Technical aspect: All indicators are 'screaming sell', but there are hidden secrets.
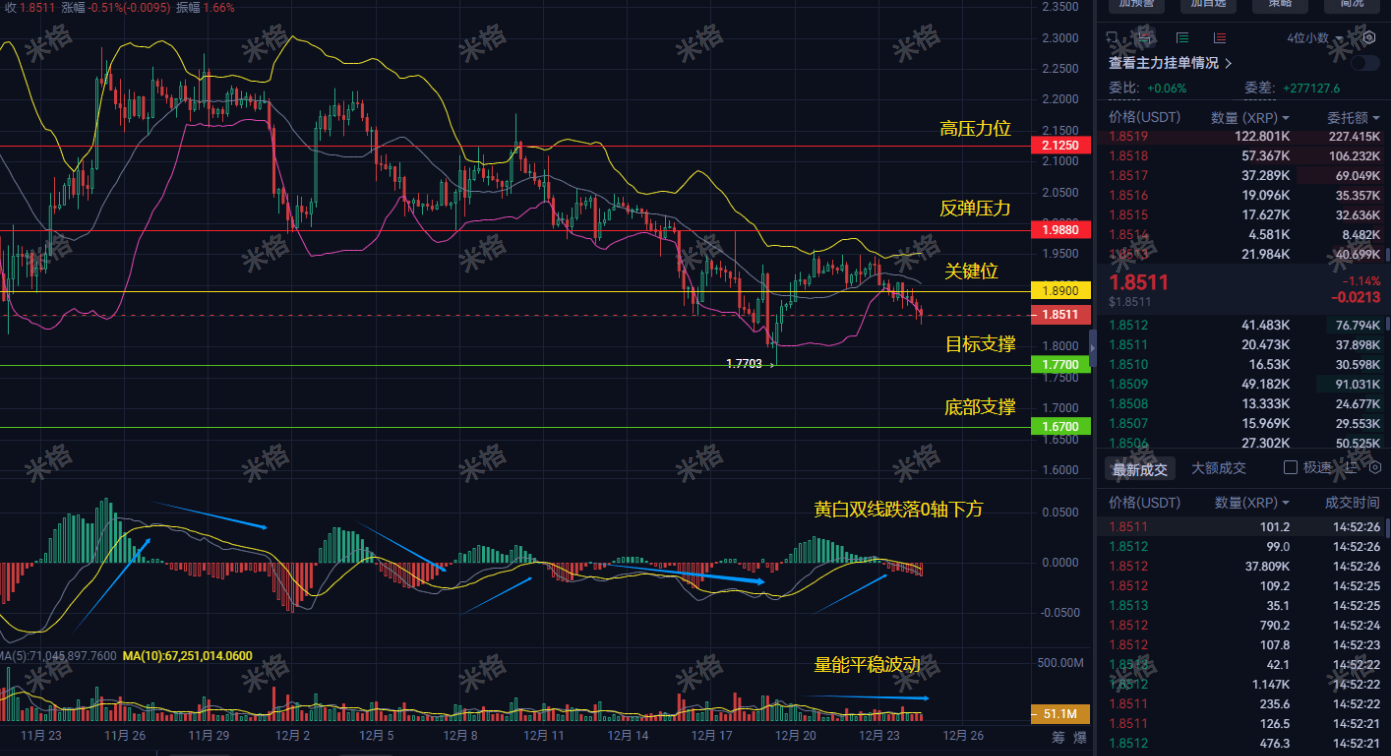
The MACD dual lines have long been lying underwater, with RSI and Williams indicators all in the oversold zone. Nine oscillation indicators are all shouting 'sell', and all moving averages from MA5 to MA200 are pressed above, forming a 'death arrangement'.
This clearly tells you: short-term bears absolutely dominate, don’t go against the trend. The upper levels of 1.988 and 2.125 are like two mountains that cannot be crossed without huge volume.
Mig thinks: When all indicators are extreme, it often means that rebound momentum is secretly accumulating. How to combine technical indicators to truly catch the bottom? At which specific point to enter, and where to set the stop-loss most safely? Mig Village has already given reminders; those who want to keep up, become villagers of Mig! Chat Room
Retail operation suggestion: Three steps to respond, refuse to be a 'leek'.
Empty/Light position investors: Look for a shrinking stop-loss candlestick near 1.77 or a stable volume on the 4-hour chart above 1.89.
Heavily trapped investors: When the rebound reaches the 1.89-1.95 range, reduce some positions to lower risk.
Medium to long-term layout investors: Place orders in batches near 1.70, with each not exceeding 5% of the position.
Mig's personal opinion:
In the next 1-2 days, it is highly likely to test the support strength at 1.77 again, and it may even quickly spike near 1.70. Want to directly reverse and rush to 1.988? The possibility is very small.
The more likely scenario is: panic selling, building a consolidation platform in the 1.70-1.77 area, and then accumulating strength for a rebound.
Don't forget, the over 8 million USD from institutions is not for charity.
The market always has opportunities, the key is to operate calmly. Mig will continue to help everyone keep an eye on the on-chain dynamics, moving steadily forward together! Follow Mig, participate in every attack of Mig villagers! Mig will announce the specific entry times and real-time news daily in the village!
