
Summary
The tokenized asset growth curve is steepening. Distributed real-world asset (RWA) value has reached US$31.4B, up from around US$21.5B at the start of 2026 and roughly five times higher than at the start of 2025. The market is also becoming more institutional, led by tokenized U.S. Treasury products, gold-backed commodities, and tokenized public equities, which have risen from a small base to around US$1.4B.
The broader tokenized footprint is materially larger than distributed asset value alone. Represented tokenized assets add a much larger institutional layer, stablecoin reserves embed more than US$200B of Treasury-linked exposure inside on-chain dollar instruments, and RWA perpetuals show growing demand for traditional asset exposure through crypto-native market structure.
The long-term opportunity is large because current penetration remains extremely low. Across the five core asset classes modeled in this report, tokenized penetration of the total addressable market is around 0.01%. Even sub-1% aggregate penetration by 2030 would represent a potentially trillion-dollar market, with our base case suggesting around US$1.6T.
The adoption path will depend less on aggregate demand alone and more on the convergence of regulation, custody, settlement infrastructure, liquidity, and institutional distribution. If these reinforce one another, tokenization could become a broader financial-market rail.
The Visible RWA Market
The tokenized RWA market is most commonly measured through distributed asset value, which captures tokenized assets that can be transferred across wallets and integrated with broader crypto markets. This figure has reached US$31.4B, up from around US$21.5B at the start of 2026. U.S. Treasury-linked tokens represent roughly half of the total, tokenized commodities are predominantly gold-backed at around US$5.1B, and tokenized equities have reached approximately US$1.5B after growing from below US$300M at the start of 2025.
Figure 1: Distributed tokenized RWA value nears US$31.4B in May 2026, around five times higher than at the start of 2025
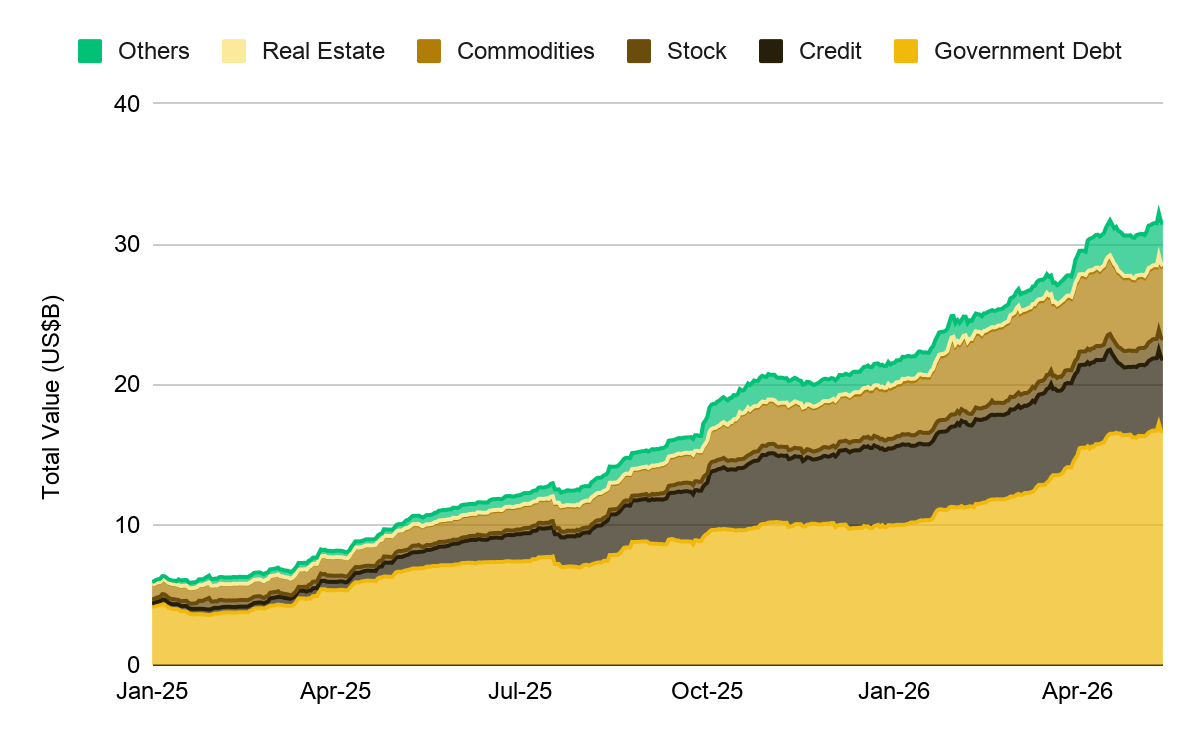
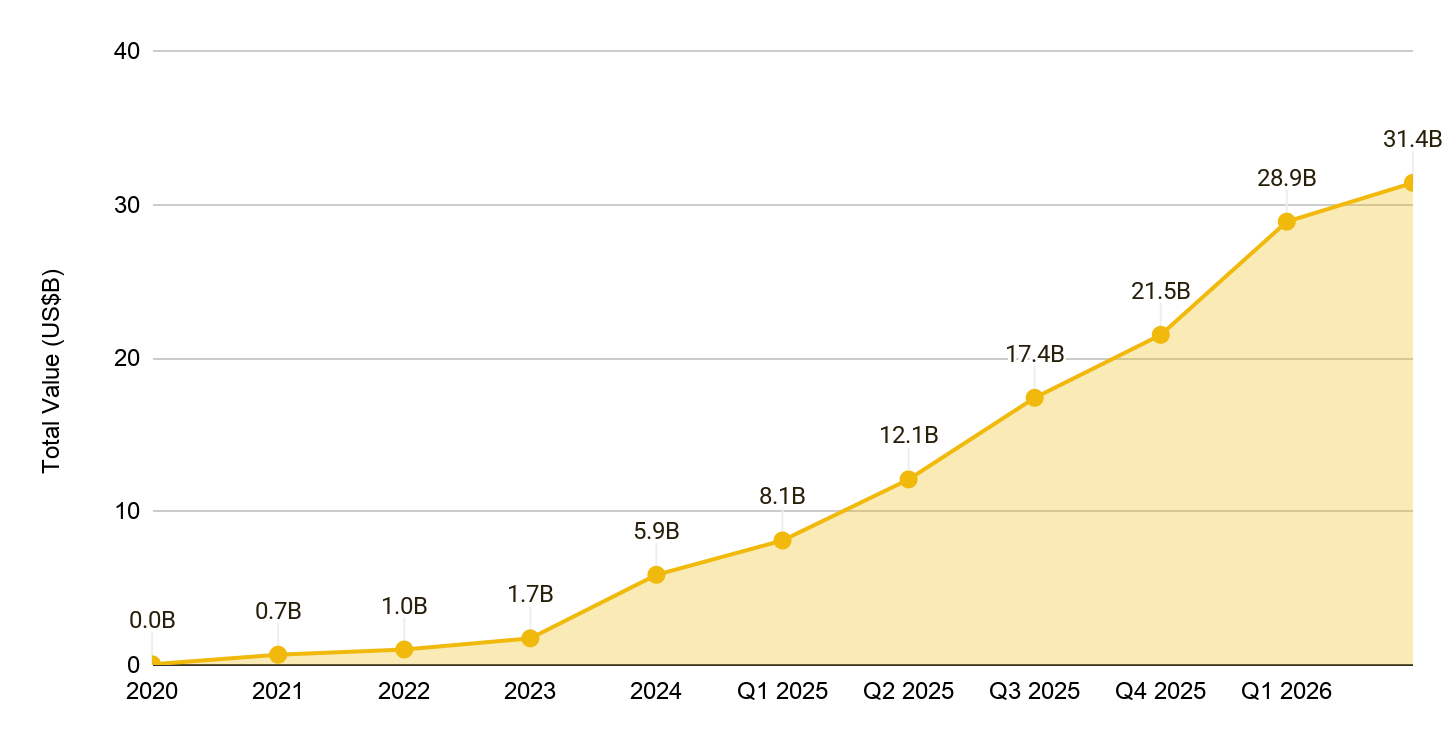
The pace of expansion has materially accelerated. Distributed value rose from around US$6B at the start of 2025 to more than US$30B today. The first US$10B took several years to reach, while the most recent US$20B was added over the past year. This reflects a shift from primarily crypto-native protocols toward institutional issuers, alongside broader distribution through exchanges, custodians, tokenization platforms, and asset managers.
Figure 2: Tokenized asset market growth has accelerated sharply, with most gains concentrated over the past year
The Footprint Is Larger Than Headline AUM
The distributed value figure does not capture all traditional-asset exposure already moving onto blockchain rails. Several other market layers show that the broader on-chain tokenized footprint is expanding.
First, there is a further institutional layer with US$370B in represented tokenized assets. These are assets recorded on-chain but not freely transferable outside the issuing platform because of permissioning, product design, or regulatory constraints. This typically includes tokenized private credit through regulated transfer agents, institutional repo arrangements, and tokenized bond issuances on bank-operated platforms. Institutions are already using blockchain-based records for traditional assets at a much larger scale than distributed RWA value alone suggests. Over time, the most transferable parts of this represented layer could become part of the broader tokenized asset market, making this an early indicator of institutional infrastructure for tokenization.
Stablecoins bring large Treasury-backed dollar liquidity onto blockchain rails. Tether’s Q1 2026 attestation reported US$141B of direct and indirect U.S. Treasury exposure backing approximately US$180B+ of USDT outstanding. Circle’s Q1 2026 SEC filing indicated approximately US$77B of USDC outstanding, with reserves primarily held through cash and Treasury instruments. Stablecoins are not tokenized Treasury funds, but they prove that large Treasury-backed dollar balances can scale on-chain. Recent filings from BlackRock and J.P. Morgan suggest this reserve base could become a direct distribution channel for GENIUS-Act eligible tokenized money market products. Even modest migration of Treasury-linked stablecoin reserves into tokenized vehicles would add tens of billions to distributed tokenized RWA value.
RWA perpetuals show that flow-based demand is not limited to spot issuance. These contracts reference assets such as gold, silver, oil, and equities while trading through crypto-native market structure. Monthly volumes are now US$100B+, with Q1 2026 volumes exceeding the full-year 2025 figure. These instruments are not the same as spot tokenized RWAs, but they show an active demand layer running parallel to tokenized issuance. As tokenized assets become more liquid, collateral-eligible, and easier to access, part of this synthetic demand could migrate toward tokenized underlying assets.
Taken together, the market already spans distributed assets, represented assets, stablecoin reserve-linked exposure, and derivatives activity. While not equivalent categories, they point to the same structural trend: traditional asset exposure is increasingly moving through crypto market infrastructure.
Tokenization Runway Potential
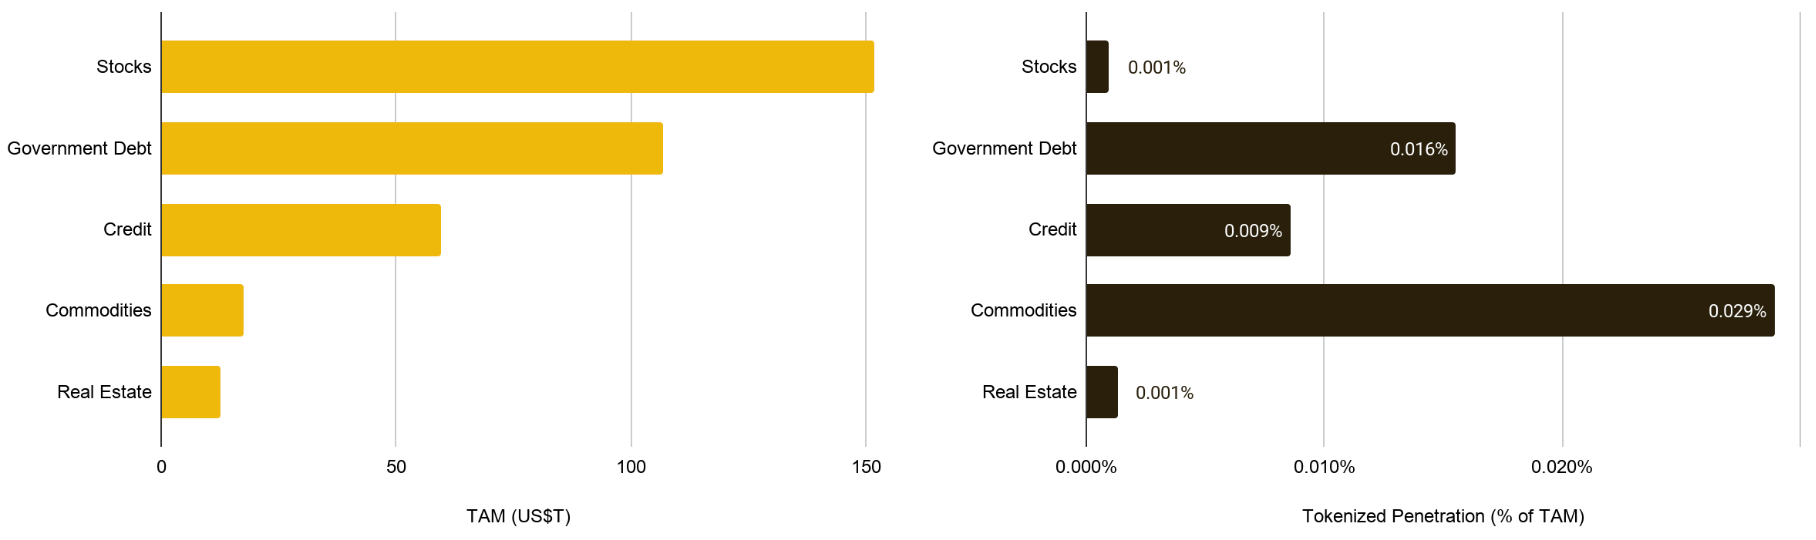
The addressable market is large by any reasonable measure. The principal asset categories that tokenization could address exceed US$300T globally. Yet current penetration across these categories is around 0.01%, placing the market at a very early stage of any plausible adoption curve.
Figure 3: Tokenized penetration remains minimal across large traditional asset markets
ETFs, while not a perfect comparison, offer a useful historical reference. They packaged existing securities for trading through existing exchanges and custodians. Tokenization is more complex because it requires new or upgraded infrastructure across custody, transfer agents, issuance, settlement, secondary markets, and differing regulatory treatment.
Tokenization also has advantages ETFs did not have at a comparable stage. Financial markets are more digital and global, institutional issuance is already leading growth, on-chain wallets already hold large pools of capital, and tokenized assets are programmable from launch. These features create potential for faster network effects once regulation, liquidity, and distribution improve.
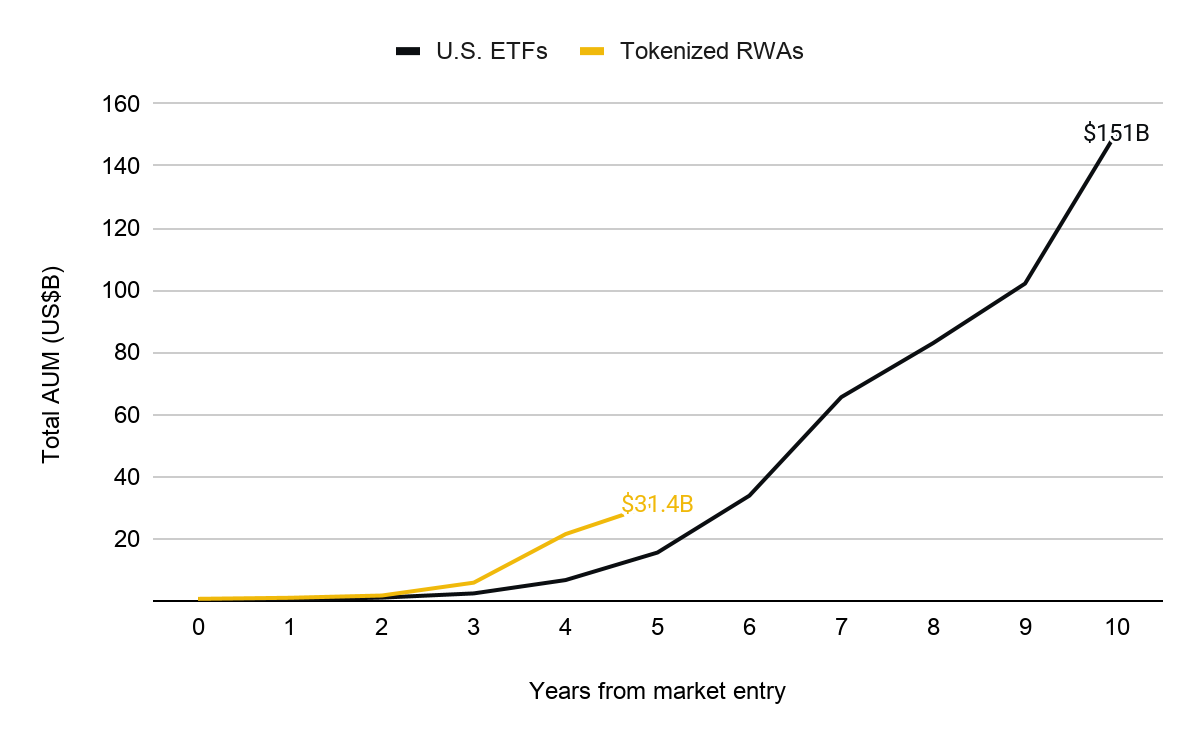
Following the launch of the first US ETF in 1993, ETFs took around three decades to reach meaningful penetration of the equity market. Tokenized RWAs have reached US$31.4B within five years of crossing the US$0.5B threshold. On adoption alone, ETFs took roughly nine years to cross US$100B in AUM, while tokenization could reach that level in less time if recent growth patterns continue. The key question is whether institutional distribution and secondary-market liquidity can sustain that pace.
Figure 4: Tokenization vs ETF adoption at an equivalent stage of market entry
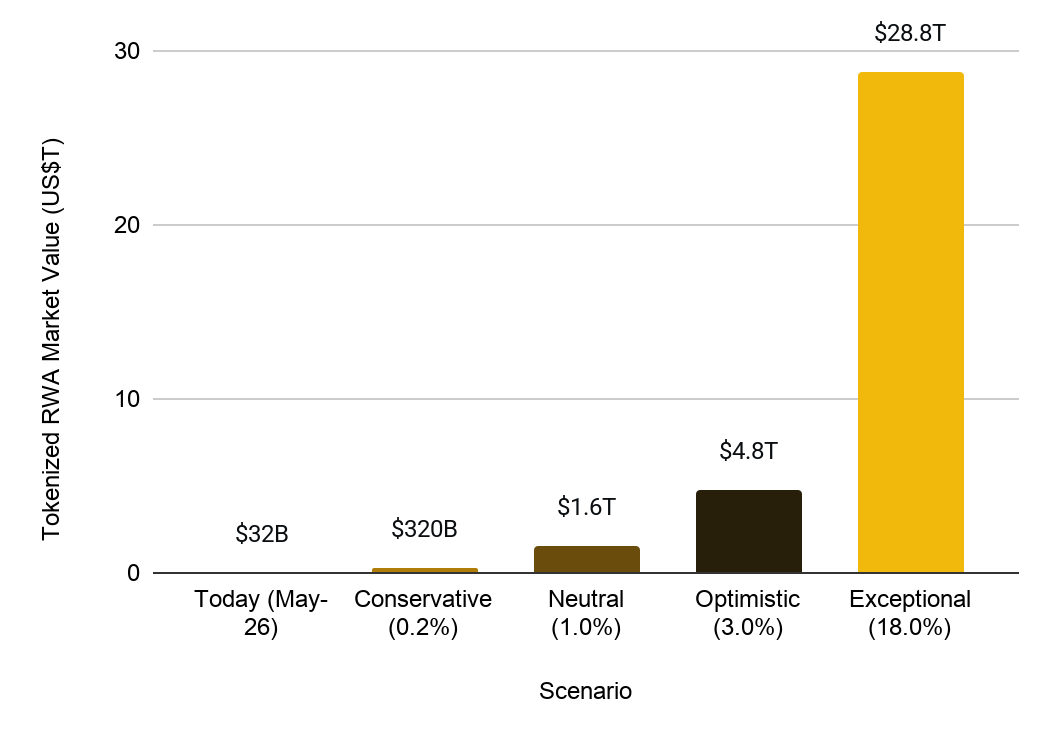
Scenario analysis illustrates how wide the range of outcomes could be by 2030.
In the conservative case, the tokenized asset market reaches around US$320B by 2030. This assumes regulatory frameworks improve, but custody, liquidity, distribution, and secondary markets remain limited. Adoption stays concentrated in tokenized Treasuries, tokenized gold, and selected institutional credit products.
In the base case, the market reaches around US$1.6T. This would require regulation and custody to mature, institutional liquidity to improve by 2029, and adoption expands across Treasuries, credit markets, commodities, tokenized funds, and early equity rails. This still implies sub-1% aggregate penetration of major addressable asset classes.
In the optimistic case, the market reaches around US$4.8T. Institutional uptake broadens across asset managers, exchanges, brokers, custodians, and on-chain venues. Tokenized assets increasingly become collateral, fund-access, settlement, and market-infrastructure instruments rather than only investment products.
The exceptional case is mentioned only as a directional reference. This would imply a market size well above the optimistic case, but it would require a much faster digital-payments-style adoption curve and becomes a major financial-market rail.
Figure 5: 2030 tokenization scenarios
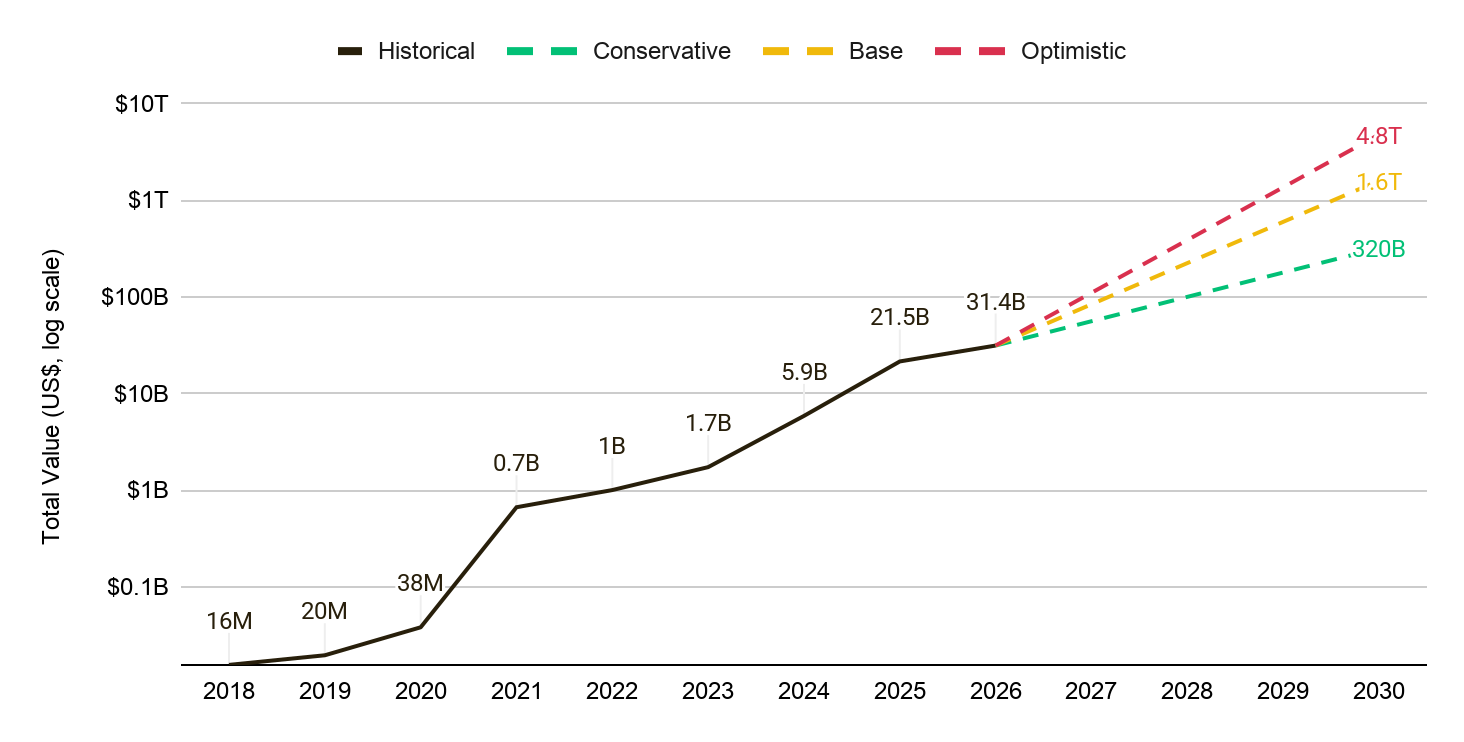
The historical growth path shows how quickly the market has scaled and why the core scenarios are worth considering. Tokenized asset value rose from around US$16M in 2018 to US$31.4B in 2026, with most growth occurring over the past few years. Even the conservative case implies a much larger market by 2030, while the base and optimistic cases point to a shift toward trillion-dollar tokenized markets.
Figure 6: Tokenized asset growth scenarios point to a multi-trillion-dollar market by 2030
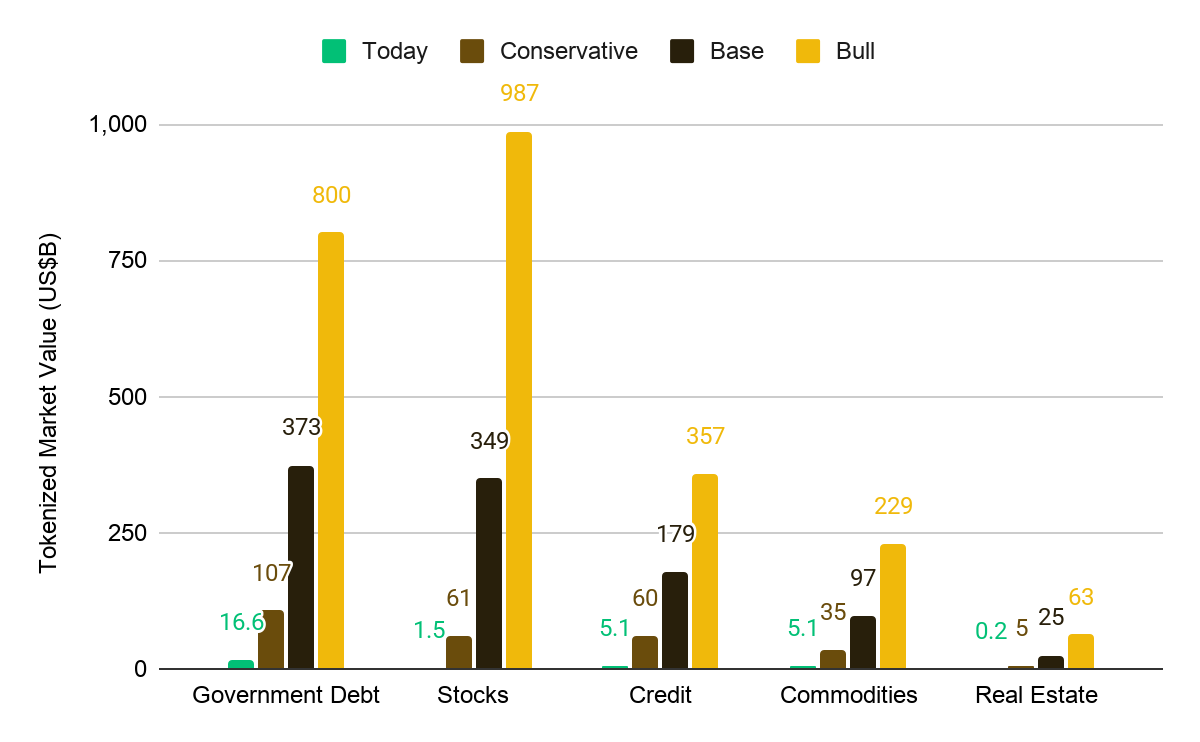
Different asset classes face different adoption frictions, which is why category-specific assumptions are useful to analyze. For instance, tokenized Treasuries face fewer barriers because the underlying asset is liquid, standardized, and already used for cash management. Tokenized real estate faces heavier friction because title, local regulation, tax, transfer, liquidity, and asset-level due diligence are harder to standardize.
Among the major segments, government debt and equities represent the largest modeled opportunities because they combine large addressable markets with potential institutional distribution pathways. Under the base case, each segment can surpass US$300B, while today the two combined are still only around US$18B.
Figure 7: 2030 tokenization scenarios by category
For government debt, the base case assumes tokenized Treasury and money market products become more common institutional cash-management and collateral instruments. Products such as BUIDL and USYC have shown early product-market fit, and stablecoin regulation may support demand for transparent Treasury-linked instruments.
For equities, the TAM is the largest, but adoption is still early. The opportunity depends on whether tokenized equity rails move from pilots and isolated offerings into regulated broker, exchange, custodian, and settlement workflows. Even in the optimistic case, penetration can remain low while still producing a large dollar opportunity.
For credit, tokenization has strong near-term product-market fit because it addresses access, transferability, servicing, and secondary-market liquidity. Private credit has higher current penetration than most other categories, but transfer restrictions, KYC, lender consent, servicing, documentation, and investor-eligibility requirements should limit the speed of adoption.
For commodities, adoption is almost entirely gold-led. Tokenized gold has clear product-market fit as a digital commodity, collateral, and treasury asset. Broader commodity tokenization, including oil and agricultural products, faces custody, storage, delivery, and redemption frictions.
For real estate, adoption is likely to remain lowest. REITs and real estate funds can be tokenized more easily than individual properties, but direct property tokenization remains structurally difficult because of title systems, jurisdictional rules, tax treatment, custody, transfer mechanics, and fragmented liquidity.
Across scenarios, the path to 2030 is likely to be determined less by aggregate demand than by the readiness of regulatory, settlement, custody, liquidity, and distribution layers. Even low-single-digit penetration would represent a major expansion.
Key Inflection Points
Several structural conditions are advancing in parallel for the first time. The next 12 to 18 months are likely to determine where the market lands on the adoption curve.
1. Regulation is becoming more explicit
Regulatory frameworks are a key catalyst. The GENIUS Act established a U.S. federal framework for payment stablecoin issuance, moving stablecoin regulation toward a clearer national standard. The implementation phase matters because reserve, disclosure, licensing, and compliance rules can shape demand for transparent Treasury-linked instruments on blockchain rails. The CLARITY Act (not yet enacted) adds to the broader regulatory direction by advancing a digital asset market-structure framework.
Tokenized securities are also moving closer to regulated market infrastructure. Nasdaq’s tokenization pathway indicates that tokenized securities may increasingly integrate with existing market systems rather than remain separate from them. If tokenized securities can trade through familiar broker and exchange infrastructure, the adoption barrier falls materially.
2. DTCC can move tokenization into default market infrastructure
Settlement infrastructure is another concrete near-term catalyst, and Depository Trust & Clearing Corporation (DTCC) is central to that point. DTCC sits at the core of U.S. markets, so a tokenization service inside that infrastructure would be very different from a standalone crypto-native product.
DTCC has announced plans for limited production tokenized securities activity in July 2026 and a broader launch in October 2026. Initial scope is expected to focus on highly liquid assets such as major US equities, ETFs, and U.S. Treasury securities, with participation from a broad group of financial institutions. Once progressed, tokenization begins shifting from a parallel system to an optional setting within default capital-market infrastructure. The market does not need a large share of DTCC-eligible assets to migrate for the impact to be meaningful relative to today’s US$31.4B distributed RWA market.
3. Institutional distribution is broadening
Institutional adoption is expanding through asset-manager filings, tokenized share classes, money market funds, Treasury products, credit products, exchange integrations, and custody partnerships. The pattern is clear: established issuers are preparing for tokenization to become a key financial distribution rail.
This changes the growth path. ETFs scaled through exchange access and investor distribution. Tokenization is developing through asset managers, custodians, exchanges, transfer agents, brokers, wallets, and stablecoin rails. If these channels converge, selected tokenized assets can scale faster than a simple AUM comparison suggests.
4. Usage is becoming the next growth lever
The strongest demand shift occurs when tokenized assets become usable, not just investable. Several tokenized money market and Treasury products saw modest initial AUM growth, followed by stronger adoption once accepted as collateral or integrated into trading and custody workflows.
This is the key difference between issuance and usage. A tokenized asset held only for yield behaves like an investment product. A tokenized asset used for margin, settlement, financing, reserves, or collateral starts behaving like market infrastructure. That can increase demand without requiring issuance to grow at the same pace.
Tokenization should therefore be assessed through both stock and flow metrics. AUM shows how much value has been issued, while usage shows whether those assets are becoming embedded in financial activity. Once accepted across multiple workflows, the same dollar of tokenized value can support a larger economic footprint.
Looking Ahead
Tokenization has become one of the clearest convergence themes between crypto and traditional finance. The market is still only around one basis point of the core addressable opportunity, but growth is accelerating, institutional participation is broadening, and usage is moving beyond idle AUM.
Near-term catalysts include stablecoin regulation, DTCC’s tokenization service, tokenized equity infrastructure, and the integration of tokenized funds into collateral and settlement workflows. These developments matter because they move tokenization closer to default financial rails. Two areas outside the core model are also worth watching:
The first is sovereign tokenization. No major sovereign issuer has issued debt natively on-chain at commercial scale, although pilot programs are underway in several jurisdictions, including the UK Treasury’s DIGIT program and institutional collateral pilots in Japan. A move from pilot to commercial issuance by even one major sovereign could reshape the tokenized debt trajectory.
The second is private markets. Private companies account for a growing share of corporate value, and many of the fastest-growing companies are staying private for longer. Companies such as SpaceX, Anthropic, OpenAI, among others show how much value creation now happens before public-market access becomes available. a16z estimates around 1,300 private unicorns with roughly US$4.7T in aggregate value, creating an investable universe that public-market investors largely cannot access. Tokenized vehicles offering exposure to private equity or venture-backed companies remain early, but they address a longstanding structural gap in access and secondary-market liquidity.
For now, the principal observation is simple: the conditions for a materially larger tokenized market by 2030 are advancing at the same time, while current penetration remains extremely low. If these conditions continue to converge, the growth rates seen in 2026 may eventually look modest.
GENERAL DISCLOSURE: This material is prepared by Binance Research and is not intended to be relied upon as a forecast or investment advice, and is not a recommendation, offer or solicitation to buy or sell any securities, cryptocurrencies or to adopt any investment strategy. The use of terminology and the views expressed are intended to promote understanding and the responsible development of the sector and should not be interpreted as definitive legal views or those of Binance. The opinions expressed are as of the date shown above and are the opinions of the writer, they may change as subsequent conditions vary. The information and opinions contained in this material are derived from proprietary and non-proprietary sources deemed by Binance Research to be reliable, are not necessarily all-inclusive and are not guaranteed as to accuracy. As such, no warranty of accuracy or reliability is given and no responsibility arising in any other way for errors and omissions (including responsibility to any person by reason of negligence) is accepted by Binance. This material may contain ’forward looking’ information that is not purely historical in nature. Such information may include, among other things, projections and forecasts. There is no guarantee that any forecasts made will come to pass. Reliance upon information in this material is at the sole discretion of the reader. This material is intended for information purposes only and does not constitute investment advice or an offer or solicitation to purchase or sell in any securities, cryptocurrencies or any investment strategy nor shall any securities or cryptocurrency be offered or sold to any person in any jurisdiction in which an offer, solicitation, purchase or sale would be unlawful under the laws of such jurisdiction. Investment involves risks. For more information, see our Terms of Use and Risk Warning.