
1. What happened in the cryptocurrency market last night?
In the past 24 hours, Bitcoin plummeted 9% to below $113,000, while Ethereum briefly fell below the $4,200 mark, triggering a chain reaction of liquidations in on-chain contract trading. According to CoinGlass data:
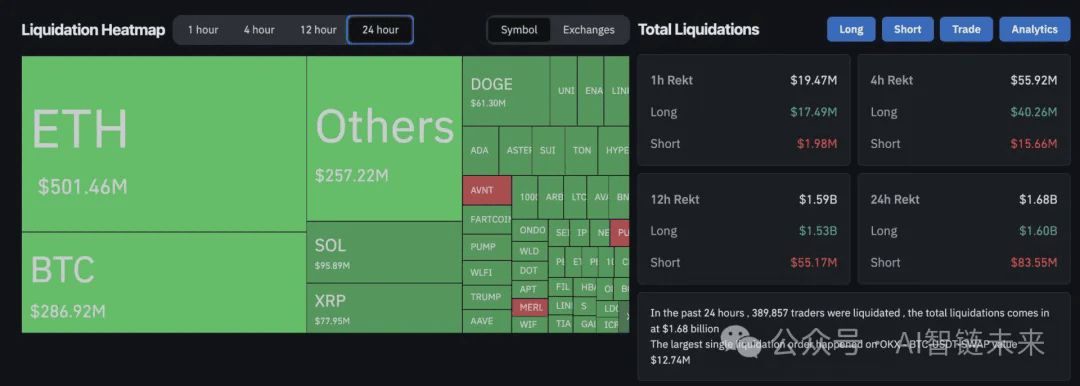
The total liquidation across the network reached $1.681 billion, with 93% being long positions ($1.535 billion)
Over 389,000 traders were forced to close their positions, with the largest single liquidation reaching $12.74 million (OKX BTC-USDT perpetual contract)
Ethereum became the hardest hit: 95% of the $500 million in liquidation came from long positions, and panic spread to Layer 2 and DeFi tokens
"It's like a game of dominoes—when the price breaks key support levels, a large number of highly leveraged positions are automatically liquidated by algorithms, increasing the selling pressure." said a quantitative trader at a Wall Street hedge fund.
II. The cost of leverage frenzy: Why was this liquidation so brutal?
1. Mechanism defect: When risk control design becomes a 'guillotine'
The unique 100x leverage, automatic liquidation mechanisms, and low liquidity environment of cryptocurrency contracts create inherent systemic risks.
Margin cascading: Exchanges force liquidation orders to be executed at market price, accelerating price declines → triggering more liquidations → forming a vicious cycle
The 'liquidity trap' phenomenon: Insufficient depth in the derivatives market exacerbates volatility in extreme market conditions (According to BitMEX data, Bitcoin perpetual contract 24-hour trading volume plummeted 37%)
2. Greed signals revealed by funding rates
Before the liquidation, the market has shown signs of overheating:
Bitcoin funding rates hit a three-month high (Binance perpetual contract reached 0.12%)
Ethereum leverage long-short ratio once broke 7:1 (Bybit exchange data), traders overly bet on the ETF expectations
“When leverage becomes a consensus tool in the market, any black swan event will evolve into widespread hunting.” Glassnode analyst James Check once warned.
III. In-depth review: How have historical 'liquidation waves' affected market direction?
January 2018
March 2020
May 2021
June 2024 (current)
Trigger events: South Korean regulatory storm, COVID-19 outbreak, Chinese mining ban, Federal Reserve hawkish expectations, single-day liquidation amount of $2.4 billion, $950 million, $8.5 billion, $1.68 billion, subsequent trends, bear market begins, V-shaped reversal, three months bottoming rebound???
(Data source: TradingView/CoinGlass)
Historical experience shows that large-scale long liquidations often mean:
✅ Short-term panic bottom signal: Bitcoin rose 300% in five months after March 2020
⛔️ Mid-term adjustment precursor: After the crash in May 2021, the market entered a six-month consolidation period
❗️ The key variable is: whether macroeconomic policy will turn.
IV. The crossroads of the crypto market: Three core contradictions
Contradiction 1: The Federal Reserve's 'ambiguous expectations'
This week's key variables: US PMI data, initial jobless claims, Powell's congressional testimony
Market pricing chaos: CME interest rate futures show that traders' predictions for the September rate cut probability fluctuate sharply between 48%-67%
Contradiction 2: The capital siphoning effect of Bitcoin spot ETFs
Capital flow differentiation: June ETF weekly net inflow plummeted 82% (Farside Investors data)
CoinW strategist Nassar Achkar pointed out: 'Institutions are more inclined to hold Bitcoin as a 'hedging deposit', which suppresses the liquidity premium of Ethereum and altcoins.'
Contradiction 3: The 'self-fulfilling prophecy' of the derivatives market
Open interest (OI) plummets: Bitcoin OI decreases by 19%, indicating a large withdrawal of funds and a wait-and-see attitude
Options volatility surface inversion: Deribit data shows that the put option premium hit a yearly high
V. Survival rules in a crisis: How do professional institutions layout?
1. On-chain data reconnaissance
Exchange inventory monitoring: When Binance's cold wallet sees a large inflow, it may signal large holders' selling
Holder cost distribution: IntoTheBlock model shows that the current $112,000 range gathers 26% of Bitcoin holding addresses
2. Hedge strategy upgrades
Intertemporal arbitrage: Locking in profits using futures contract price differences (e.g., shorting spot when the current contract is at a 3% discount)
Volatility insurance: Buying out-of-the-money put options to hedge downside risk (cost about 2%-5% of principal)
3. Macroeconomic narrative tracking framework
Federal Reserve policy → USD liquidity → Risk asset valuation → Crypto market beta coefficient
“The current core contradiction is: Bitcoin is viewed both as 'digital gold' and as a high-risk technology asset.” — Excerpt from Bridgewater Fund Report
VI. In conclusion: The cognitive breakthrough of retail investors
When the market experiences more than $1.5 billion in long liquidations, ordinary investors should be wary of two extreme mindsets:
❌ Blindly bottom-fishing: 'When others are fearful, I am greedy' can become a deadly trap during the leverage liquidation tide
❌ Panic exit: History proves that liquidity crises often accompany medium to long-term value returns
Real opportunities are often hidden in the answers to three questions:
Is the current leverage ratio back to a safe threshold? (Reference: Bitcoin open interest/market cap ratio drops below 0.8%)
Have funding rates returned to neutral? (Healthy range: ±0.05%)
Is market panic confirmed by data? (e.g., on-chain transfer frequency, exchange withdrawal volume)
The storm will eventually pass, but only investors who penetrate the data fog will seize the opportunity in the next wave.


