Have you seen how the price of $BTC or $ETH can go from falling to rising sharply in just a few candles?
This doesn’t happen by chance: many times, the change is announced with Japanese candlestick patterns called bullish reversals.
In this guide, you will learn to recognize the 4 most reliable patterns that will help you detect potential entries before the price skyrockets. 💡
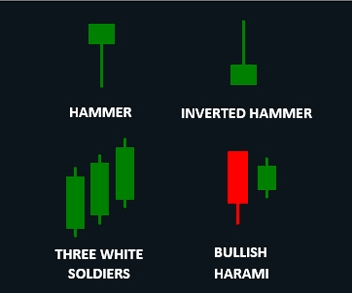
1. Hammer
What it looks like:
A candle with a small body and a long lower wick, at least double the body. The top has almost no shadow.
What does it mean:
During the session, sellers pushed the price down, but buyers intervened strongly before the close.
➡️ Clear signal that the market rejects low prices and could start a bullish reversal.
Tip:
Works best in support areas or after a series of bearish candles.
2. Inverted Hammer
How it looks:
A candle with a small body at the bottom and a long upper wick.
What does it mean:
Shows that buyers tried to push the price up, although they did not fully succeed.
However, it indicates that the bearish pressure is weakening and the market could be preparing for a bullish turn.
Tip:
It is more reliable if the next candle closes above the body of the inverted hammer.
3. Three White Soldiers
How it looks:
Three consecutive bullish candles, each closing higher than the previous one and solid bodies (without long shadows).
What does it mean:
It is one of the strongest signals of a bullish reversal.
Shows increasing confidence from buyers and the start of a sustained upward trend.
Tip:
Avoid trading if it occurs just below strong resistance; it is more reliable after a sharp decline.
4. Bullish Harami
How it looks:
A two-candle pattern: the first is bearish and large, followed by a small candle inside the body of the previous one.
What does it mean:
Reflects that the selling strength is waning and buyers are starting to enter.
➡️ It is an early signal of a possible trend change.
Tip:
If the second candle closes above the high of the first, the signal strengthens.
How to analyze them on Binance
Open the chart of your favorite pair (for example, BTCUSDT).
Activate the Japanese candlestick view.
Select the 4H or 1D time frame.
Look for the mentioned patterns near supports or oversold areas.
Confirm the signal with indicators like RSI.
Bullish reversal patterns are a key tool for spotting opportunities ahead of others.
Although they do not guarantee results, combining them with technical analysis and risk management can make the difference between an impulsive and a strategic entry.
Remember: patience and practice are your best allies on the trading journey. 💪
Have you detected any of these patterns lately in $BTC or $ETH?
Share it in the comments 👇
#Trading #EducacionCripto #VelasJaponesas #BinanceSquare #BTCUSDT #ETHUSDT #BNBUSDT


