Bitcoin, known as 'digital gold', has recently dimmed in luster, with both bulls and bears fiercely contesting the $92,000 mark. Market sentiment appears to be one of panic, but often during such times, opportunities are quietly brewing.
Yesterday, Bitcoin once again staged a 'roller coaster' market, first briefly breaking below $89,000, dipping to around $88,600, and then rebounding strongly—perfectly aligning with the long position strategy of $89,450 to $89,000 mentioned in our article yesterday, with the first target of $92,500 already achieved.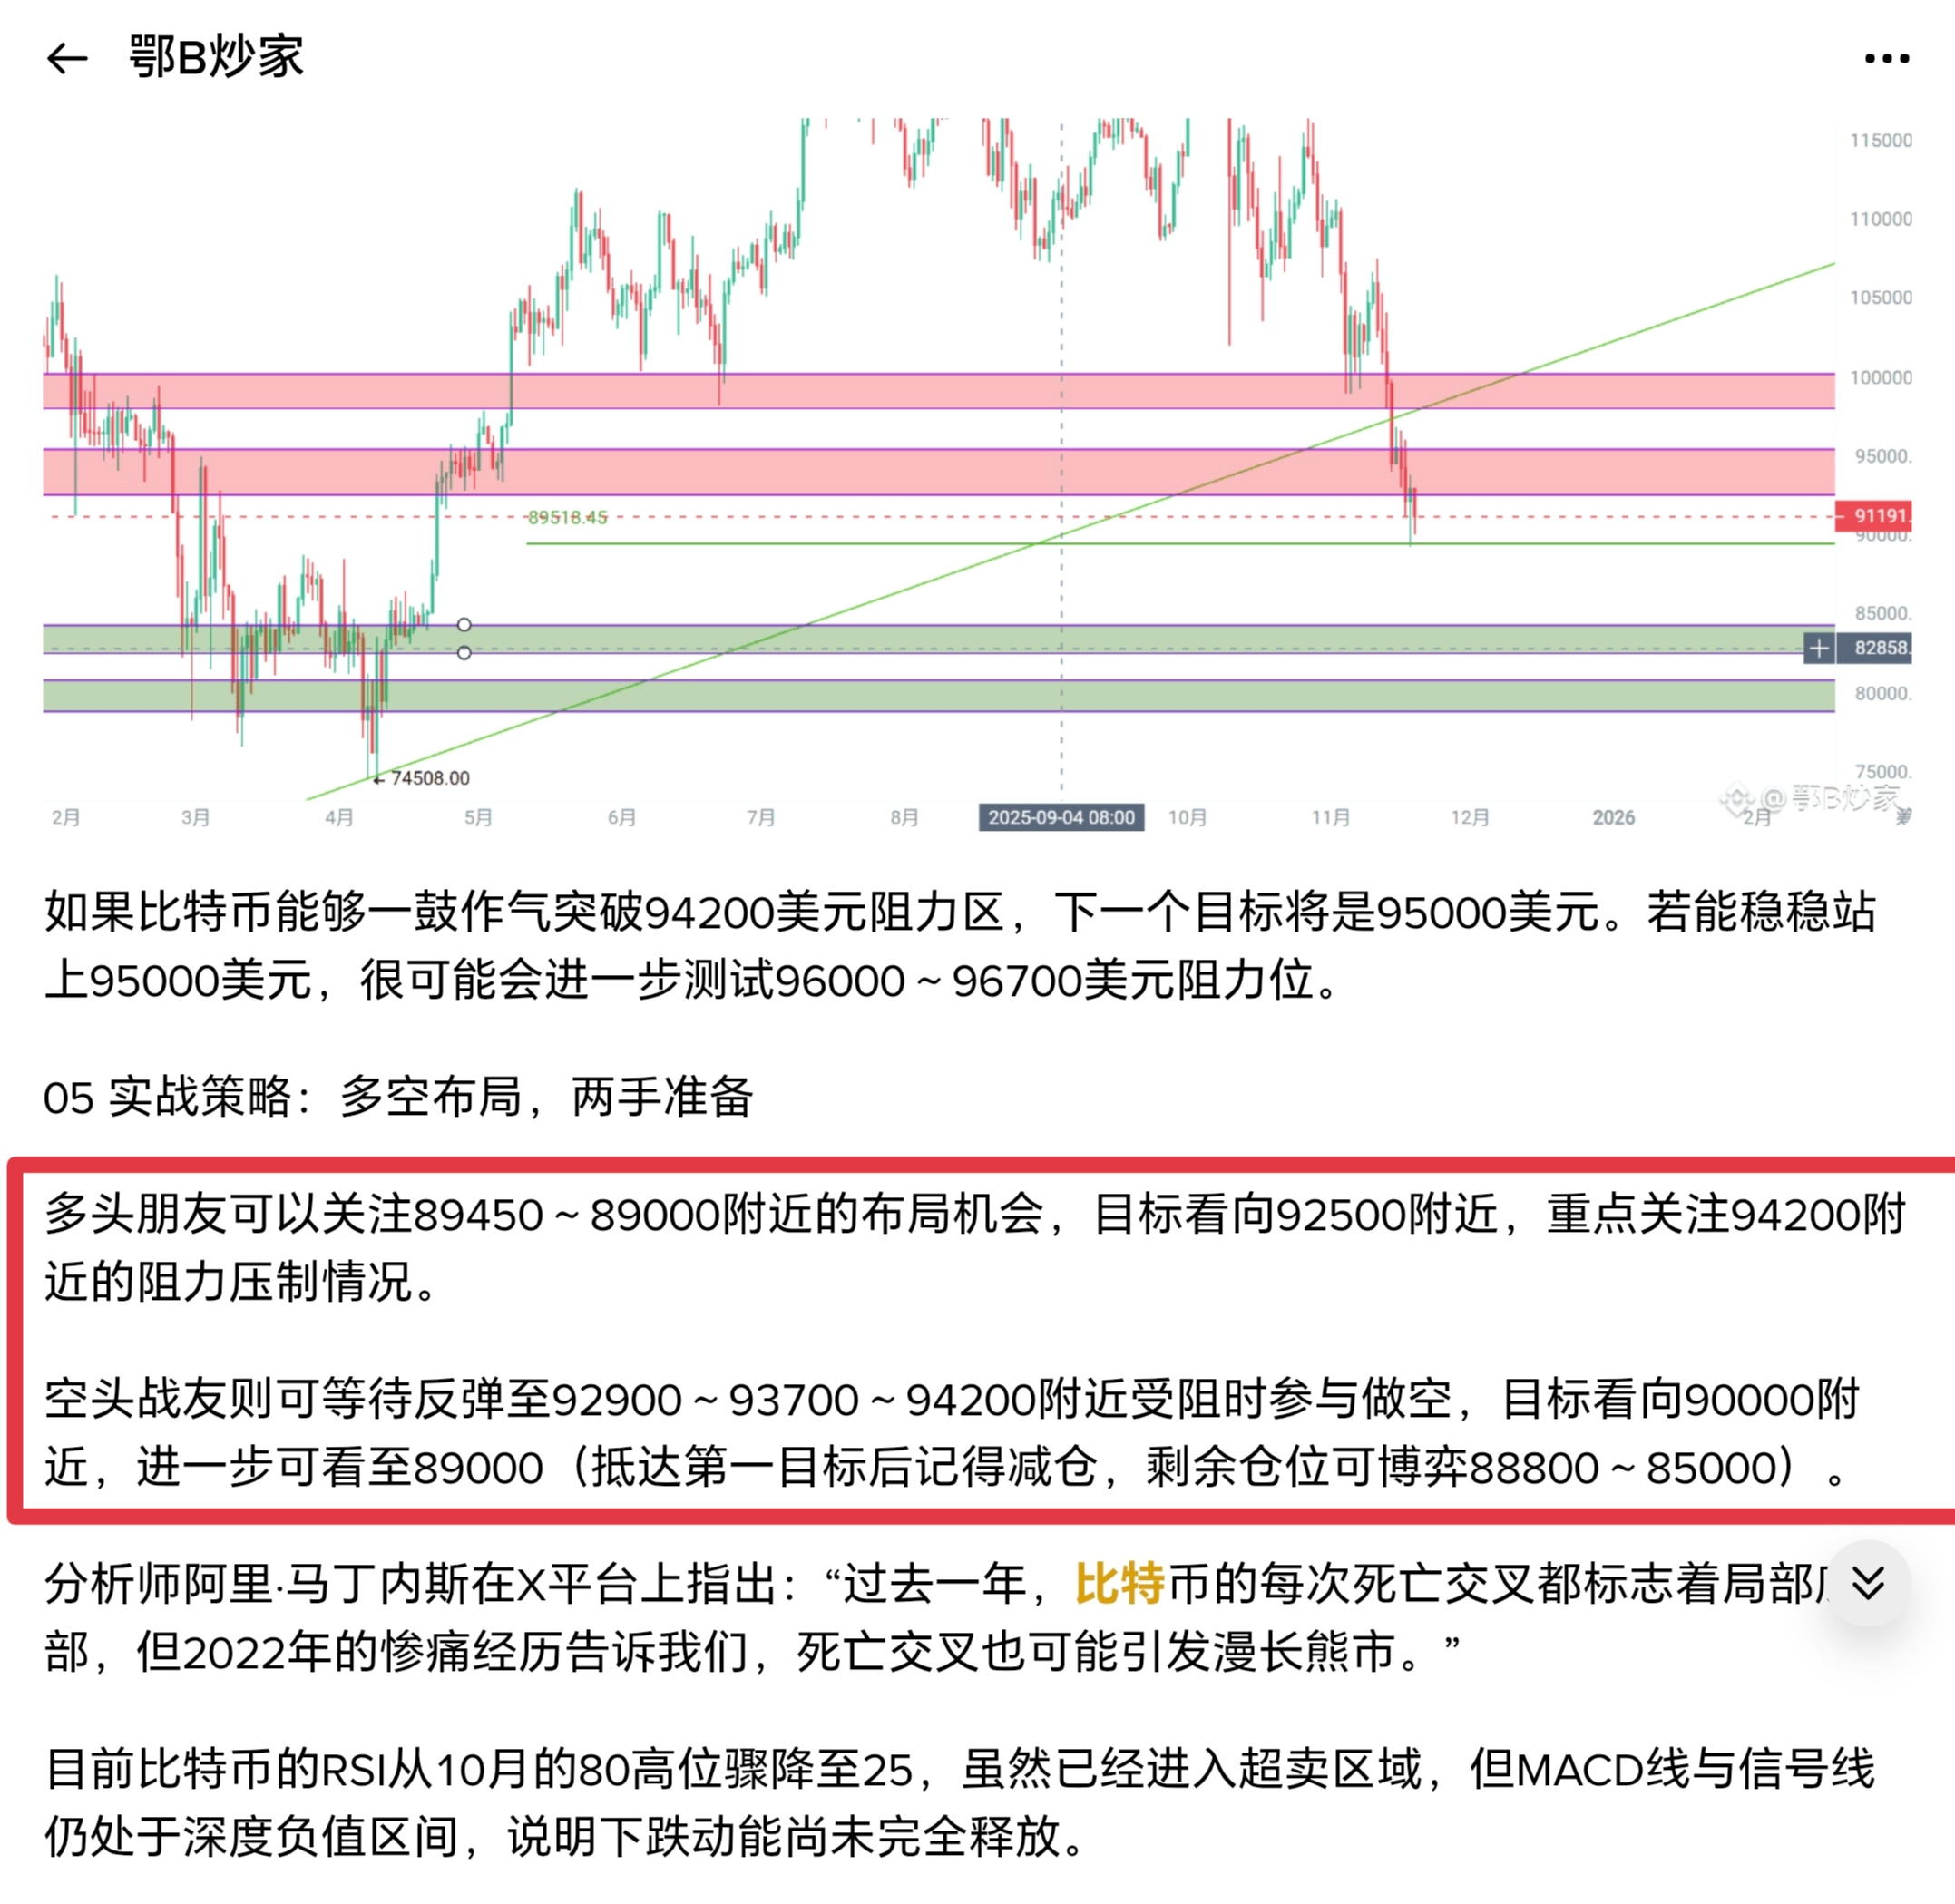
📉 Market sentiment and price trends
The continuous decline over 43 days has brought Bitcoin its most severe round of adjustment since 2017. Panic selling has intensified, threatening not only the psychological 'Maginot Line' at $90,000 but even briefly breaking below $89,000, setting a new low in nearly seven months.
The total market capitalization of crypto assets has also significantly shrunk from about $4.3 trillion at the beginning of October to the current $3.2 trillion, with over $1 trillion in market value 'vanishing'.
Multiple factors are behind this decline: the cooling of expectations for Federal Reserve interest rate cuts, the slowdown in institutional fund inflows, and the aftershocks from last month's large-scale liquidation. In the past 24 hours, more than 170,000 people have been liquidated, with a liquidation amount reaching $650 million.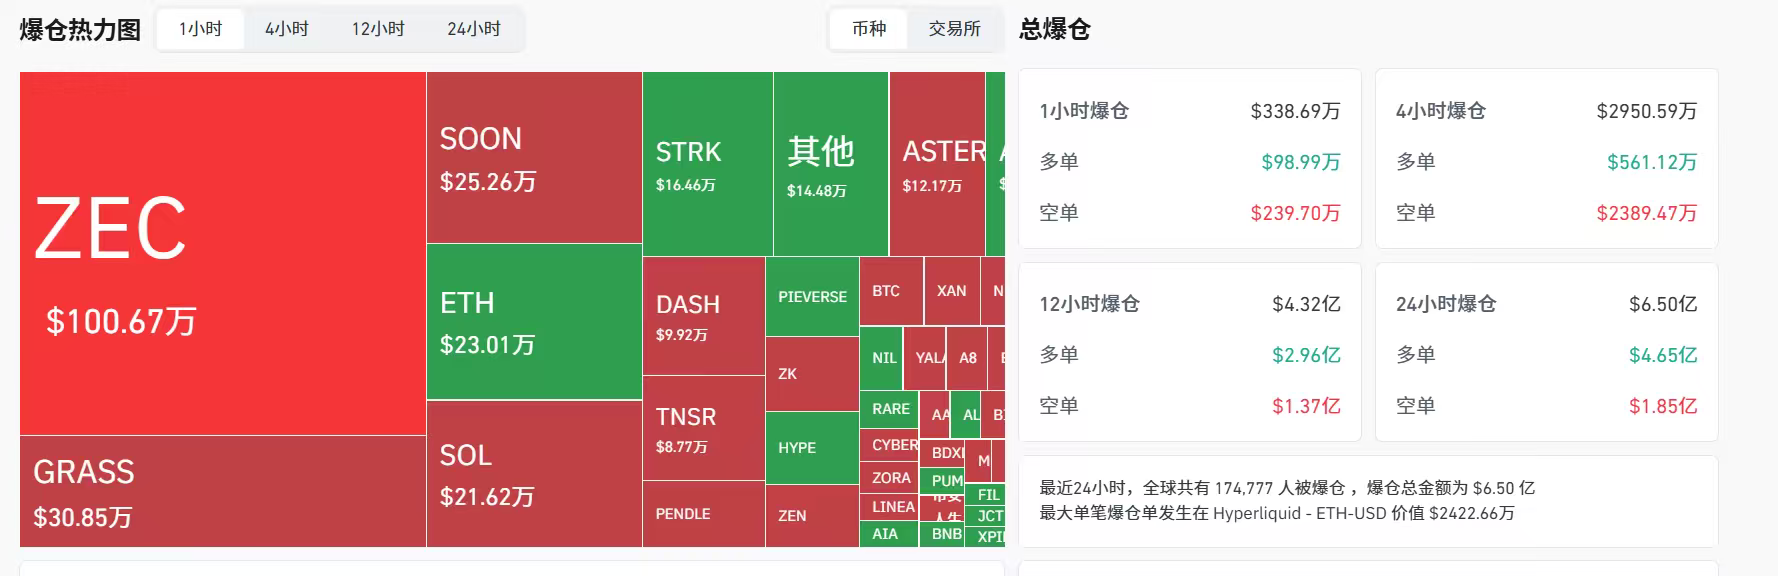
📊 In-depth analysis of technical indicators
From a technical perspective, Bitcoin is at a critical juncture. Multiple indicators show that the market has entered the oversold range, but the overall trend remains weak.
In terms of the RSI indicator, the 14-day RSI has quickly fallen from the overbought zone above 70 to around 29.36, entering the oversold area, with a possibility of a technical rebound in the short term.
In the moving average system, the 50-day/200-day moving averages have formed a 'death cross', which is a signal worth noting, similar to the pattern at the beginning of the bear market in 2022.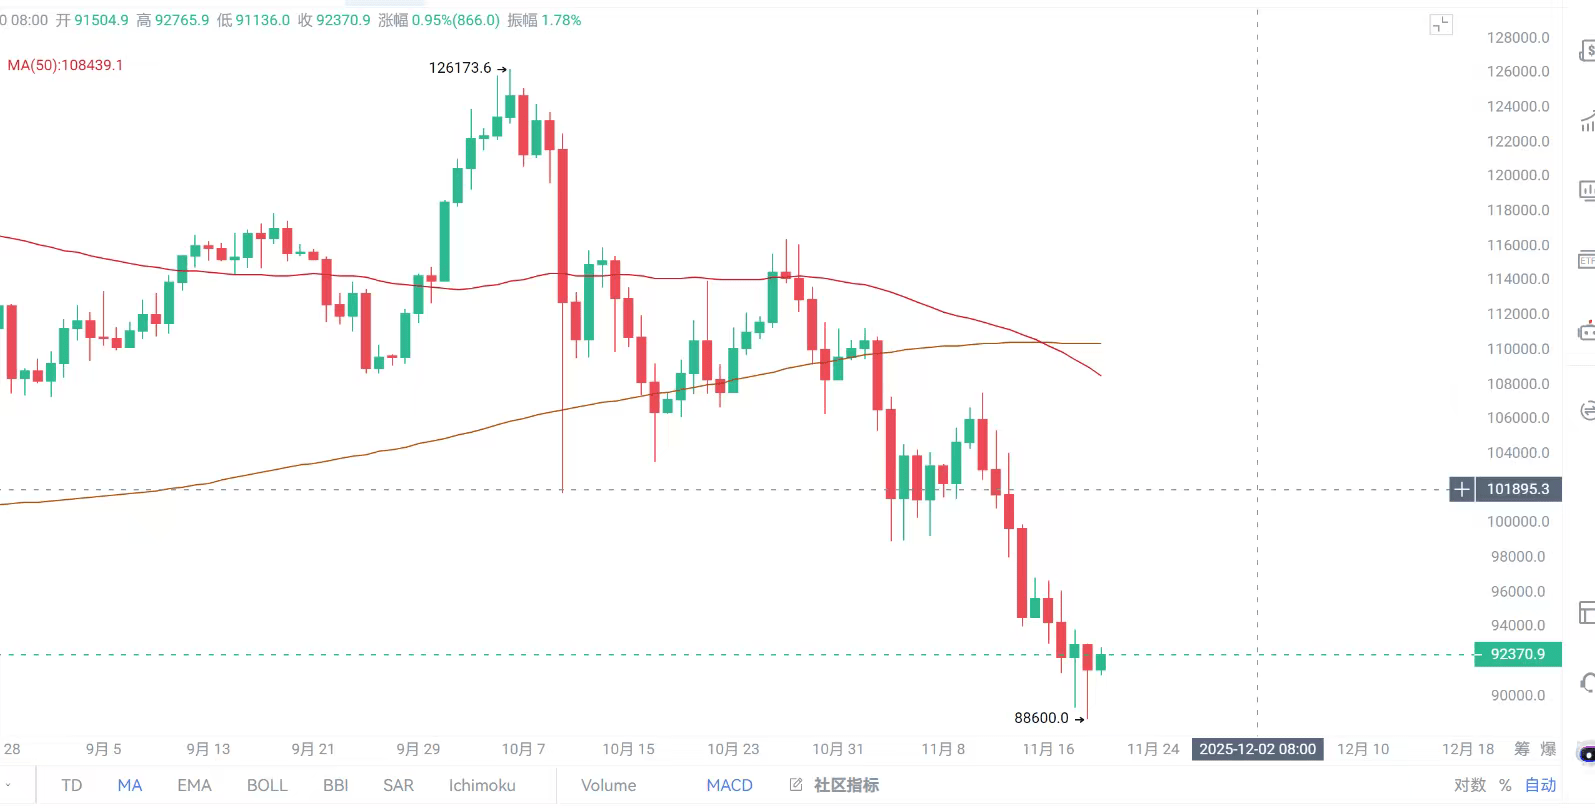
Currently, the Bitcoin price has fallen below all major moving averages, including the 7-day simple moving average ($97,747) and the 20-day simple moving average ($103,126), indicating that selling pressure is still ongoing.
The MACD indicator remains in negative territory, showing that underlying momentum is still weak.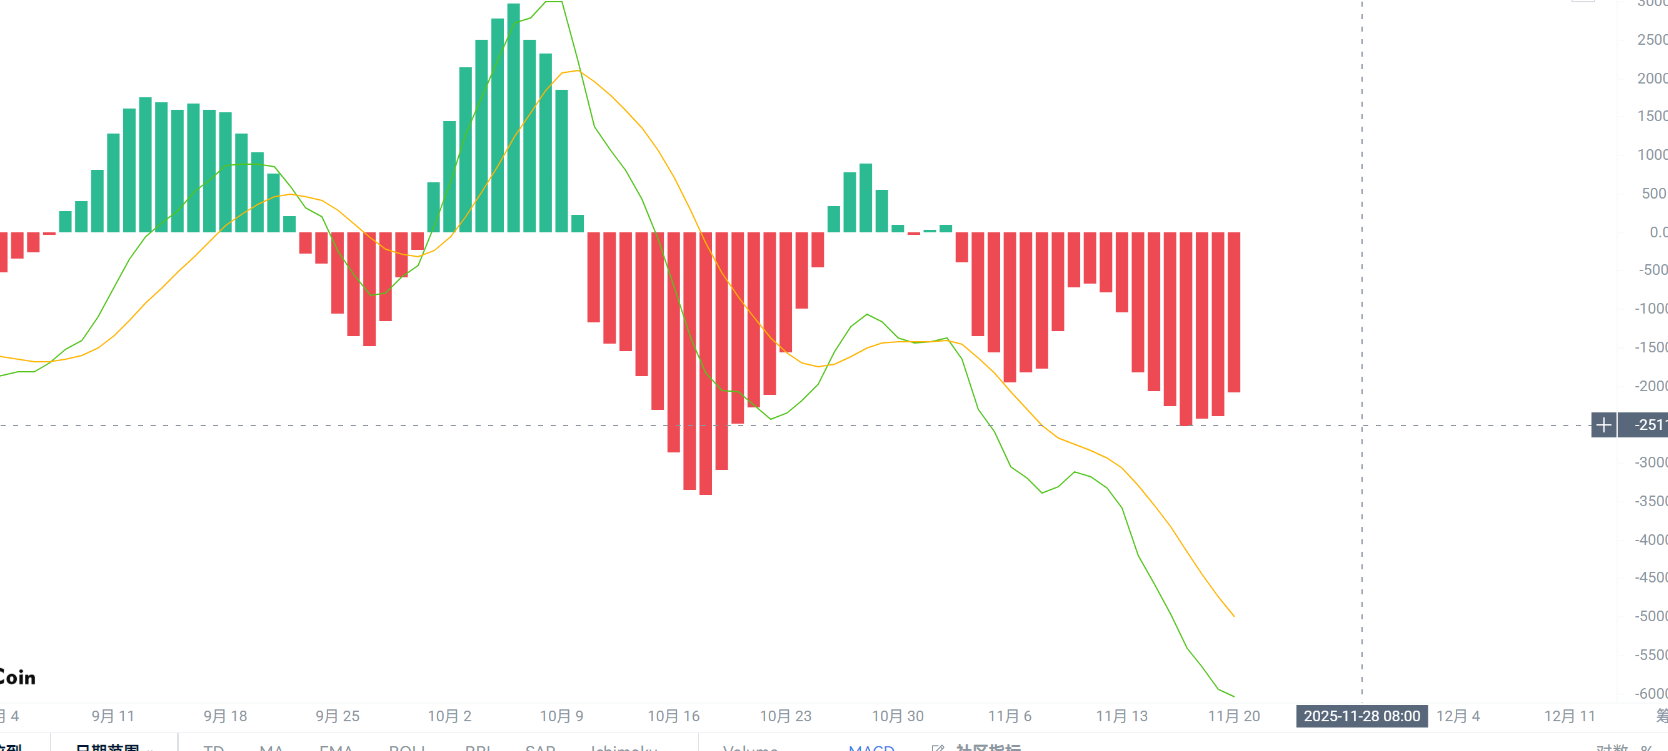
⚖️ Key support and resistance levels
Core resistance area:
· The first resistance above is in the $93,200-$94,400 range, with a bearish trendline near $93,200.
· Stronger resistance levels are at $94,500 and $96,000.
Key support levels:
· Recent support is seen at $91,150 and $90,500, where there is support from the Fibonacci extension line.
· Major support is at the psychological level of $90,000 and near $88,500.
· The $84,000-$86,000 range is a possible short-term bottom area.
If $84,000 ultimately fails to hold, the market may further dip to $74,433, which is the average cost line for major Bitcoin holdings.
🔗 On-chain data and market fundamentals
Although the technical aspects look weak, the on-chain data and market fundamentals present a different picture.
Holding behavior data shows that the proportion of Bitcoin held for the long term (over 1 year) has risen to 65%, and the UTXO age distribution indicates that the market is still in an accumulation phase, rather than a panic sell-off.
In terms of ETF fund inflows, there has been a cumulative inflow of $61.9 billion for the year, but it has turned into net outflows after the third quarter.
Institutions like MicroStrategy are still continuously accumulating, but retail panic has exacerbated short-term selling pressure.
The correlation between Bitcoin and traditional financial markets has risen to 0.6-0.7, significantly influenced by interest rates, inflation, and liquidity conditions. The trend in 2025 will largely still be dominated by macro tightening policies.
🎯 Trading strategies and position management
Based on the above analysis, here are the current trading strategy suggestions:
Regarding the handling of yesterday's long positions:
Bitcoin has rebounded from the bottom. The long positions we suggested in yesterday's article at $89,450 to $89,000 have completed a reduction near the first target of $92,500. It is advised to continue liquidating 80% of positions near $92,900.
Intraday trading strategy:
· If the price rebounds to the $93,200-$93,800-$94,400 range, consider entering short positions in batches, paying attention to position control.
· If the price strongly breaks through $94,400 and stabilizes, it may open up further upward space; at this point, one should not blindly aim for the top.
· If the price falls below the $89,000 support again, the next target looks towards $88,500, or even $86,500 levels.
After liquidating 80% of long positions near $92,900, if the price is blocked and falls back, refer to the points mentioned in the article for batch positioning in short positions, but do not take on overly heavy positions. This round of movement may also directly break through $94,000; trading has no certainty, we can only play it safely!
🔮 Subsequent trend predictions (predictions are for reference only, beware of risks)
The market may present three scenarios:
· Further correction to $70,000, with a probability of about 15%.
· Continue to consolidate, exchanging time for space, with a probability of up to 50%.
· A rebound has begun, returning above $100,000, and even setting a new high, with a probability of about 35%.
Although the short-term (1-3 months) has entered a technical bear market correction, technical indicators, on-chain data, and the macro environment all show that downward pressure remains, with target levels looking at the $70,000-$80,000 range.
But this does not mean the arrival of a full-blown bear market. Institutional ETF funds and on-chain holding behavior indicate that Bitcoin's fundamentals remain solid, with no risk of a crash. This cycle may extend into the second half of 2026.
The market is always moving through fluctuations. As Matt Hogan, Chief Investment Officer of Bitwise Asset Management, said: 'The sell-off seems to be nearing its end, but we may still have to endure some downward volatility before the market truly stabilizes.'
As long as the support at $88,400 holds, a short-term rebound can still be expected; if it can break the $93,200 resistance, it may open the door to $94,500.
The essence of trading is not predicting but responding. Every time you trade, be sure to strictly control your position and avoid going all in recklessly.
Written by: E B Trader

