📉➡️📈 Market Structure Breakdown Explained (My Analysis)
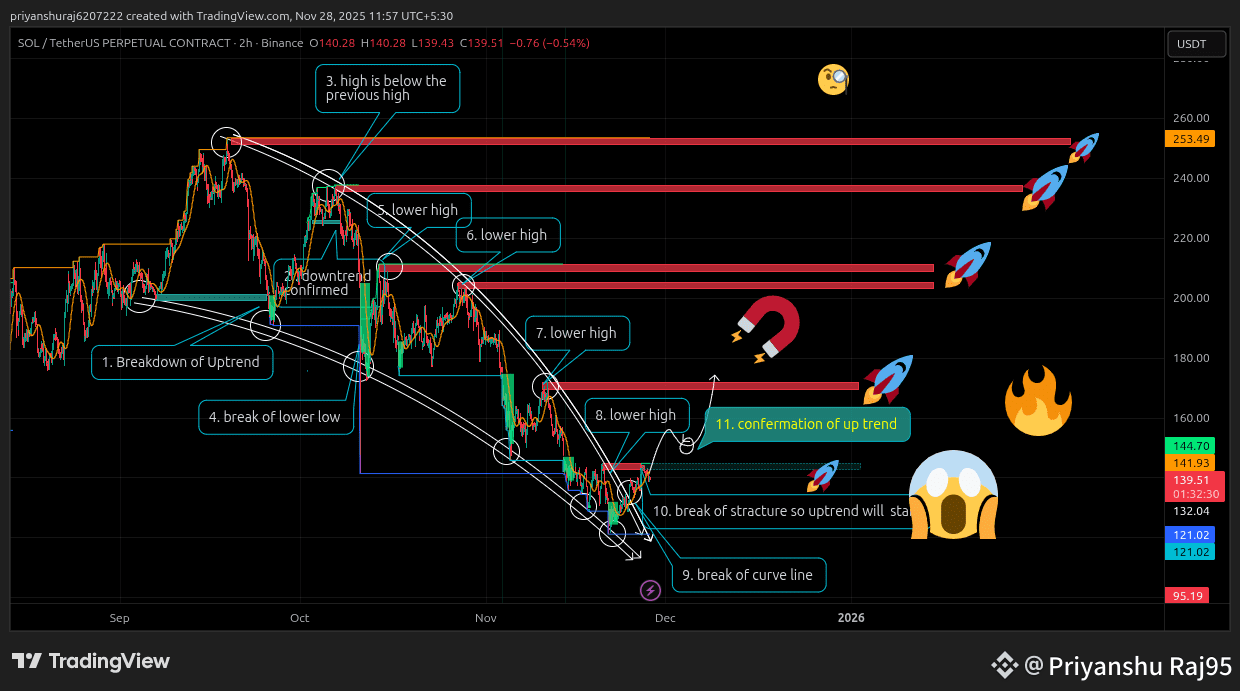
In this chart $SOL , I have mapped the complete market structure from the end of the uptrend, the entire downtrend, and finally the start of a new uptrend. Here is the clear step-by-step ex

Explanation:
1️⃣ Breakdown of Uptrend
The price was in an uptrend, making Higher Highs (HH) and Higher Lows (HL).
But then the structure broke when the price failed to create a new Higher High.
This was the first warning that buyers were losing strength.2️⃣–3️⃣ Formation of Lower Highs
The next highs formed lower than the previous highs.
This confirmed that the uptrend was weakening.
A lower high = loss of bullish momentum.4️⃣ Break of Previous Low
The price broke below the previous Higher Low.
This officially ended the uptrend and marked the beginning of a downtrend.
5️⃣–8️⃣ Continuous Lower Highs
During the downtrend, the market kept forming:
Lower High 5
Lower High 6
Lower High 7
Lower High 8
This showed that sellers were fully in control.
Every bounce was rejected from a lower level.
9️⃣–1️⃣0️⃣ Final Breakdown
Price made another Lower Low and completed the downtrend structure.
Later, the curve line (trendline) broke, showing sellers are losing momentum.1️⃣1️⃣ Confirmation of New Uptrend (Important Part)
The market structure flipped when:
The price broke the last Lower High,
Created a new Higher Low,
And started moving upward with strength.
This is the official confirmation that a new uptrend has started.
🎯 Target Zones Highlighted
Hey u can see in the chart $SOL if the uptrend confirmed then there are the target points
If the uptrend continues, these are the key levels:
$144 – $150 → First major resistance
$180 – $200 → Next resistance
$220 – $260 → Higher targets
$295 → All-Time High (ATH) zone
If the structure continues, price may reach these levels one by one.
✅ Summary
This chart shows the full cycle:
Uptrend → Breakdown → Downtrend → Trend Exhaustion → New Uptrend Confirmation in $SOL
Understanding structure like this helps catch trend reversals early and avoid false signals
🔥At Last
That’s all for today’s analysis. This is just the beginning—stay updated with me for powerful insights every day 🤟😍🔥
#BinanceHODLerAT #BinanceAlphaAlert #BuyTheDip #LONG✅ #LongTermHolders