Following the previous text: (From the perspective of stablecoin market capitalization, the market is not yet bearish; 80,000 is far from the bottom of a bear market

Yesterday I looked at the market capitalization of stablecoins, and today I looked at the situation of spot BTC ETFs
It can be said that the current market weakness is basically caused by the outflow of ETF funds
But even so, after considering the market capitalization of stablecoins and the situation with ETFs
My judgment on the current market remains
It is still not considered a bear market; it is in a range of medium-term correction + repricing
It feels more like a deep correction in a bull market rather than the starting point of a new bear market
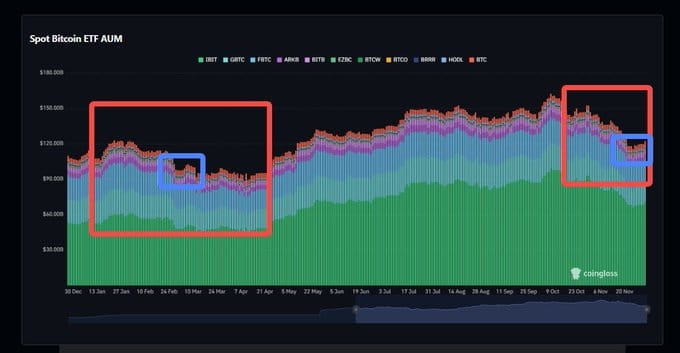
1. ETF managed asset scale
If you look at the relevant data of ETFs, you will find many related indicators. Here I will share the two most important indicators first.
This is an important indicator for determining the long-term trend of the cryptocurrency market.
I have also thoughtfully circled the ETF data from January to April of this year, the reason was mentioned in the last post, it currently seems to be the most similar to this pullback.
Also, the bear market from 2021 to 2023 cannot find data in ETFs because the first ETF was only available in 2024.
You can see on the far right of the image, the scale of ETF holdings has shown a significant decline.
This is because compared to the funding sources of stablecoins, the funds for ETFs mainly come from family offices, pension funds, and other traditional finance, whose allocation range is global assets.
So when BTC reached its peak of 120,000 in October, the cost-effectiveness of BTC had significantly declined, and coupled with the crash on 10.8, traditional old money would shift focus to traditional assets like gold and bonds, withdrawing funds from crypto.
It should be noted that ETFs are purchased directly with fiat currency, which is a different system from stablecoins.
This is not determined by scale, as the current total market value of stablecoins is 260 billion, while ETFs are at 160 billion.
The reason is that ETFs affect the supply-demand pattern, for example, if BlackRock buys BTC, that portion of BTC will be custodied and disappear from the liquidity pool.
Simply put, once bought, it is not easily let go, so the inflow of ETFs will push up the price of BTC, like a price floor.
Institutions that buy crypto with stablecoins are generally exchanges or market makers, even if the crypto market is weak in the short term, they will not flee en masse, just holding signals like U.
This is also why the market value of stablecoins is steadily rising while the scale of ETFs is declining.
However, if you observe the blue-circled part during the process, you will find that the scale of ETF holdings showed a steady pullback on 11.25.
If we look for the sword in the boat, it is very similar to the rhythm circled in blue on the left side, both are the end of the first wave of decline, entering a slow pullback.
But the market on the left will still have a few small pullbacks, and from a timing perspective, the pullback in 2024 lasted 4 months, while this pullback has only lasted 1 month.
From the perspective of time dimension and trend, it basically matches.
But it does not rule out the possibility of a real bear market like in 2021 mentioned in the last post, it's just that there are currently no signals of a real bear market appearing.
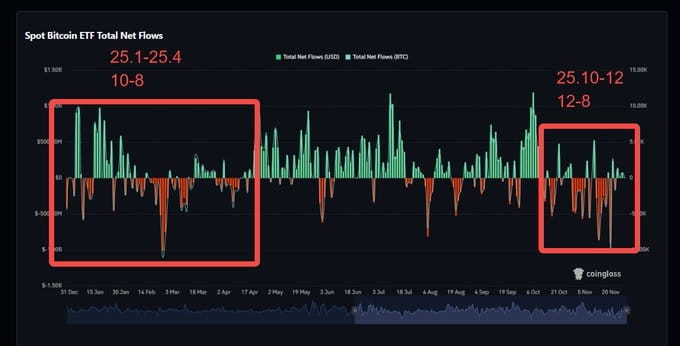
2. Total net inflow and outflow of ETFs
This indicator can be used to look at short-term trends, similarly, since 11.25, there has already been continuous positive inflow, the direction is right, but the strength is lacking.
Looking at the left-side pullback - rebound, the current inflow seems more like an institutional probe.
Even if there is a consecutive large positive inflow like on the left side, it was followed by a significant drop in BTC.
3. Market Judgment
From the perspective of stablecoin market value and ETF situation, the current market is not the same bear market as in 2021, and it doesn't even count as a bear market now.
The current market is more like a pullback, highly similar to the market trend in January 25.
It has now reached a point where direction is about to emerge.
Money in cryptocurrency is holding signals like U, when the market is bad, they just take a break.
Traditional old money is probing slightly, if the situation is not right, they will continue to flee to invest in traditional assets.
Subsequently, it is necessary to observe the total net inflow and outflow of ETH. If it appears for more than 10 consecutive days with an average daily inflow of over 1 billion, then we can determine that the pullback is over.
But as it stands, I feel that we still need to continue to probe downwards, the pullback should not be over yet.
