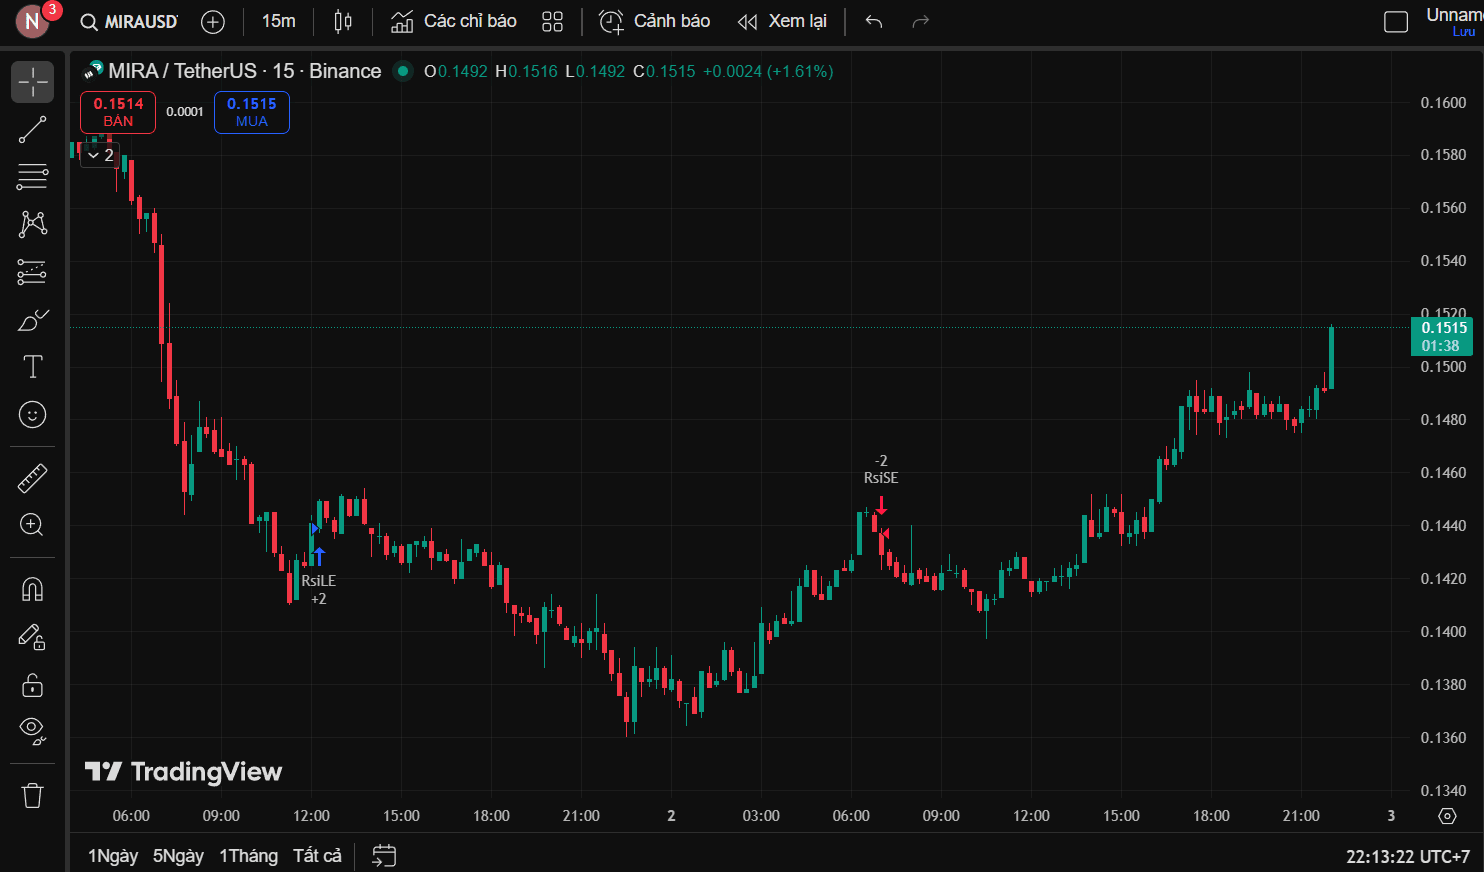
The chart shows that after a strong sell-off in the morning, MIRA is moving sideways in a typical flat accumulation pattern. At 0.148 – 0.150, there have been continuous long-legged candles, indicating that someone is holding the bottom. The push up to 0.151 at the end of the session is not coincidental as there was no reverse selling behavior. This is a sign of a short-term trend flip, very familiar in low-cap coins before a run.


MIRAUSDT
Perp
0.144
-2.70%
