I stared at the MACD line for 10 years, going from thinking it was 'outdated' to embedding it into my bones. I finally understood: is there really a 'get-rich-quick code' in the crypto world? It's just that some people have fallen enough times to learn how to read a compass in the storm — that alternating red and green line is my compass.
Why is MACD the 'king of indicators'? 5 truths honed from 10 years of practical experience.
When I first entered the cryptocurrency world, I also looked down on MACD. I thought it was too simple and not as cool as those 'multiple indicator overlapping' strategies. What was the result? After three years, I lost 800,000, and it was only when I was liquidated that I realized: all those flashy indicators were just noise, while the MACD that I had ignored contained the most practical survival logic.
1. A 'life-saving talisman' verified over decades: the old ones withstand the test.
MACD did not come from nowhere; it has been tested in the global financial markets for decades. In 2021, when BTC surged to 60,000 dollars, the whole network was shouting 'break 100,000', but MACD showed 'top divergence' at a high level — price reached a new high, but the red bars of MACD were getting shorter.
I gritted my teeth and cleared 70% of my positions; people around me laughed at me for being 'timid.' As a result, half a month later, BTC was halved, and they were trapped at the peak while I preserved my capital.
I later understood: the power of old indicators lies in their honesty. When the trend is wild, it tugs your sleeve; when it falls stupidly, it gives you a signal.
2. The 'mirror' that captures trends: seeing the direction is more important than anything.
The core of MACD is EMA (Exponential Moving Average), simply put, it helps you identify the 'big direction.'
When both the DIF and DEA lines are above the zero line, and the red bars are getting longer — this is the trend shouting 'get on board.' In 2020, when ETH started from 200 dollars, I focused on this signal, took it for half a year, going from 200 to 1800, this one wave multiplied by 9.
Conversely, when the green bars below the zero line enlarge, it means the trend is saying 'run fast.' In the bear market of 2022, I relied on this signal to stay in cash for three months, avoiding a 40% crash.
When the trend is right, making money is like sailing with the current; when the trend is wrong, no matter how hard you try, it's like rowing against the current.
3. Top and bottom divergence: the 'alarm' for buying low and selling high.
This is the trick I am most familiar with, simple enough for beginners to understand in one go:
Top divergence: price reaches a new high, but the peak of MACD is getting lower (red bars shrink to short legs) — it can't go up anymore, better withdraw quickly;
Bottom divergence: price reaches a new low, but the trough of MACD is getting higher (green bars are getting shorter) — if it has dropped significantly, it can be tested.
In 2022, BTC fell to 15,000 dollars, and the entire network shouted 'it will fall below 10,000', but MACD showed bottom divergence. I added 30% to my position, and later it rebounded to 40,000 dollars; I made 17 million from this wave.
Divergence is not 100% accurate, but it acts like a 'risk warning sign'; at least when seen, you won't blindly fall into a trap.
4. Experienced traders are all 'returning to simplicity': the simpler, the more resilient.
I've seen too many people: starting with MACD, thinking it's too low-level, rushing to fiddle with a combination of 'RSI + Bollinger Bands + trading volume', resulting in a mountain of indicators on the screen, making the order even more frantic.
It's like an experienced driver; you don't need to stare at all the dashboards. Just watching the RPM and speed is enough. MACD is the 'RPM gauge' in the crypto space; understanding it is enough for you to survive.
Now there is only one MACD line on my screen, and surprisingly, I can see it clearer than before — the noise is less, and the signals stand out.
5. Even quantitative funds recognize it: the logic must be solid.
Don't think that only retail investors look at MACD; it is a regular in the quantitative strategies of large funds. Because its logic is so solid: using the difference in moving averages to reflect trend strength and using red and green bars to display changes in momentum, it can be coded for automated execution.
This indicates that it is not 'mysticism'; it is a mathematical law that can truly be validated.
The ultimate battle in trading: it's not about technology, but the fierce anti-humanity.
Understanding MACD thoroughly is at most 'having a weapon.' What truly allowed me to roll from 200,000 to 40 million is learning 'anti-humanity' — knowing what to do, you must do it, even if you deeply wish not to.
Anti-human behavior: clearly wanting to hold a position but pressing the close button the moment the stop-loss line is hit. Once I lost 5% on ETH, my hands were shaking as I stared at the screen, but I still cut it — later it dropped 30%, that cut saved my capital.
Anti-human behavior: clearly watching the market rise with envy, yet knowing 'the trend is not clear', stubbornly staying in cash for an entire day. In 2023, there was a small market movement, everyone around me was chasing, but I held back, and three days later, it corrected. While they were trapped, I still held cash.
Anti-human behavior: clearly wanting to heavily invest but firmly holding back and only executing half of the plan. The black swan in the crypto space always comes when you feel most confident; leaving some room is leaving a way out.
These things sound simple, but doing them is harder than climbing to the sky. But have you noticed? It is exactly the same as things in life:
You don't want to work out, but you force yourself to practice; you don't want to read, but you open a book; you don't want to get up early, but you climb out of bed — these 'small things' are actually practicing the 'inner strength' of trading.
While others get bored after half an hour of watching the market, you can calm down and watch for an entire day; while others can't stand a 5% pullback and withdraw, you can hold onto the system and wait for the trend; while others play games at night, you quietly review dozens of K-line charts — this is the watershed of a trader.
The end of technology is the refining of 'human'.
People often ask me: 'What indicators should I use?' I always say: 'First, improve yourself.'
Trading lacks technology, lacks a system; what it lacks is 'the persistence of daily review', 'the steadiness to follow the plan even when emotions break', 'the harshness of executing the system even when knowing there might be losses'.
I have been watching MACD for 10 years. What I learned from the red and green bars is not just rise and fall, but the word 'not greedy': daring to pull back at top divergence, daring to position at bottom divergence, daring to wait when the trend is unclear. Those things I once thought were 'outdated' are precisely the stabilizing force in a crazy market.
My daughter often asks me: 'Isn't it tiring to watch that line every day?' I pointed at the drawing she made and said: 'Yes, but it allows us to live a stable life.'
In the murky waters of the crypto space, to truly navigate through, it relies not on clever tricks but on diligent work — thoroughly understanding one indicator, strictly adhering to one discipline, and treating 'survival' as more important than 'making quick money.'
If you're also losing, don't panic. Turn off the signal groups, calm down and look at the MACD, observe the 'old rules' that you have overlooked. Once you understand the fluctuations of that line, you'll realize: the ones that can avoid reefs are not the fastest boats, but the steadiest compass.
The road is still long; being steady is better than anything.
Recently, fans have been pestering me for technical indicators and methods. Today I will reveal everything, including trading volume, KDJ, BOLL, MACD, and the five-day moving average strategy. I hope that through learning, you can gain some confidence in the crypto space, as the saying goes: make money in a bull market, learn knowledge in a bear market.
1. Trading Volume
Trading volume refers to the specific number of trades within a certain time, including daily, weekly, monthly, or even 5-minute, 30-minute, and 60-minute charts. Trading volume is the core content of the entire market, reflecting the flow of funds. Every fluctuation in trading volume is a precursor to changes in cryptocurrency prices; a higher trading volume indicates higher attention from funds.
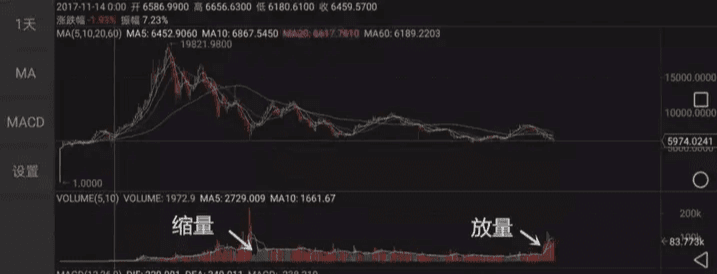 Taking MA5 as an example, trading volume above MA5 is reflected as an increase in volume, while trading volume below MA5 is reflected as a decrease in volume. Breaking above MA5 indicates a surge in popularity; conversely, it indicates a cooling market.
2.KDJ - Stochastic Indicator
The KDJ indicator, also known as the stochastic indicator, is a relatively novel and practical technical analysis tool. It was initially used for analysis in the futures market and later widely used for short to medium-term trend analysis in the stock market. It is one of the most commonly used technical analysis tools in the futures and stock markets.
 The KDJ indicator reacts relatively quickly and sensitively, suitable for the short-term overbought and oversold conditions of the market. The indicator has a delay; it can serve as one reason for buying or selling cryptocurrencies, but it is not everything.
3.BOLL - Bollinger Bands
Bollinger Bands indicators belong to path indicators, suitable for beginners, and are best used in volatile markets. It consists of upper, middle, and lower bands, with the upper and lower ranges not fixed, changing with the rolling of cryptocurrency prices.
When the cryptocurrency price is between the upper and middle bands, the upper band serves as a resistance level, and the middle band serves as a support level. Similarly, when the price is between the middle and lower bands, the middle band serves as a resistance level while the lower band serves as a support level.
 Bollinger Bands also have flaws; when a trend is forming, Bollinger Bands may not be accurate; at this point, the five-day moving average strategy is more suitable.
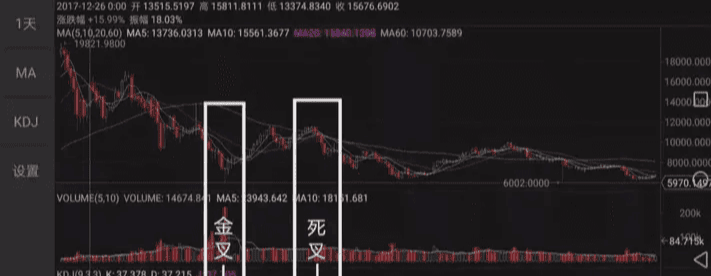
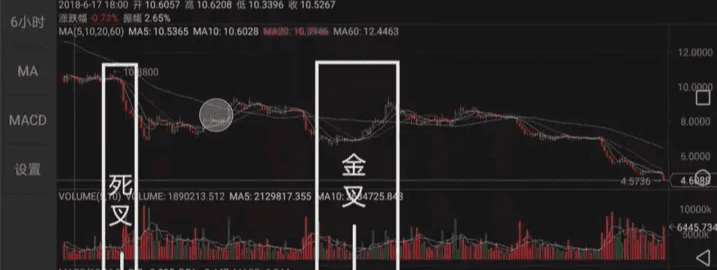
4.MACD - Smoothed Moving Average Convergence Divergence
It consists of a white line and a yellow line. When the white line crosses above the yellow line from below, it is called a golden cross - a buy signal; when the white line crosses below the yellow line from above, it is called a death cross - a sell signal. When a large trend is forming, MACD is quite effective and suitable for trending markets.
 The MACD moving average indicator is stable and can objectively reflect market momentum; the longer the cycle, the more accurate the trend. Disadvantage: MACD mainly reflects the medium to long-term trend of the market, with a delay in reflecting short-term price movements.
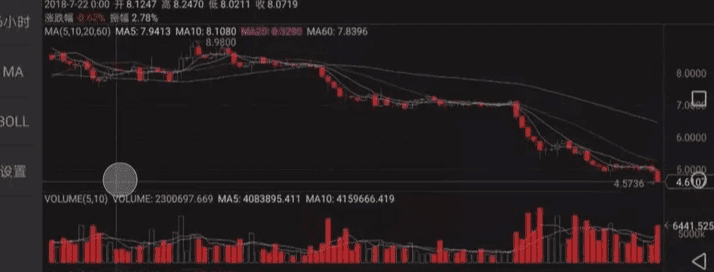
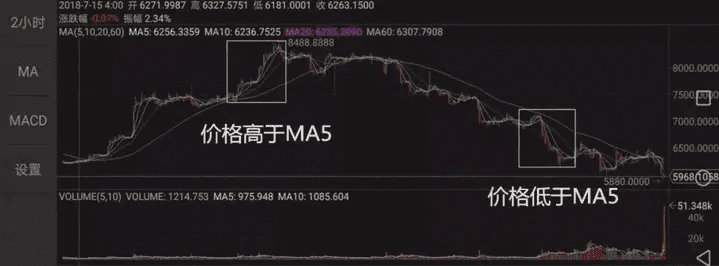
5.MA5 - Five-Day Moving Average Strategy
The last type of five-day moving average strategy, using the following figure as an example, the white line in the K-line is the 5-day line, also known as MA5. Usage: during a bull market, when the price retraces to the 5-day line, it is an opportunity to increase positions; during a bear market, when the price rebounds to the 5-day line, it is an opportunity to reduce positions. If doing short-term trading, the 4-hour MA5 also serves as a support/resistance.
 The above indicators 2, 3, and 4 will have certain delays. When we are trading short-term, we can use them as reference indicators, but we cannot rely entirely on them. To make more accurate judgments, we also need to comprehensively assess based on real-time trading volume and the five-day moving average strategy.
Ten years ago, I thought MACD was outdated, trying a bunch of flashy indicators randomly, resulting in a loss of 200,000 to just a leftover. Later, I understood: it's not that the indicators are useless, it's that I didn't grasp their temperament — when top divergence occurs, how many red bars should run, bottom divergence combined with increased trading volume is reliable, the strength difference in trends above and below the zero line... These details hidden in the red and green bars are what can truly save your life.
Focus on Wen Jing to let that MACD line you once overlooked slowly become your compass. After all, the key to making money in the crypto space has never been about how many indicators you learn, but the ability to thoroughly understand one.
How to survive in the early stages? How to allocate positions? How to find 'explosion points' to enter? How to use compound interest to walk out a doubling path?
Wen Jing focuses on ambushing Ethereum contracts; the team still has positions, get in quickly #美国ADP数据超预期 $ETH


