
"Looking out at the endless cutting-edge technologies; seeing into the future, leading a new era of investment research."
This report was provided by the WTR Research Institute:
Member's Twitter ID:
Golden Egg Diary @jindanriji; Deer Never Gets Lost @crypto_elk_; Forex Bro; Xibei @Asterismone;
The first round (OG) of WTR on-chain data subscription has officially begun!
Data provided by: WTR's self-developed short-term, medium-term, and long-term on-chain market data, as well as data on some smaller cryptocurrencies.
Pricing for the first round: 399 USDT/year. Payment supports both on-chain and off-chain transfers. (For data inquiries, add WeChat: dudulove1134)
Other notes: We have prepared a strategy package for OG users. The number of slots for this package is limited, and it is currently only open to the first round of OG users. Subscribing allows you to directly join the OG user group; please see our WeChat account for details.

This Week in Review
This week, from November 24th to December 1st, the highest price for the rock sugar orange was around $93,092, and the lowest was close to $83,822, with a fluctuation range of about 14%.
Observing the chip distribution chart, there is a large amount of chip trading around 90,000, which will provide some support or resistance.
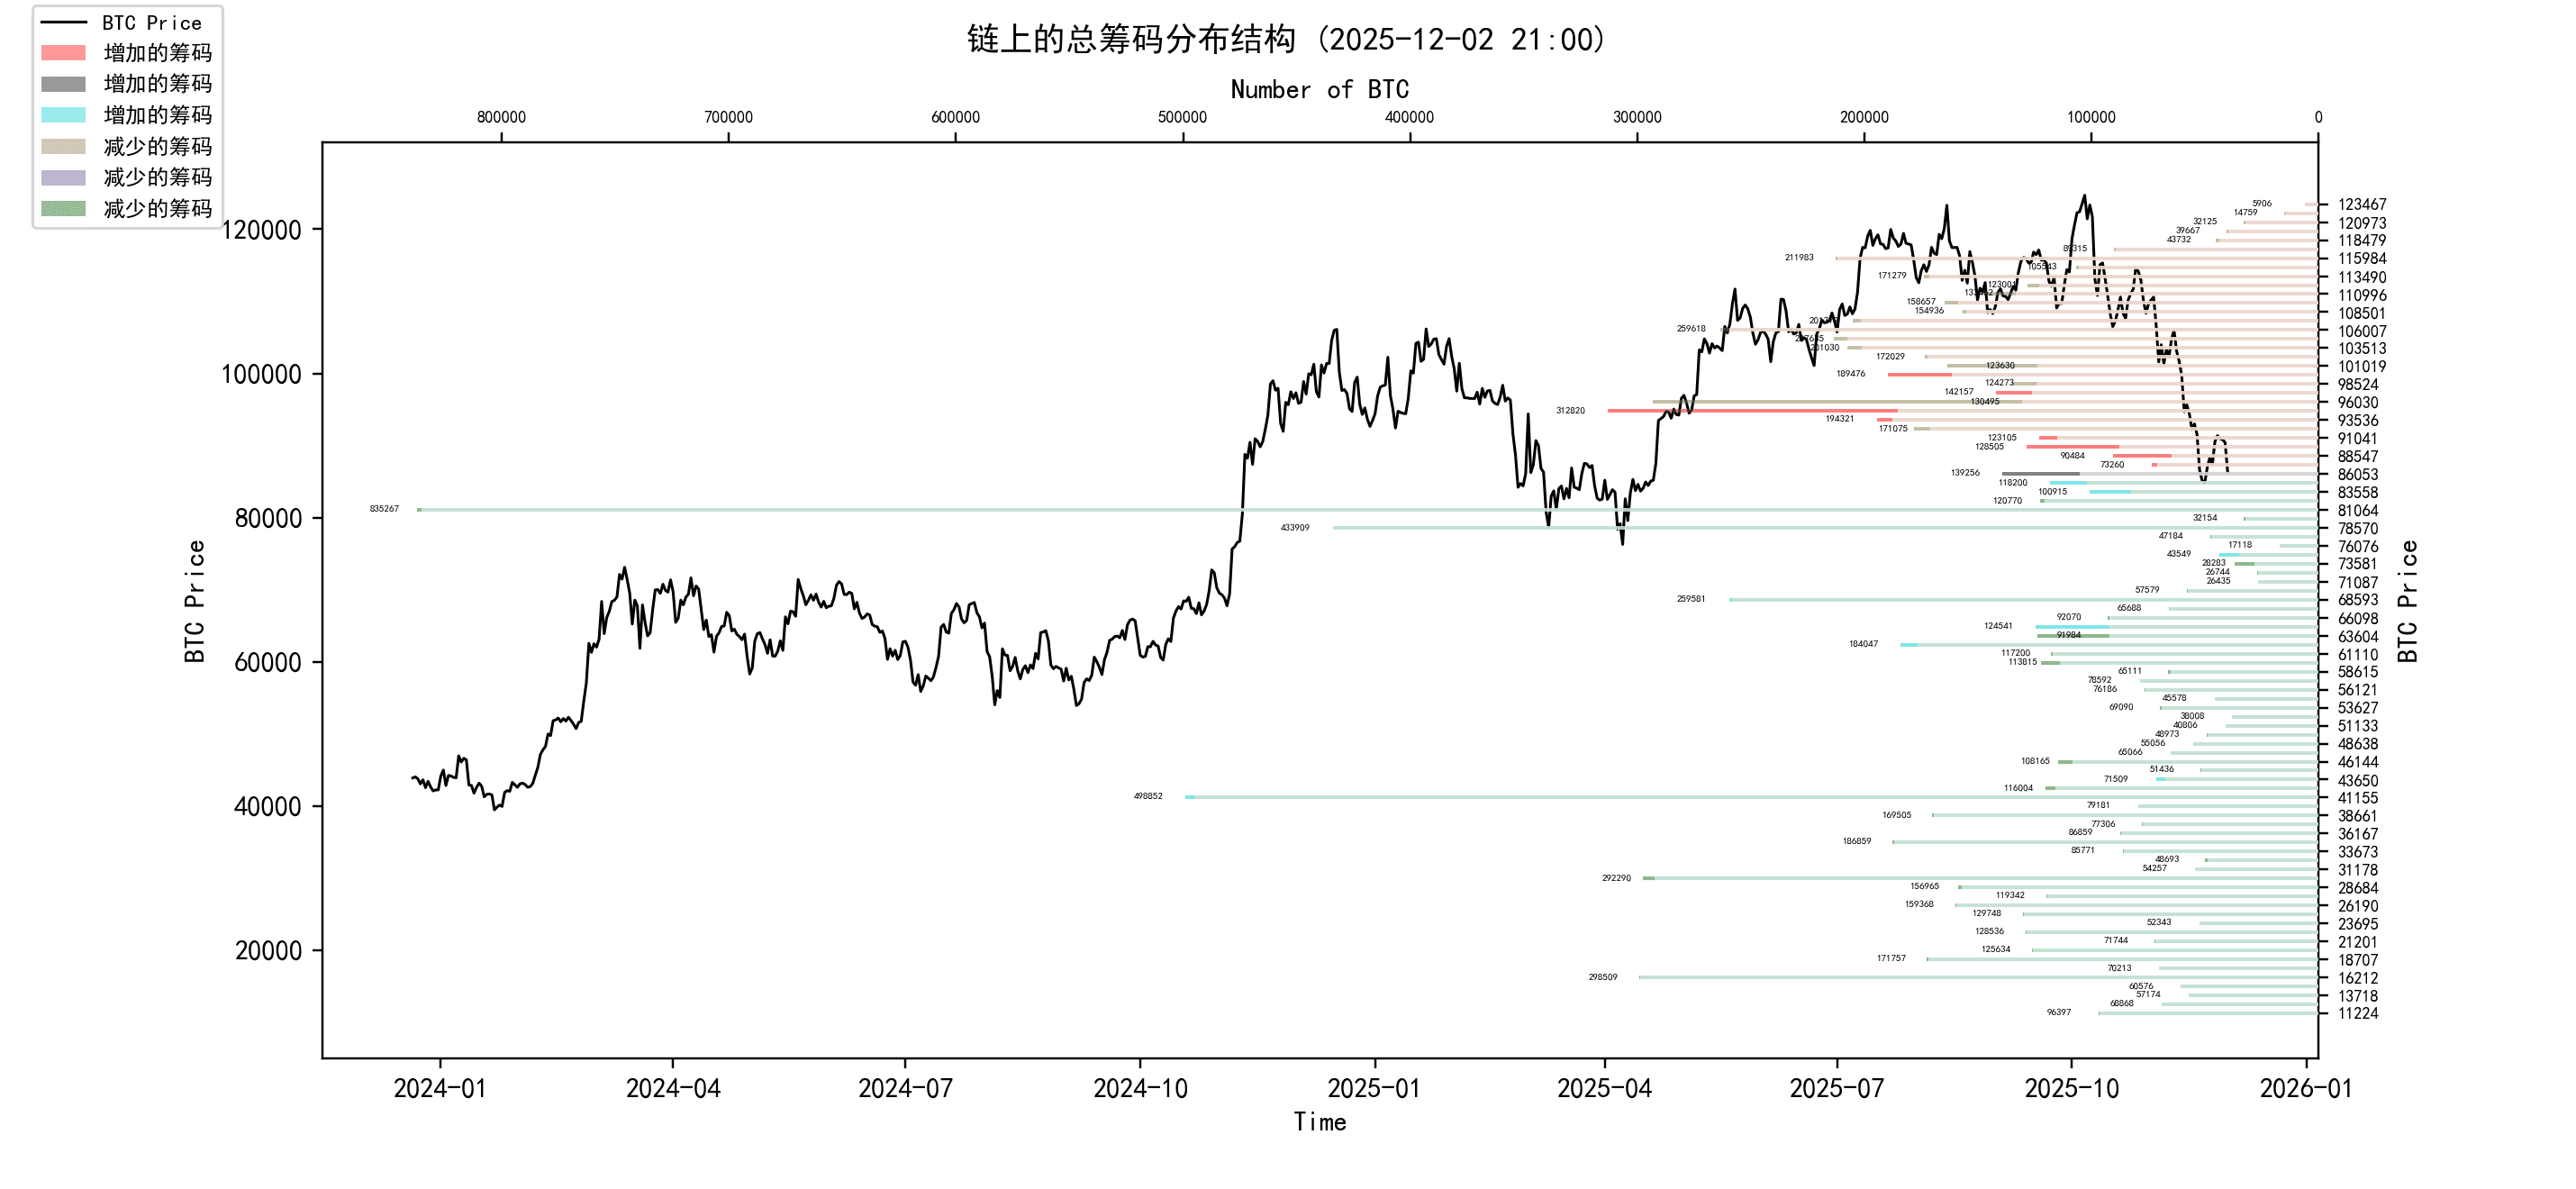
analyze:
60,000-68,000, approximately 929,000 pieces;
76,000-89,000, approximately 1.97 million pieces;
90,000-100,000, approximately 1.51 million pieces;
Over 100,000: approximately 2.419 million pieces;
Important news
Economic news
Market performance and absence of "Christmas rally":
U.S. stock indexes fell on Monday: the Nasdaq fell 0.1% and the S&P 500 fell 0.13%.
Precious metals rose: gold rose 0.48% to $4,239 per ounce (Note: the original data is as stated, and may refer to a specific contract), while silver rose 3.8% to a new high of $58.55 per ounce.
Market Status: The "Christmas rally" that Wall Street usually expects has not yet materialized, and market volatility is high.
Bank of Japan (BOJ) actions:
Governor Kazuo Ueda hinted at a hawkish stance, stating that if economic activity and price forecasts materialize as expected, policy interest rates will continue to rise.
Market expectation: There is a 76% probability of an interest rate hike at the December 19 meeting.
Impact: The yen appreciated by 0.4% against the dollar to 155.49 at one point; the dollar and highly volatile assets (including cryptocurrencies) came under pressure.
Federal Reserve (Fed) personnel and policies:
Federal Reserve Chair Nomination: Trump is about to announce his choice. Kevin Hassett, director of the White House Economic Council, has emerged as the frontrunner, with Kalshi data showing his probability of being elected rising from 55% to 78%, putting him ahead of other contenders. If he takes office, he may implement loose stimulus policies.
December rate cut expectation: Goldman Sachs believes that a December rate cut is a foregone conclusion, with market pricing indicating an 85% probability of a rate cut based on a weak labor market and risk management needs.
Meeting time: The next interest rate meeting is scheduled for December 10 (date mentioned in the original text).
Global liquidity expectations:
Global growth is expected to accelerate from here onward, with the growth momentum projected to continue until 2026, and the macroeconomic environment will be similar to that of 2020.
Crypto ecosystem messaging
Regulation and Adoption in the Integration of Traditional Finance:
The IMF (International Monetary Fund) warns that while tokenization markets can reduce costs and increase speed, they also bring increased market volatility and the risk of flash crashes, potentially triggering a chain reaction. Regulation will play a more active role in this area.
Nasdaq: Submitted a rule change proposal to the SEC seeking to support tokenized U.S. stocks and ETFs on its main board. Matt Savarese, head of digital asset strategy at Nasdaq, stated that SEC approval is a top priority.
Stablecoin Updates:
Wyoming: The Stablecoin Council has launched a testnet for the stablecoin Frontier Stable Token (FRNT).
Bank of America & Stellar: Bank of America is testing stablecoins on Stellar (SDF).
Circle (USDC): Since October 11, Circle has issued $1 billion worth of stablecoins on Solana.
Total Market Cap: The total market capitalization of stablecoins recovered to $305.578 billion in the past week, an increase of 0.8%.
Institutional Investment and ETFs:
BlackRock: Its BTC spot ETF (IBIT) saw a net outflow of $2.34 billion in November (with the largest outflows on November 14th and 18th). Head of Business Cristiano Castro stated that this was normal profit-taking and that he remains confident in the long-term outlook.
Holdings data: Total holdings of US spot BTC ETFs reached 1.321 million BTC, accounting for 6.62% of the current BTC supply, worth approximately $110 billion.
South Korean company Dunamu: Announced holding approximately 2081.8 BTC.
VC Investment: By 2025, investment institutions had invested nearly $25 billion in crypto companies, exceeding last year's figure by 150%.
Market Analysis:
Price performance:
November was dismal: BTC fell 17.67% and ETH fell 22.38%, both the worst performances since 2018.
Historical data: The average increase for BTC in December is 4.13%, and for ETH it is 5.72%.
Recent volatility: On Monday, BTC fell 6.9% and ETH fell 9.6% during the session.
Coinbase Premium: On November 30, the BTC premium index on Coinbase returned to a positive value (0.0255%) after 29 consecutive days of negative premium.
Analyst's opinion:
Cointelegraph: The market may be forming a short-term bottom, providing a basis for a rebound in BTC towards $100,000-$110,000.
Arthur Hayes (Founder of BitMEX): The BTC crash was caused by the Bank of Japan's hints at an interest rate hike. However, he predicts that the bottoming out of dollar liquidity, coupled with the end of the Federal Reserve's quantitative tightening (QT), will drive the next phase of BTC's rise.
André Dragosch: The current macroeconomic environment for BTC is similar to that of 2020, and the current price seems inconsistent with the future macroeconomic outlook, so there may be a lot of room for growth.
Ethereum Updates:
Bitmine-affiliated addresses have increased their holdings by 16,693 ETH, worth $50.1 million.
Long-term insights: used to observe our long-term situation; bull market/bear market/structural change/neutral state.
Mid-term exploration: Used to analyze what stage we are currently in, how long this stage will last, and what situations we will face.
Short-term observation: used to analyze short-term market conditions; and the probability of certain directions emerging and certain events occurring under certain conditions.
Long-term insight
Non-flowing long-term giant whale
Total selling pressure in on-chain spot market
ETF Net Positions and Attitudes
Structure of long-term holders (over six months)
Large net transfers from exchanges
Short-term speculator cost line
Non-flowing long-term giant whale
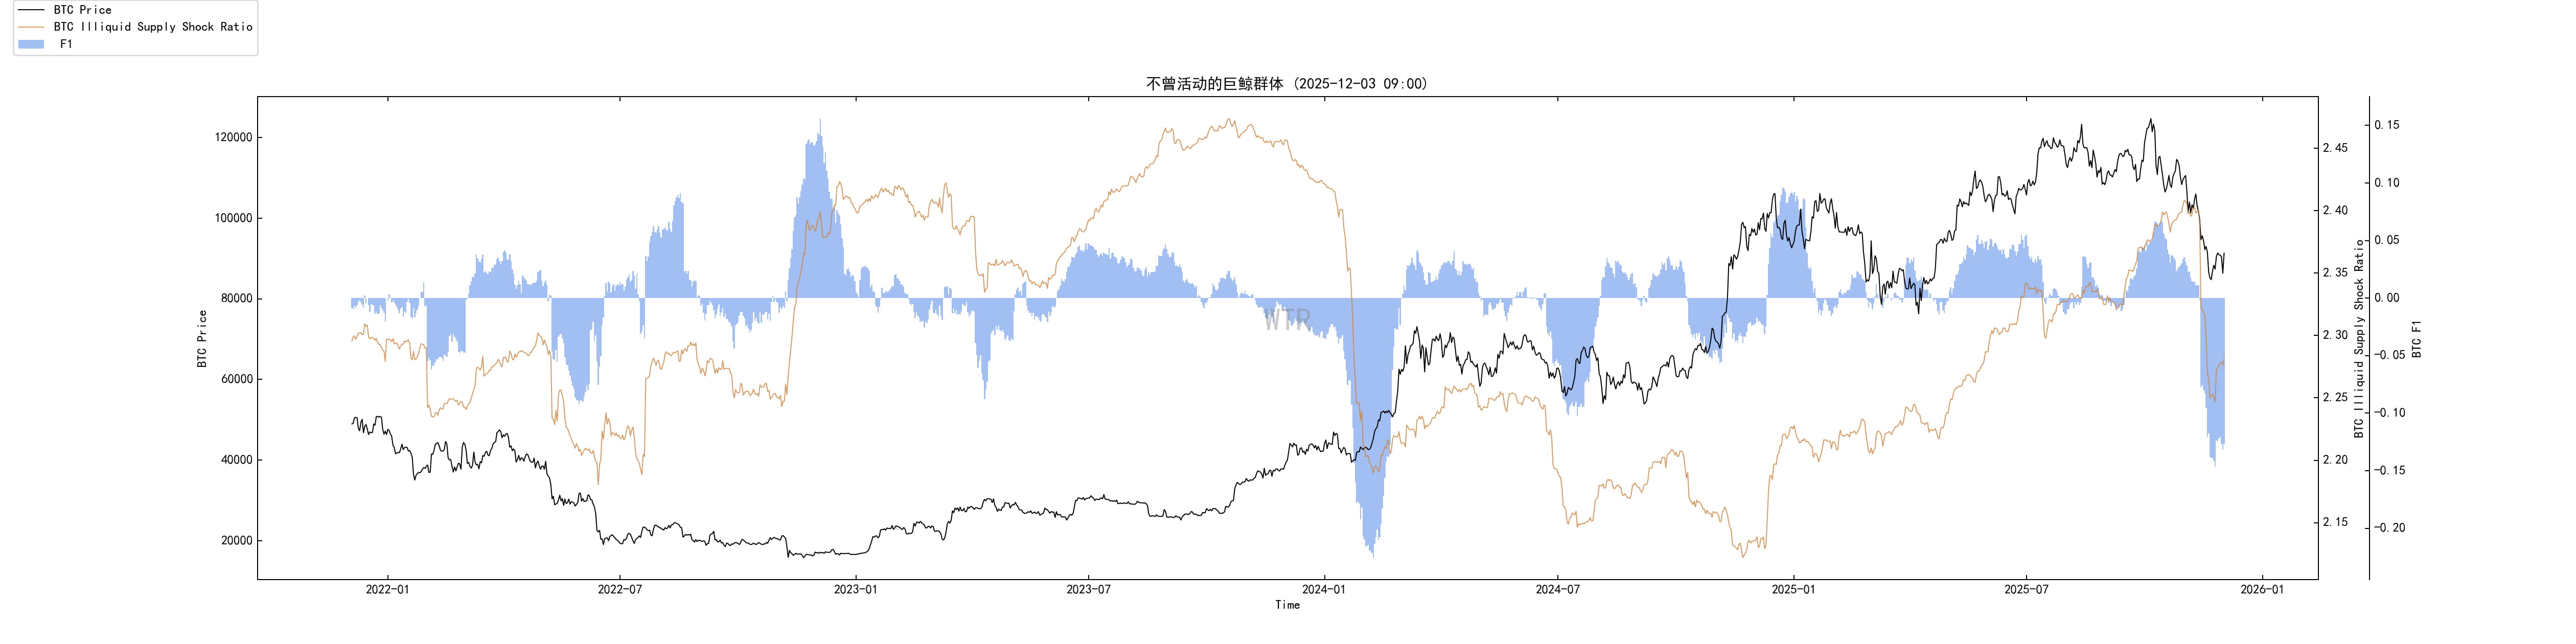
Previously, long-term whales considered areas below 108,000 as reasonable buying zones and rebounds above 112,000 as selling opportunities.
After the sharp drop, the 80,000-90,000 range was once again regarded as a buyback area for medium- to long-term holdings.
Their actions didn't resemble fleeing at the top; rather, they orchestrated a rebalancing process of reducing positions at high levels and buying back at lower levels.
Total selling pressure in on-chain spot market
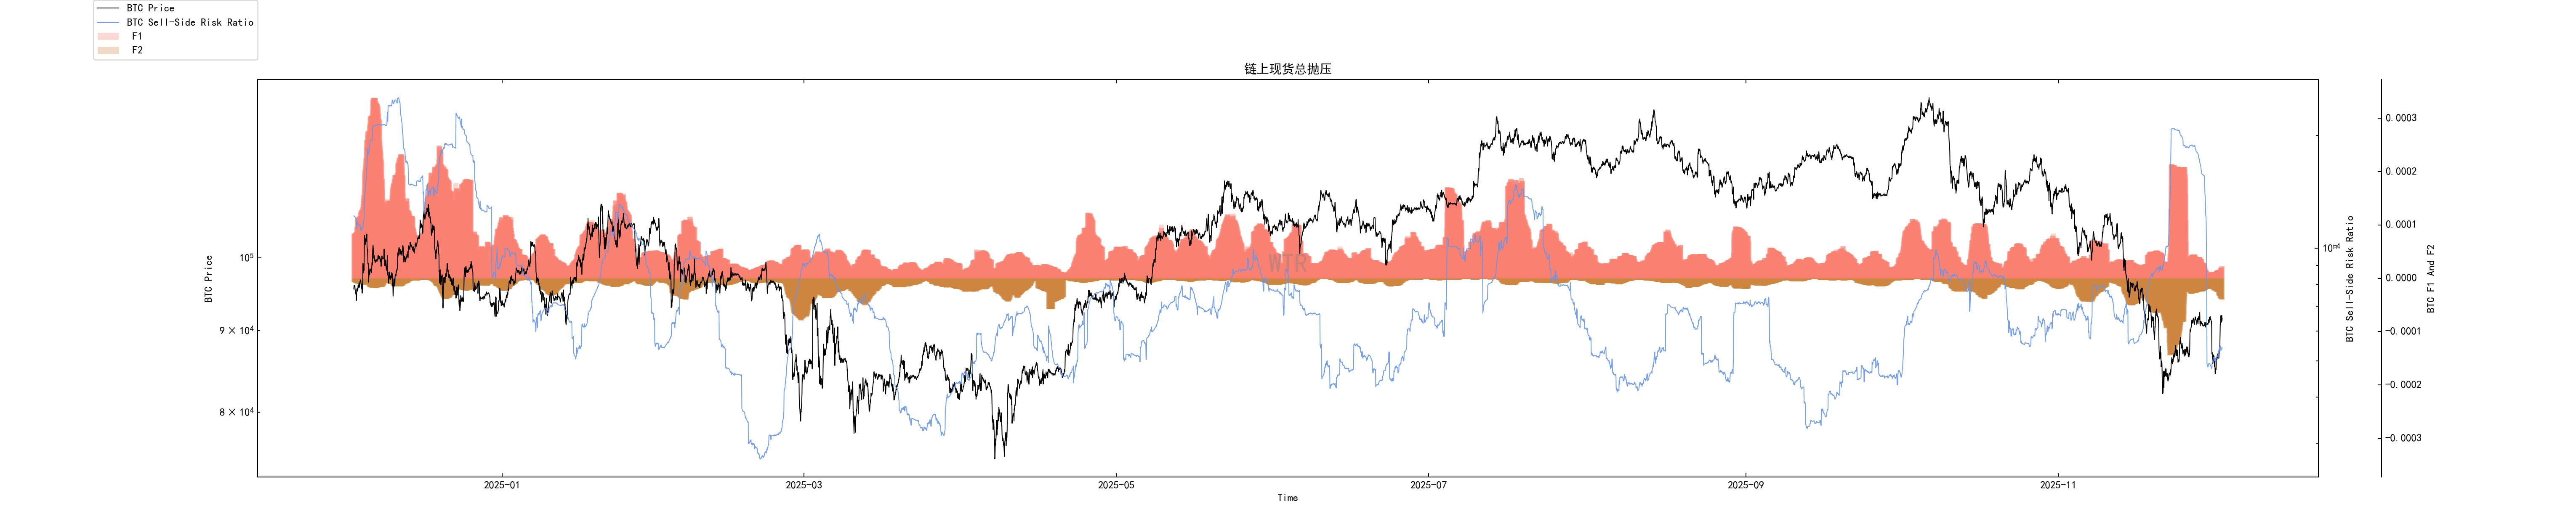
After rebounding from 80,600 to 92,500, the selling pressure indicator has clearly declined and is moving towards the lower-middle range.
Those willing to sell have mostly sold, and what remains are mostly holders who are unwilling to relinquish their shares at this position.
The sharp drop was the peak of selling pressure; now it's in a period of fatigue.
This doesn't automatically mean a surge is imminent, but it does mean that it will be significantly more difficult to drive the price down below 80,000 by actively selling spot goods.
ETF Net Positions and Attitudes
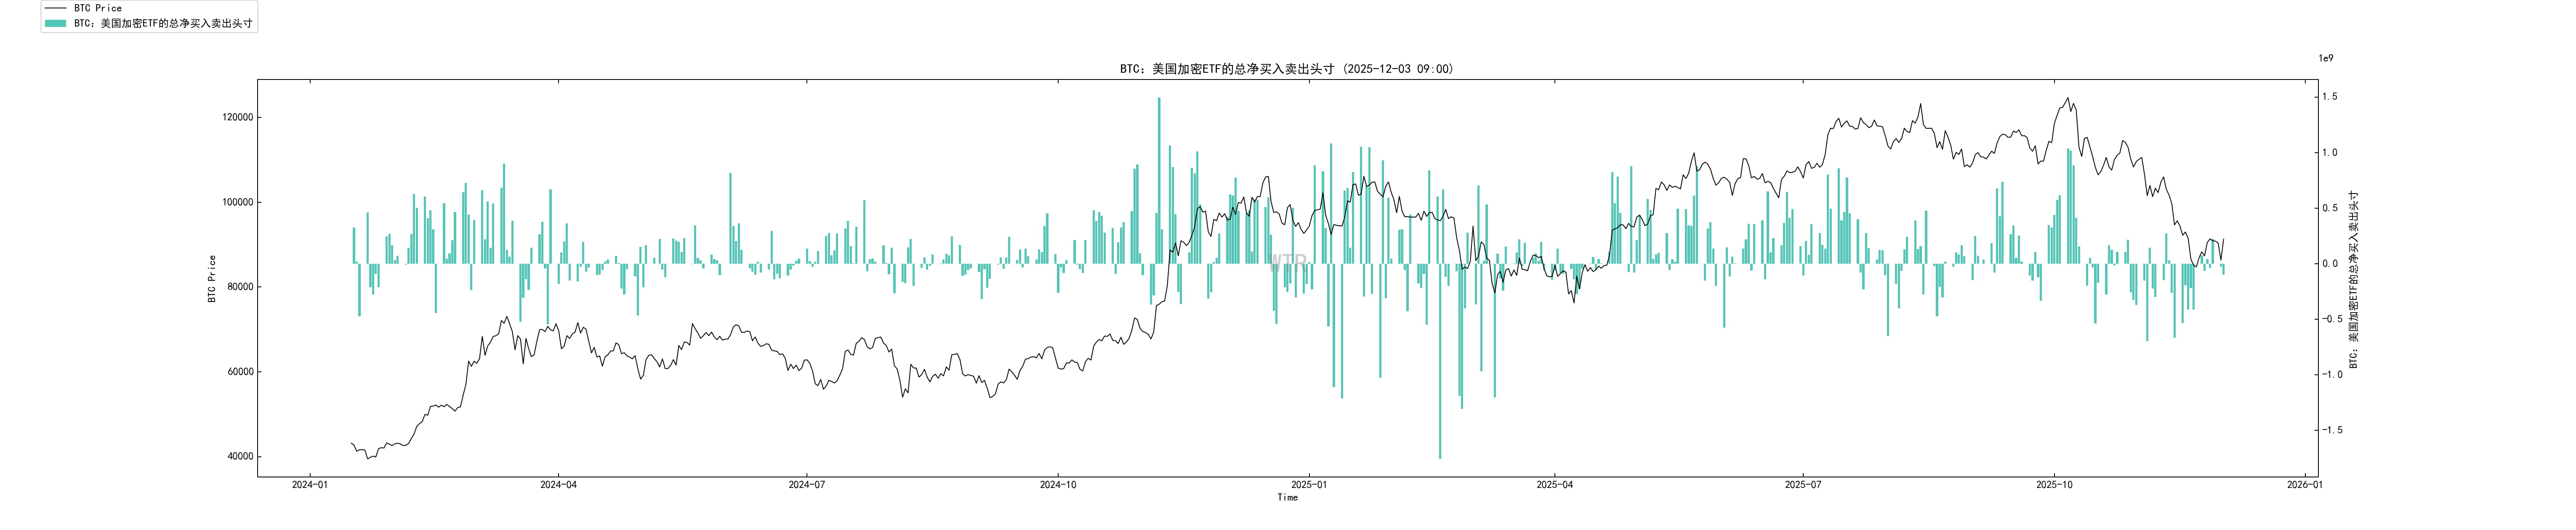
Prior to the drop from 91,000 to 80,600, ETF reserves experienced a continuous net outflow.
This corresponds to the systemic redemption of several billion dollars in November; it involves both profit-taking and macro risk management.
After the sharp drop, although the price fluctuated between 8.6 → 9.1 → 8.4 → 9.2, the outflow of ETFs slowed down significantly, and there were no more sustained large redemption waves.
ETFs have shifted from aggressively reducing their holdings to a cautious wait-and-see approach, neither rushing to cut losses nor buying new ones.
This large amount of capital did not panic and withdraw at the low point, but it also did not immediately step in to take over the shares.
Until macroeconomic and policy signals become fully clear, ETFs are more like bystanders than leading buyers.
Structure of long-term holders (over six months)

Currently, the proportion of chips held for more than six months is approximately 0.47, a slight decrease from 0.527 two months ago, but still within the historically high range.
The extreme low of 0.418 caused by the Coinbase address consolidation was clearly technical noise. It then returned to 0.431 a week later, then went down to around 0.455, and after smoothing out, it still hovers around 0.47.
From a hierarchical perspective, the long-term holdings across different time periods remain substantial overall, without exhibiting the top-end characteristics of large-scale spending of old coins and a collapse of long-term holdings.
This round of decline has only released a small portion of the profits from long-term investors; it's far from warranting a large-scale withdrawal.
Nearly half of the hard supply on the chain is still locked up, which is the most important background condition in this round of adjustment.
Large net transfers from exchanges
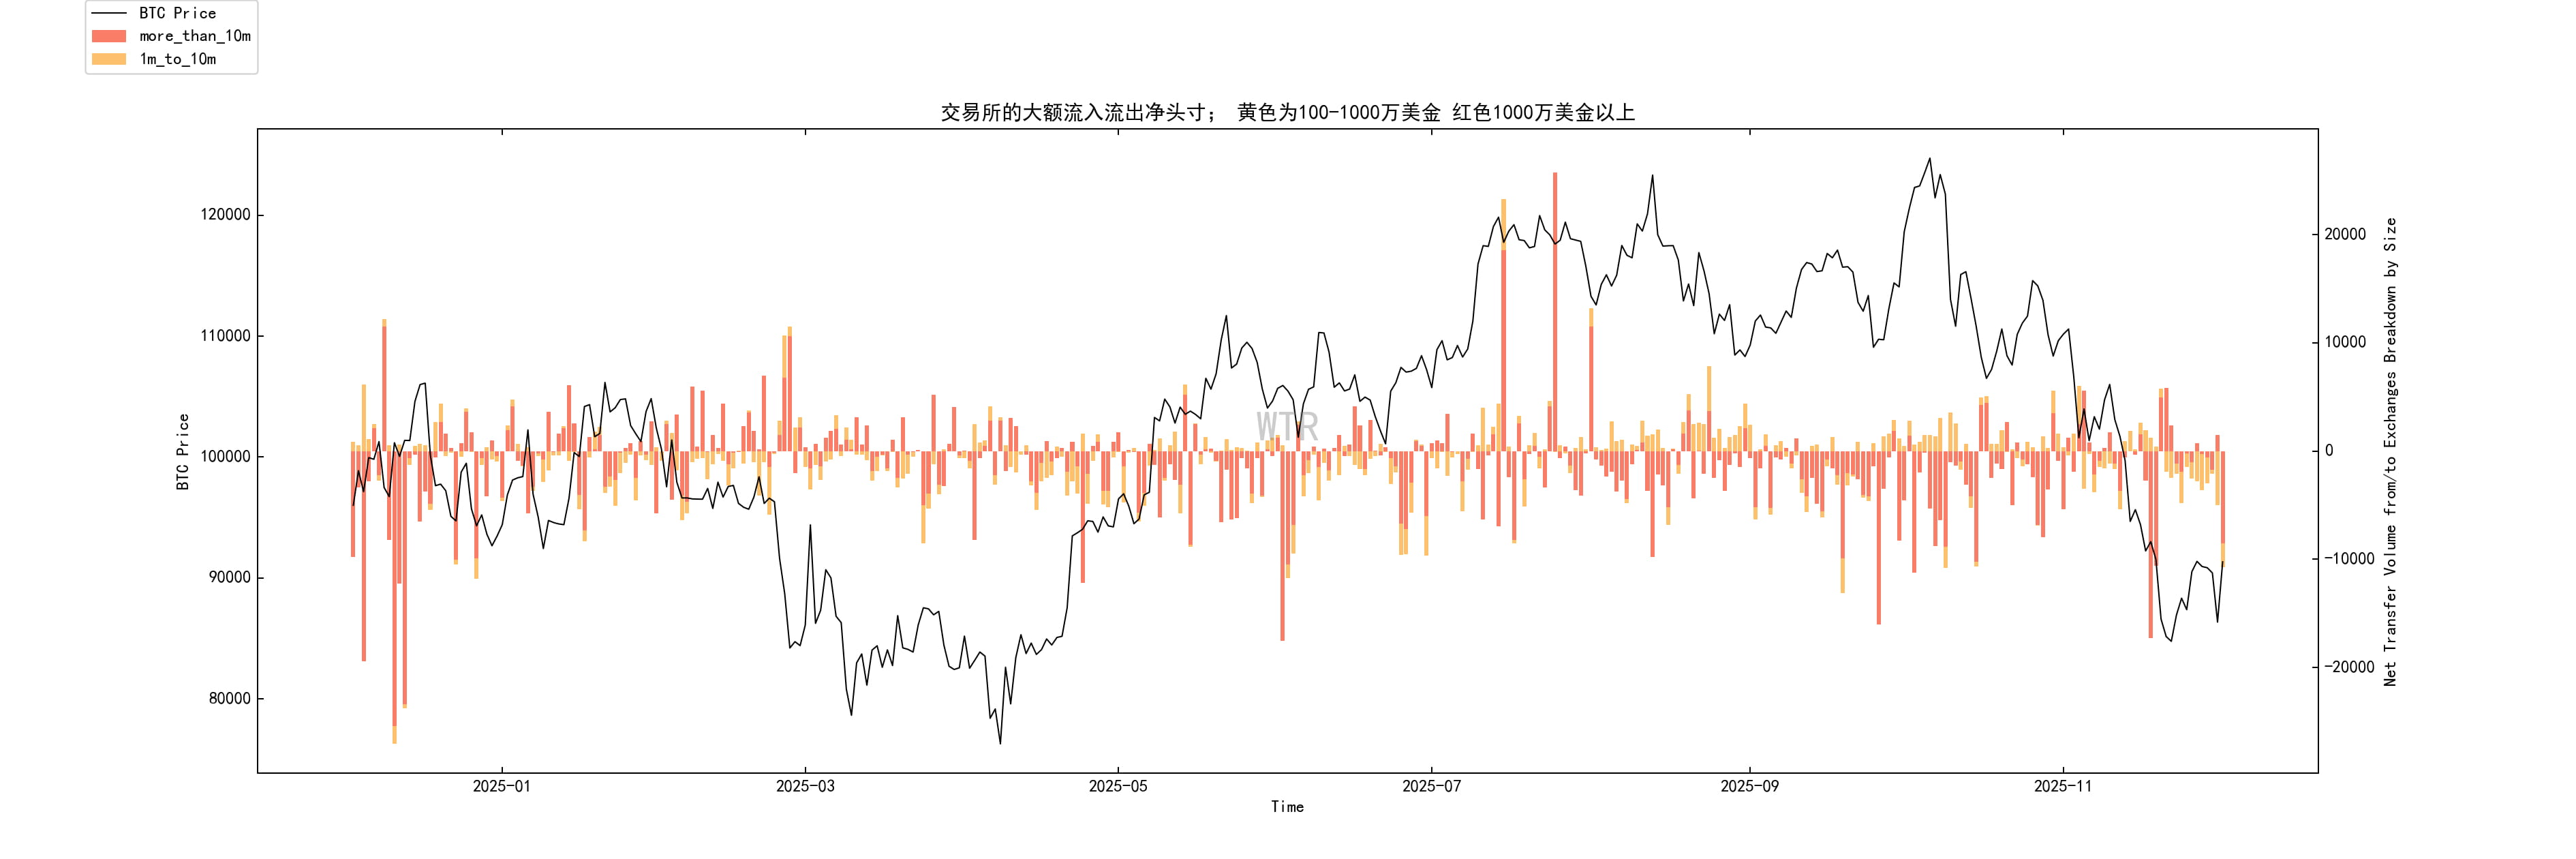
When the price just fell below 90,000 and continued to decline, there was a significant increase in large net outflows: whales withdrew their shares from the exchange, a typical buy-and-hold action.
When it fell to around 88,000, a significant net inflow occurred:
At that moment, a group of whales panicked and sold their shares back on the exchange, fueling the accelerated decline from 88,000 to 80,600.
After reaching 80,600, the price rebounded to around 84,000, with a significant decrease in net inflows, indicating that whales were no longer dumping their holdings into the exchange.
With the price fluctuating between 86,000 and 88,000, we are seeing cautious withdrawals; there is an intention to accumulate tokens in this range, but no aggressive moves.
After surging to 90,000-93,000, it fell back to 84,000, and withdrawals increased significantly again.
This indicates that a group of large investors viewed this pullback as a buying opportunity and once again took their shares from the exchange.
The overall structure is very similar to:
Tactical whales actively engage in the game between 80,000 and 90,000:
Below 86,000–88,000, the focus is more on receiving goods and withdrawing currency;
The drop below 88,000 was a concentrated sell-off;
After reaching around 84,000, selling pressure weakened, while buying interest gradually returned.
This group of people are not long-term locked-in whales, but they are the real operators of short-term trends.
Their current positioning is more inclined to defend the lower edge of this range rather than abandon the battlefield.
Short-term speculator cost line
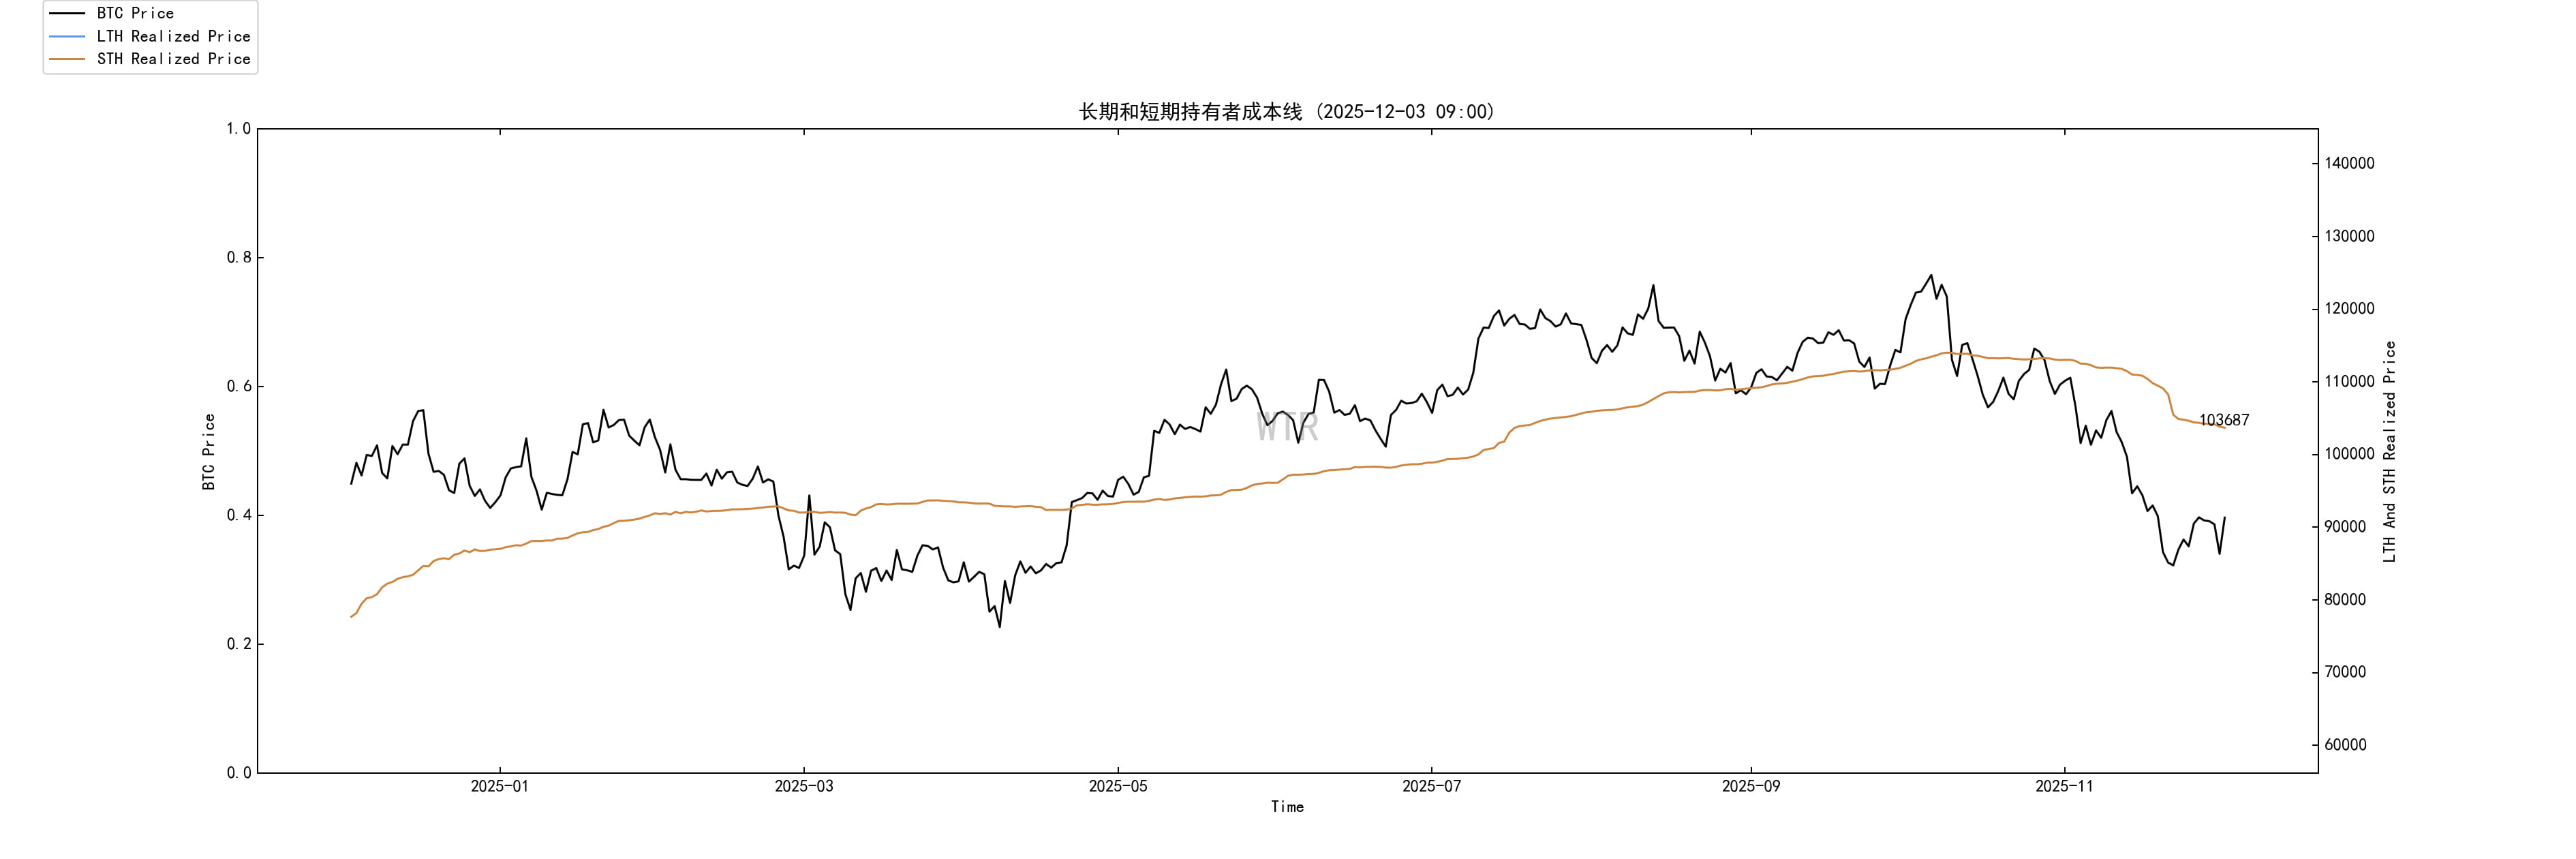
Three weeks ago, the cost line for short-term holders was around $111,968, it dropped to $109,821 two weeks ago, and has now fallen further to $103,687.
The price plummeted to a low of 80,600, and has since rebounded to over 92,000, still far below the average cost of 103,000.
This means:
At this moment, short-term players on the blockchain are generally in a state of floating loss. Those who are still holding coins either have strong resilience to price drops or have reduced their leverage and positions to a relatively safe level.
Historically, in most cases, when prices fall sharply below the short-term cost + cost line and begin to flatten or decline, it is either a mid-stage reshuffling in a bull market or the first leg of a bear market has just been kicked out.
Based on the previous charts, we can rule out the version of a collective withdrawal of long-term capital on the blockchain. Therefore, it is more like the former: a systematic cleanup of short-term funds after an overly aggressive market.
Overall Analysis: The Connection Between On-Chain Structure and Macro Game Theory
If you consider these six lines on the chain in conjunction with the external environment, it's not complicated:
Macro level
The Bank of Japan is preparing to raise interest rates, forcing the yen carry to contract;
The Federal Reserve is being pressured to cut interest rates while being constrained by political factors and inflation data.
Real interest rates are being repriced upwards by the market in the short term.
For highly volatile assets, this combination means first drastically reducing valuations before discussing growth.
Traditional financial behavior
The large-scale profit-taking in spot ETFs at high levels became the primary driving force behind this round of sharp declines;
When the price dropped to just over 80,000, these funds chose to stop instead of continuing to push the price down further. This suggests that it was more of a risk management move than a decision to exit the market permanently after misjudging the sector.
On-chain internal redistribution
Long-term non-mobile whales consume goods below 108,000, distribute goods above 100,000, and re-absorb goods below 90,000;
The proportion of shares held for more than six months is still around 0.47%, releasing only a small portion of profits, and there has been no systemic exodus.
Tactical whales actively manipulated prices in the 80,000-90,000 range. After a concentrated sell-off at 88,000, they bought back coins at lower prices.
Short-term speculators were hit with overall unrealized losses, and the cost line continued to fall, completing the turnover.
Changes in the pressure-reducing structure
The peak selling pressure during the crash phase corresponds to the combined effects of ETF position reductions, leveraged margin calls, and a sell-off driven by market sentiment.
The current selling pressure has fallen to a neutral to lower level: the most active sellers have already sold out, and what remains are those who are asking for higher prices and have more patience.
To sum it up in one sentence:
This was a liquidation resulting from an external interest rate shock, institutional risk management, and excessive on-chain leverage.
The long-term shareholding structure is basically intact; the problem lies in the pricing power of short-term funds and the pace of ETFs.
This differs from the top distribution of a classic cycle:
Top allocation typically involves a significant outflow of long-term holdings over several months, persistently high selling pressure, and each rebound being met with a sharp drop from older coins.
What we see now is:
After moderately reducing their holdings, long-term investors buy back at lower prices, and the price falls rapidly after the peak of selling pressure.
Outlook: Short-term and Medium-to-Long-term
The short-term situation can be summarized in three words: high volatility, range-bound trading, and policy-driven.
Price level:
The 80,000-82,000 range is the bottom testing zone that has been confirmed by on-chain data, whales, and market sentiment after this round of liquidations.
The 90,000-100,000 range is currently the main area of trading volume and is also the area that ETF risk control departments are monitoring most closely.
In the absence of new macroeconomic black swan events, this range is more likely to be pulled back and forth rather than broken in one go.
Participant behavior:
Long-term whales have shown a clear preference for adding to their positions below 90,000, not chasing prices but willing to take advantage of panic selling.
Exchange tactical whales repeatedly use large withdrawals/transfers in the 84,000–88,000 range to manipulate prices, and will continue to dominate local fluctuations in the short term.
ETF funds are currently in a wait-and-see mode.
Before FOMC and BOJ meetings, no directional large positions will be given easily.
Trigger point:
If the Federal Reserve adopts a dovish stance at its next meeting (confirming the pace of interest rate cuts and emphasizing risk management), ETF funds may shift from reducing positions and remaining on the sidelines to tentatively buying back in.
The upper limit of 90,000–100,000 will then be retested very soon.
If tightening measures are implemented further beyond expectations and US data is unexpectedly strong, a short-term pullback to around 80,000 is possible. However, given the current on-chain selling pressure and whale behavior, that pullback is more like giving long-term funds another chance to accumulate shares, rather than triggering a sustained bear market.
To put it simply:
In the short term, there is a high-volatility trading opportunity window of 80,000 to 100,000, dominated not by retail investors, but by ETF risk control, whale tactical trading, and institutions most sensitive to macroeconomics.
There are two categories of things to look at in the medium to long term:
Liquidity path and institutionalization process.
Liquidity path
The global economy has not entered a recession; rather, it has slowed down slightly but remained stable.
Inflation is declining from its high level, but it is still far from the central bank's target;
The real pressure comes from sovereign debt and politics; there is little tolerance for interest rates remaining high for an extended period.
In this environment, long-term equilibrium is closer to:
Nominal interest rates are declining slowly, real interest rates remain low, and moderate inflation is becoming the norm.
This is a slow-burn benefit for any scarce asset.
Institutionalization process
Nasdaq is promoting tokenized securities, the European Banking Union is developing a euro stablecoin, and US state governments and commercial banks are issuing their own stablecoins on-chain.
While warning of risks, the IMF and other regulators are gradually incorporating tokenization and stablecoins into their regulatory framework.
This means:
Assets like rock sugar oranges and Ethereum are transforming from outsiders' toys into fundamental collateral and reserve assets for the next generation of financial infrastructure.
After this step is completed, the magnitude of price fluctuations may no longer be as drastic as in the early stages, but the valuation base will be more stable.
The medium- to long-term implications of this market trend
This sharp drop from 125,000 to 80,000 is more of a stress test under the new institutional environment.
How will ETFs react? How will central banks respond under political pressure? How will whales adjust their portfolios under the new rules?
Judging from the current on-chain structure, long-term holders have not been scared away; on the contrary, they are rebuilding at lower prices.
As long as real interest rates enter a slow downward trend in 2025–2026,
After this round of reshuffling, the story of Bitcoin as "institutionalized digital gold" has not been broken; it has simply transitioned from a period of unchecked growth to a more mature stage characterized by regulation, cycles, and caps.
The medium- to long-term expectations are:
The era of explosive, one-sided bull markets may be fading, replaced by:
Macroeconomic factors drive multiple rounds of large-scale range-bound trading combined with a slow bull market.
In this structure, the real money is made by long-term funds that can understand the macro rhythm and keep up with institutional position rotation, rather than by short-term leveraged traders who chase high prices and hope to get rich quick.
Mid-term exploration
Incremental model
USDC Purchasing Power Overall Score
Whale Overall Score
Cost structure at each price point
BTC Exchange Trend Net Positions
(See the diagram below for the incremental model)
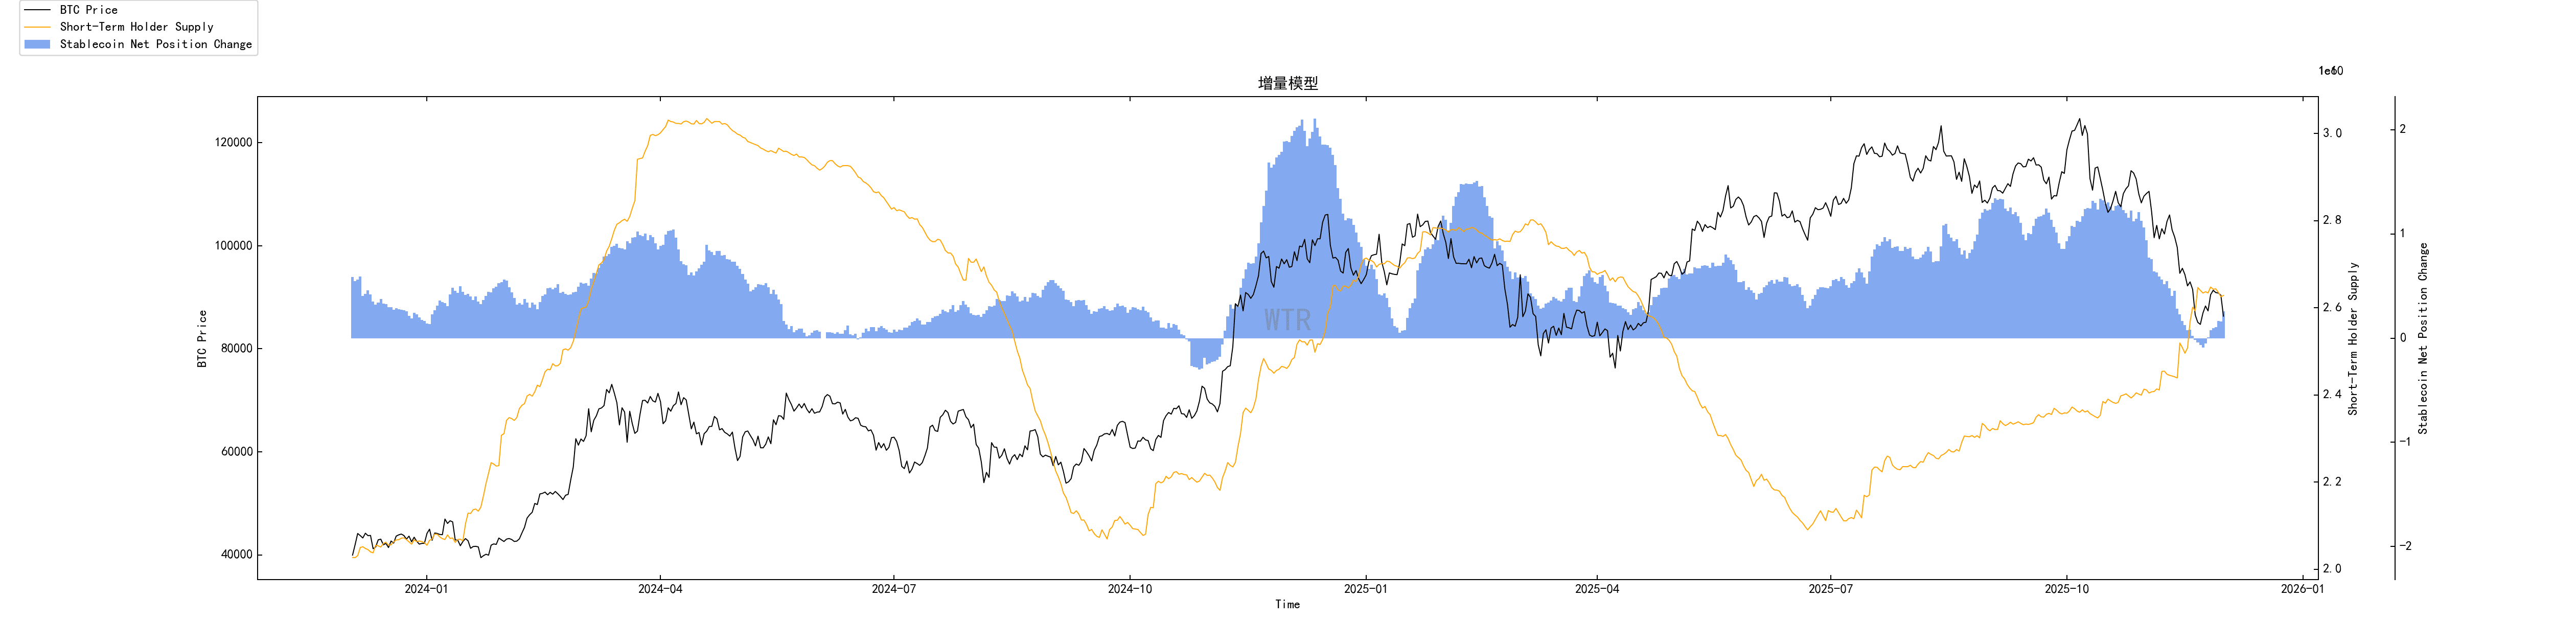
The market is currently experiencing increased inflows, which may be a sign of recovery. Having shaken off the previous pressure from sluggish investor sentiment, the market is showing some signs of a slow, gradual recovery.
(See the chart below for USDC purchasing power score)
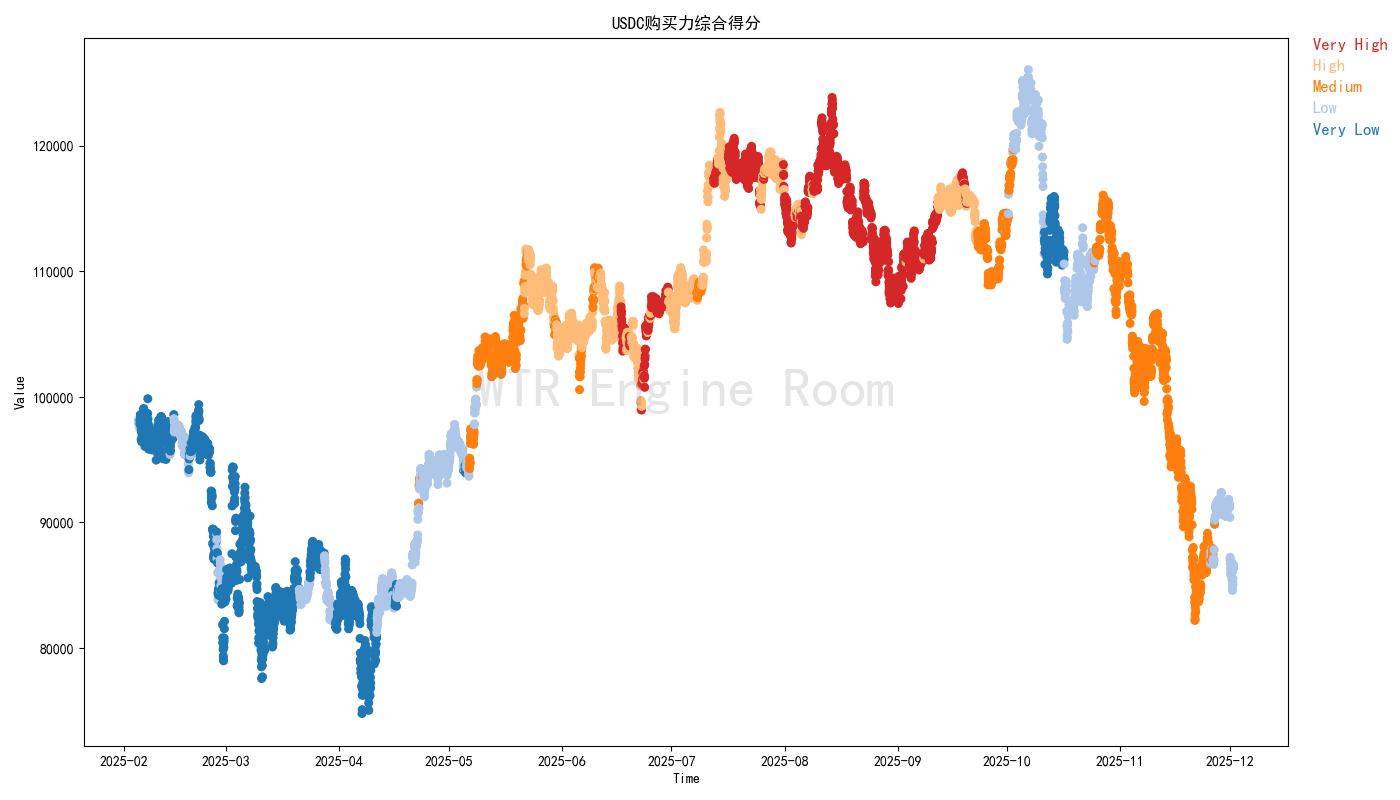
USDC holders remain very patient, hastily selling off their holdings after the market rebounded.
(See the image below for the whale's overall score)
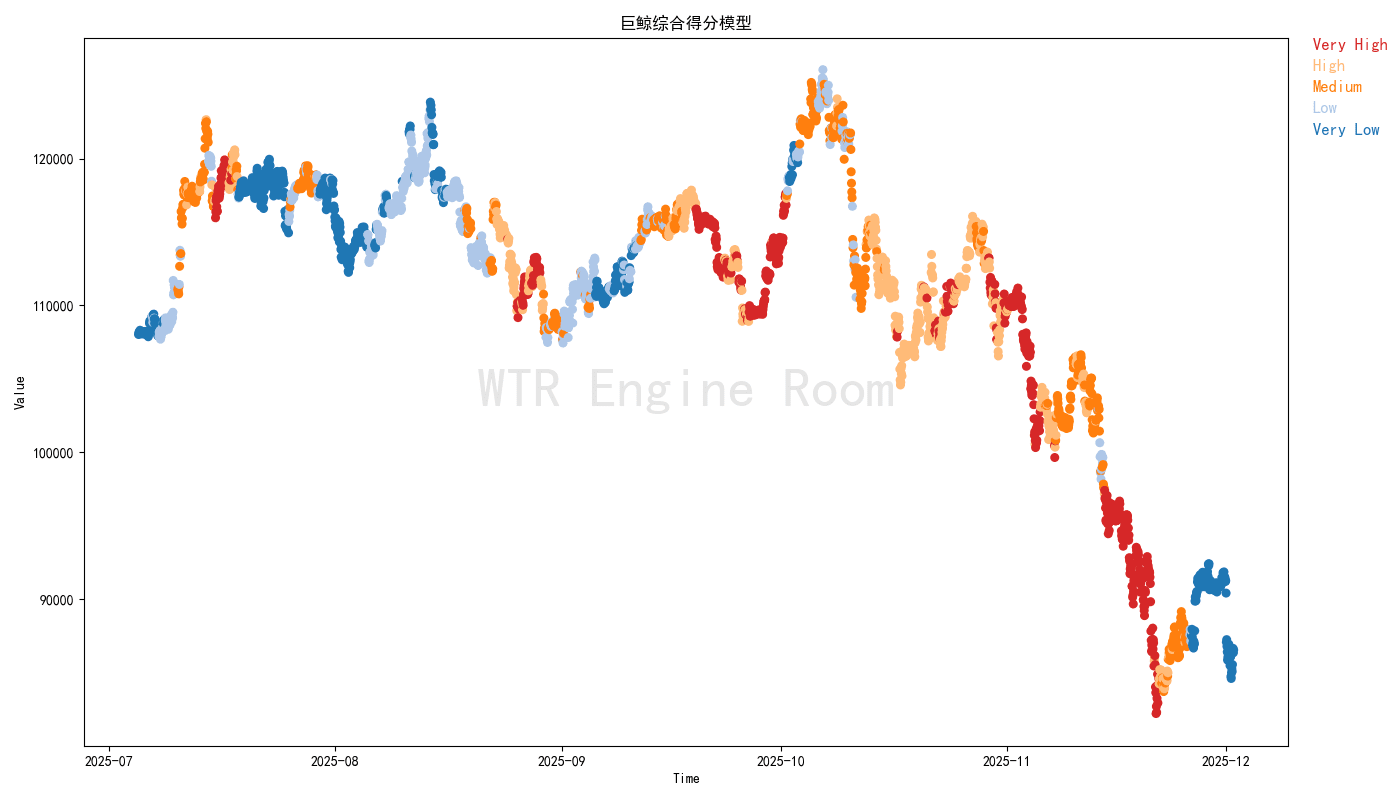
The whale only provided bottom support, having previously absorbed a lot of losing shares. It maintained its buying momentum as the market accelerated its decline, but then sold off its shares after the market rebounded.
(See diagram below for cost structure analysis)

The current short-term cost line in the market is around 103,000, and most short-term participants are still in a loss-making state. From a time perspective, given the current market atmosphere and environment, it will still take time to digest the losses.
(See chart below for BTC exchange trend net positions)
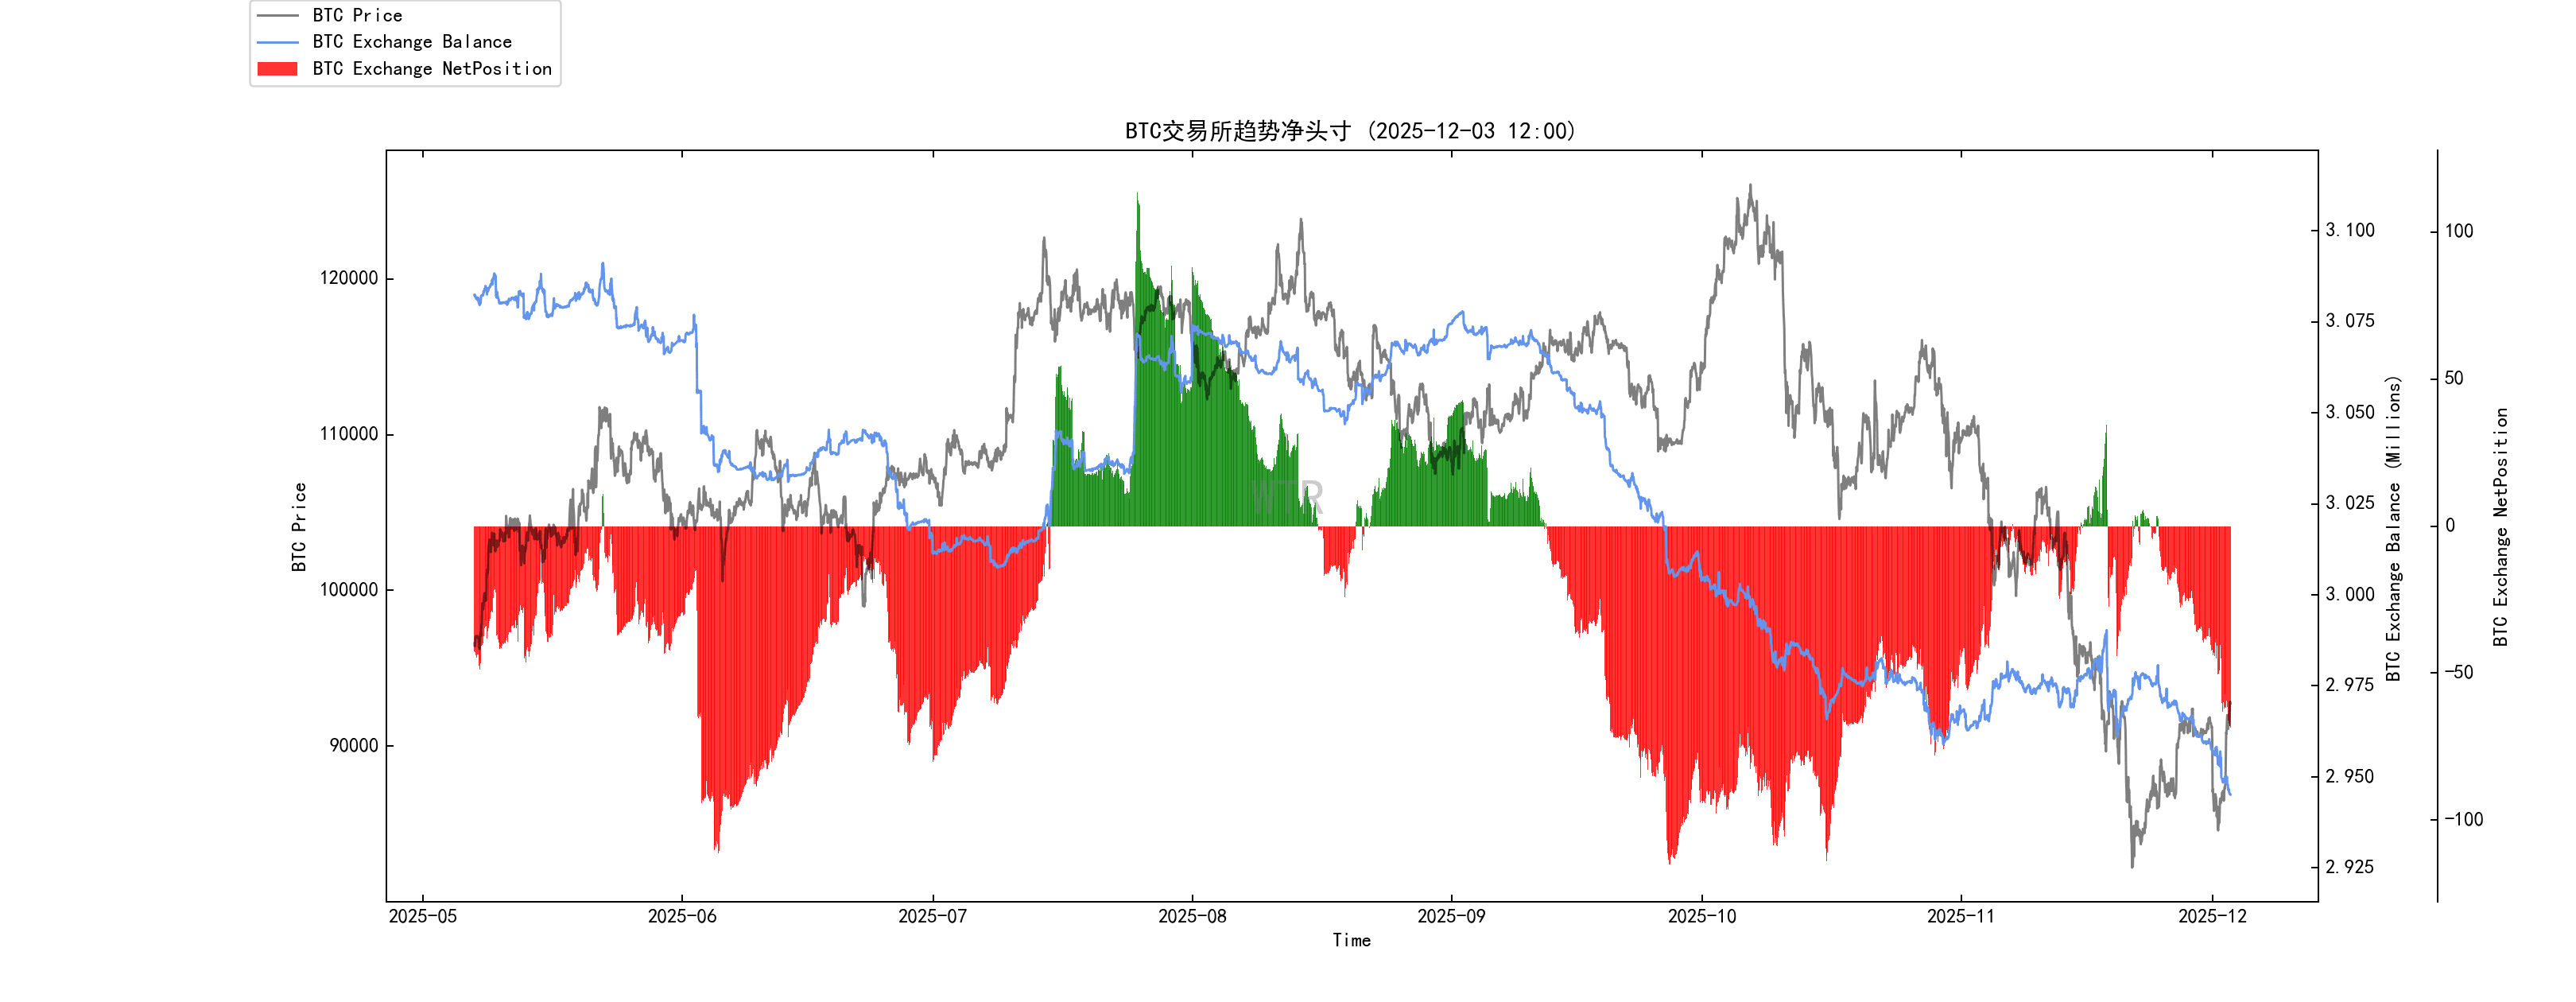
Exchanges have resumed their outflow pace, and the accumulation rate of chips within the market is also steadily increasing.
Short-term observation
Derivatives risk coefficient
Option Intention to Transaction Ratio
Derivatives trading volume
Implied volatility of options
Profit and loss transfer
New addresses and active addresses
Rock Sugar Orange Exchange Net Position
Net Positions on Ethernet Exchange
High-weight selling pressure
Global Purchasing Power Status
Net Positions on Stablecoin Exchanges
Derivatives rating: The risk level is close to the red zone, indicating increased risk in derivatives.
(See chart below for derivatives risk coefficients)
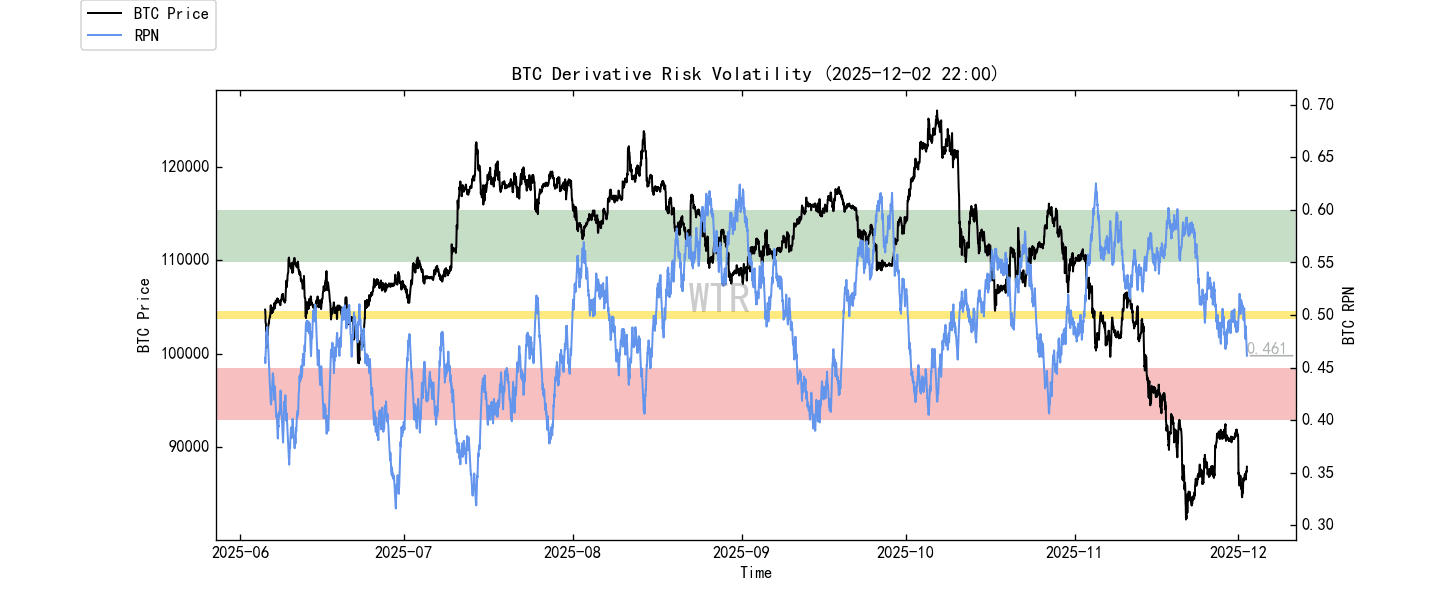
The market saw a weak rebound after bottoming out last week, and the risk factor is now approaching the red zone again, with the risk of long positions being liquidated increasing. This week, the market is expected to be in a slight decline or fluctuating mode.
(See chart below for option intention-to-execution ratio)
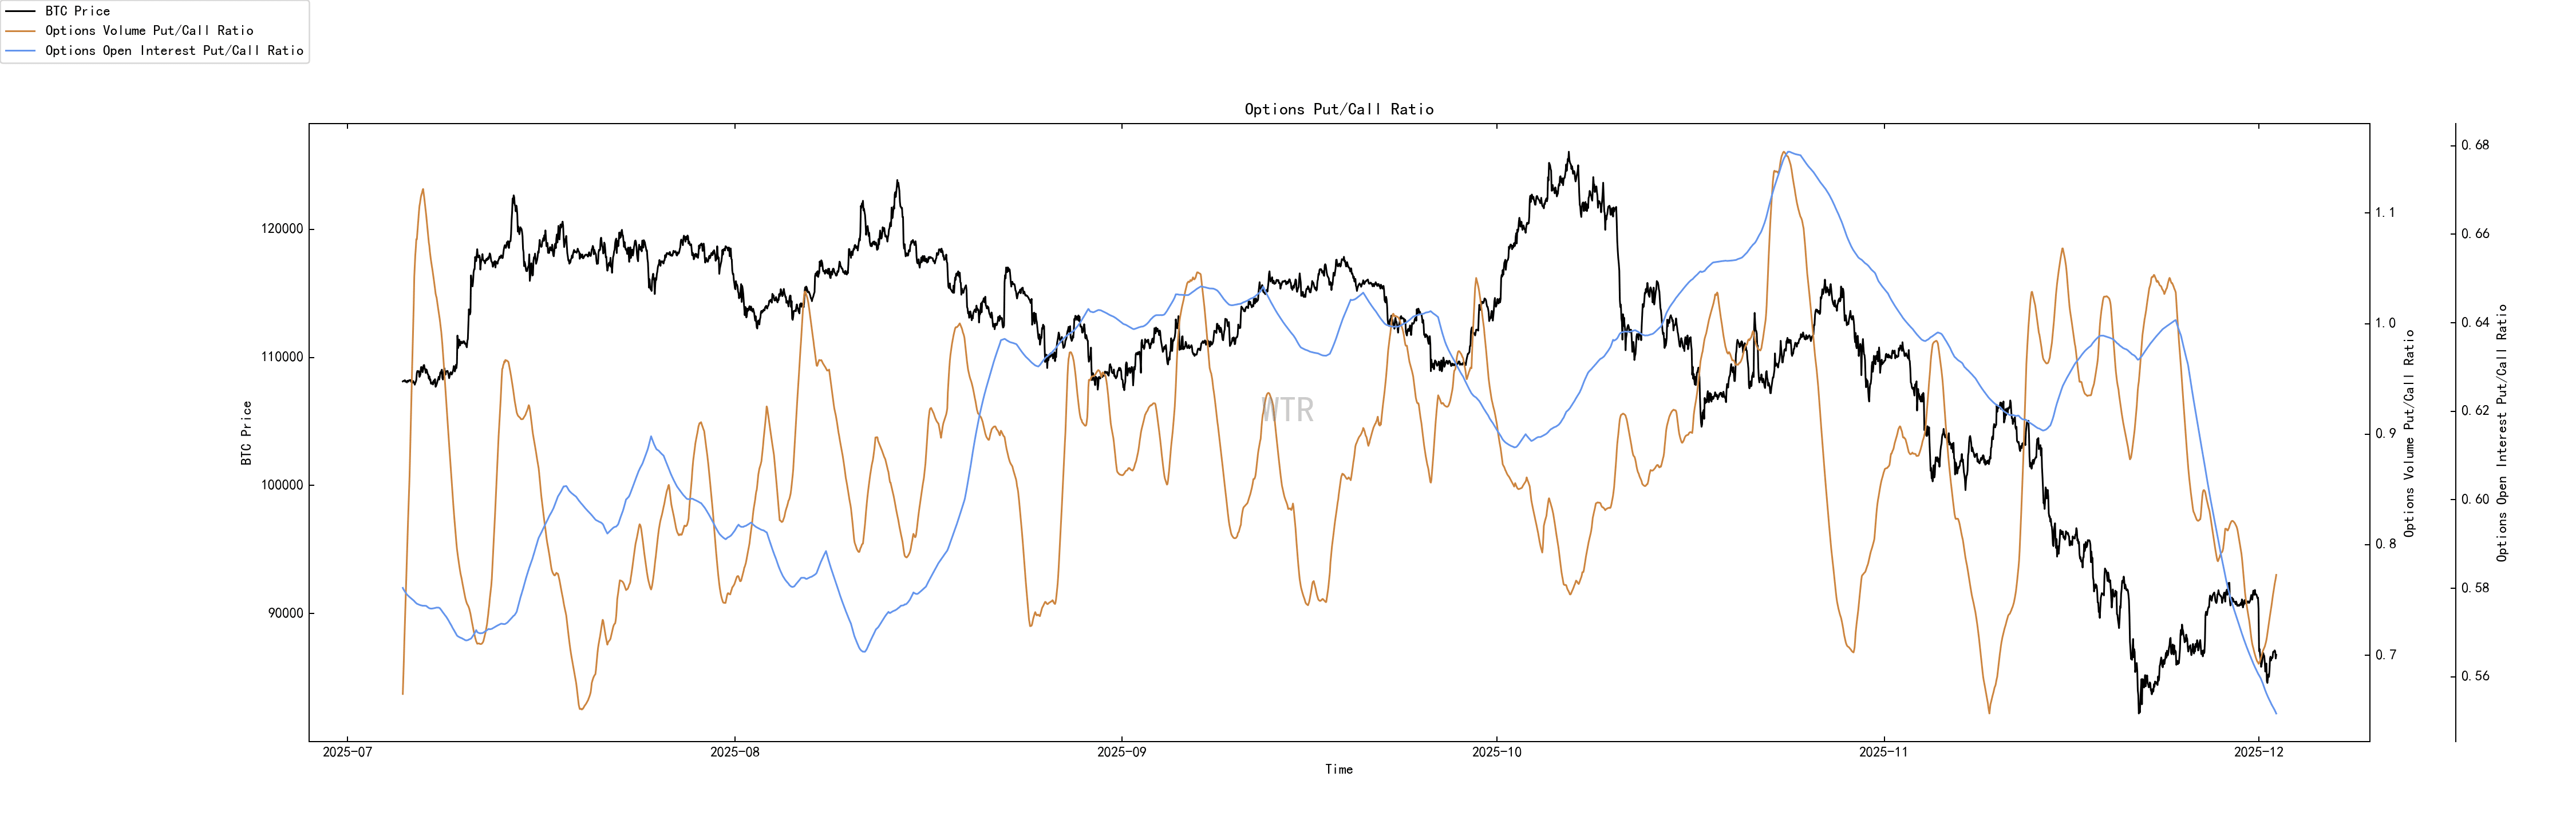
Options trading volume and the proportion of put options decreased significantly, with the put/call ratio falling to around 0.7. The options market sentiment is neutral, but there is a high degree of uncertainty.
(See chart below for derivatives trading volume)
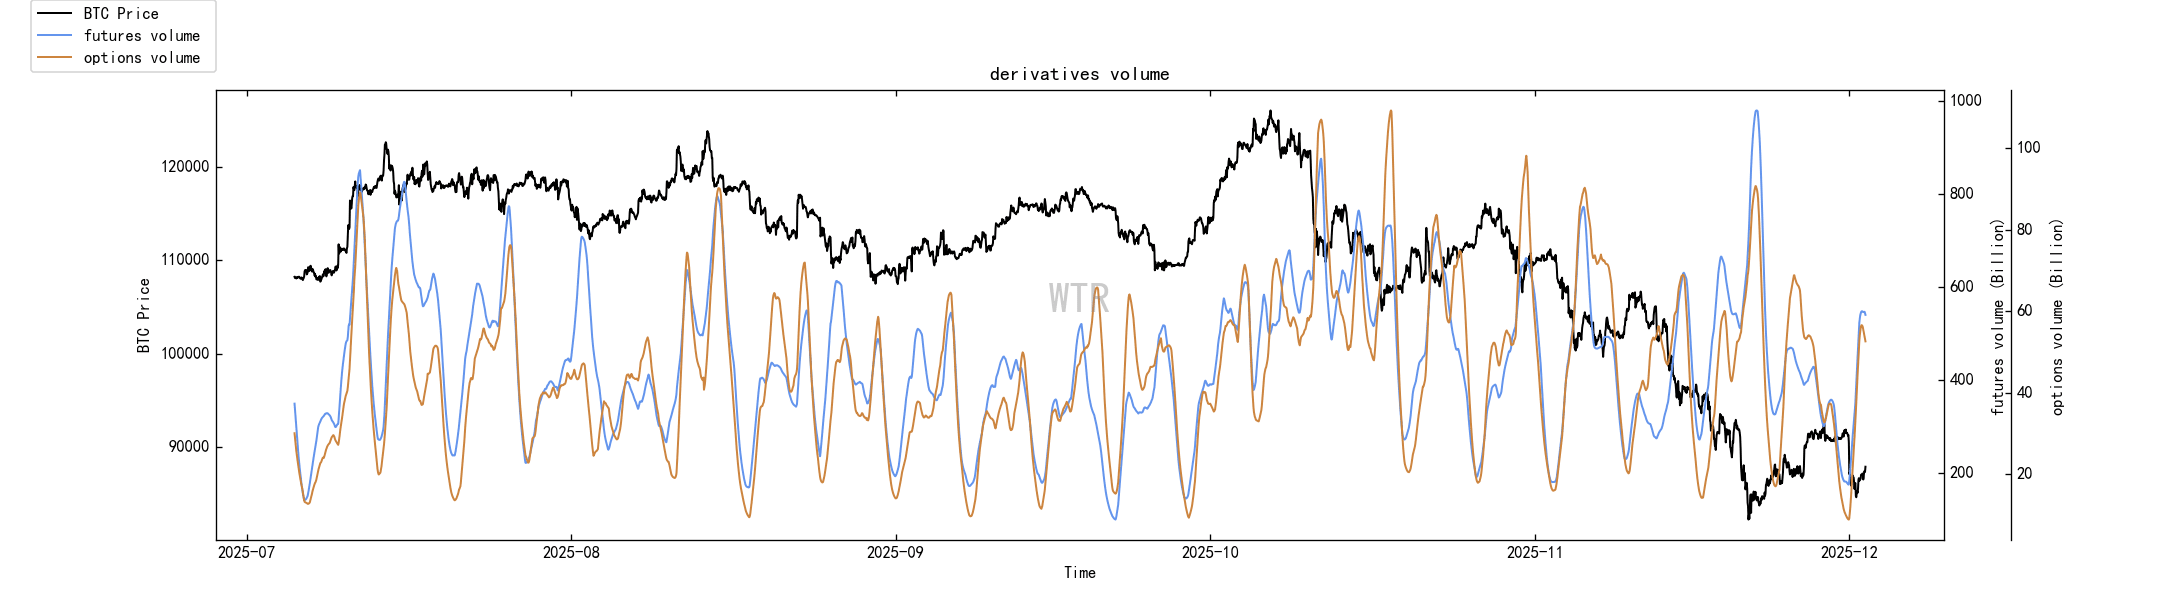
Derivatives trading volume is currently at a mid-level.
(See chart below for implied volatility of options)
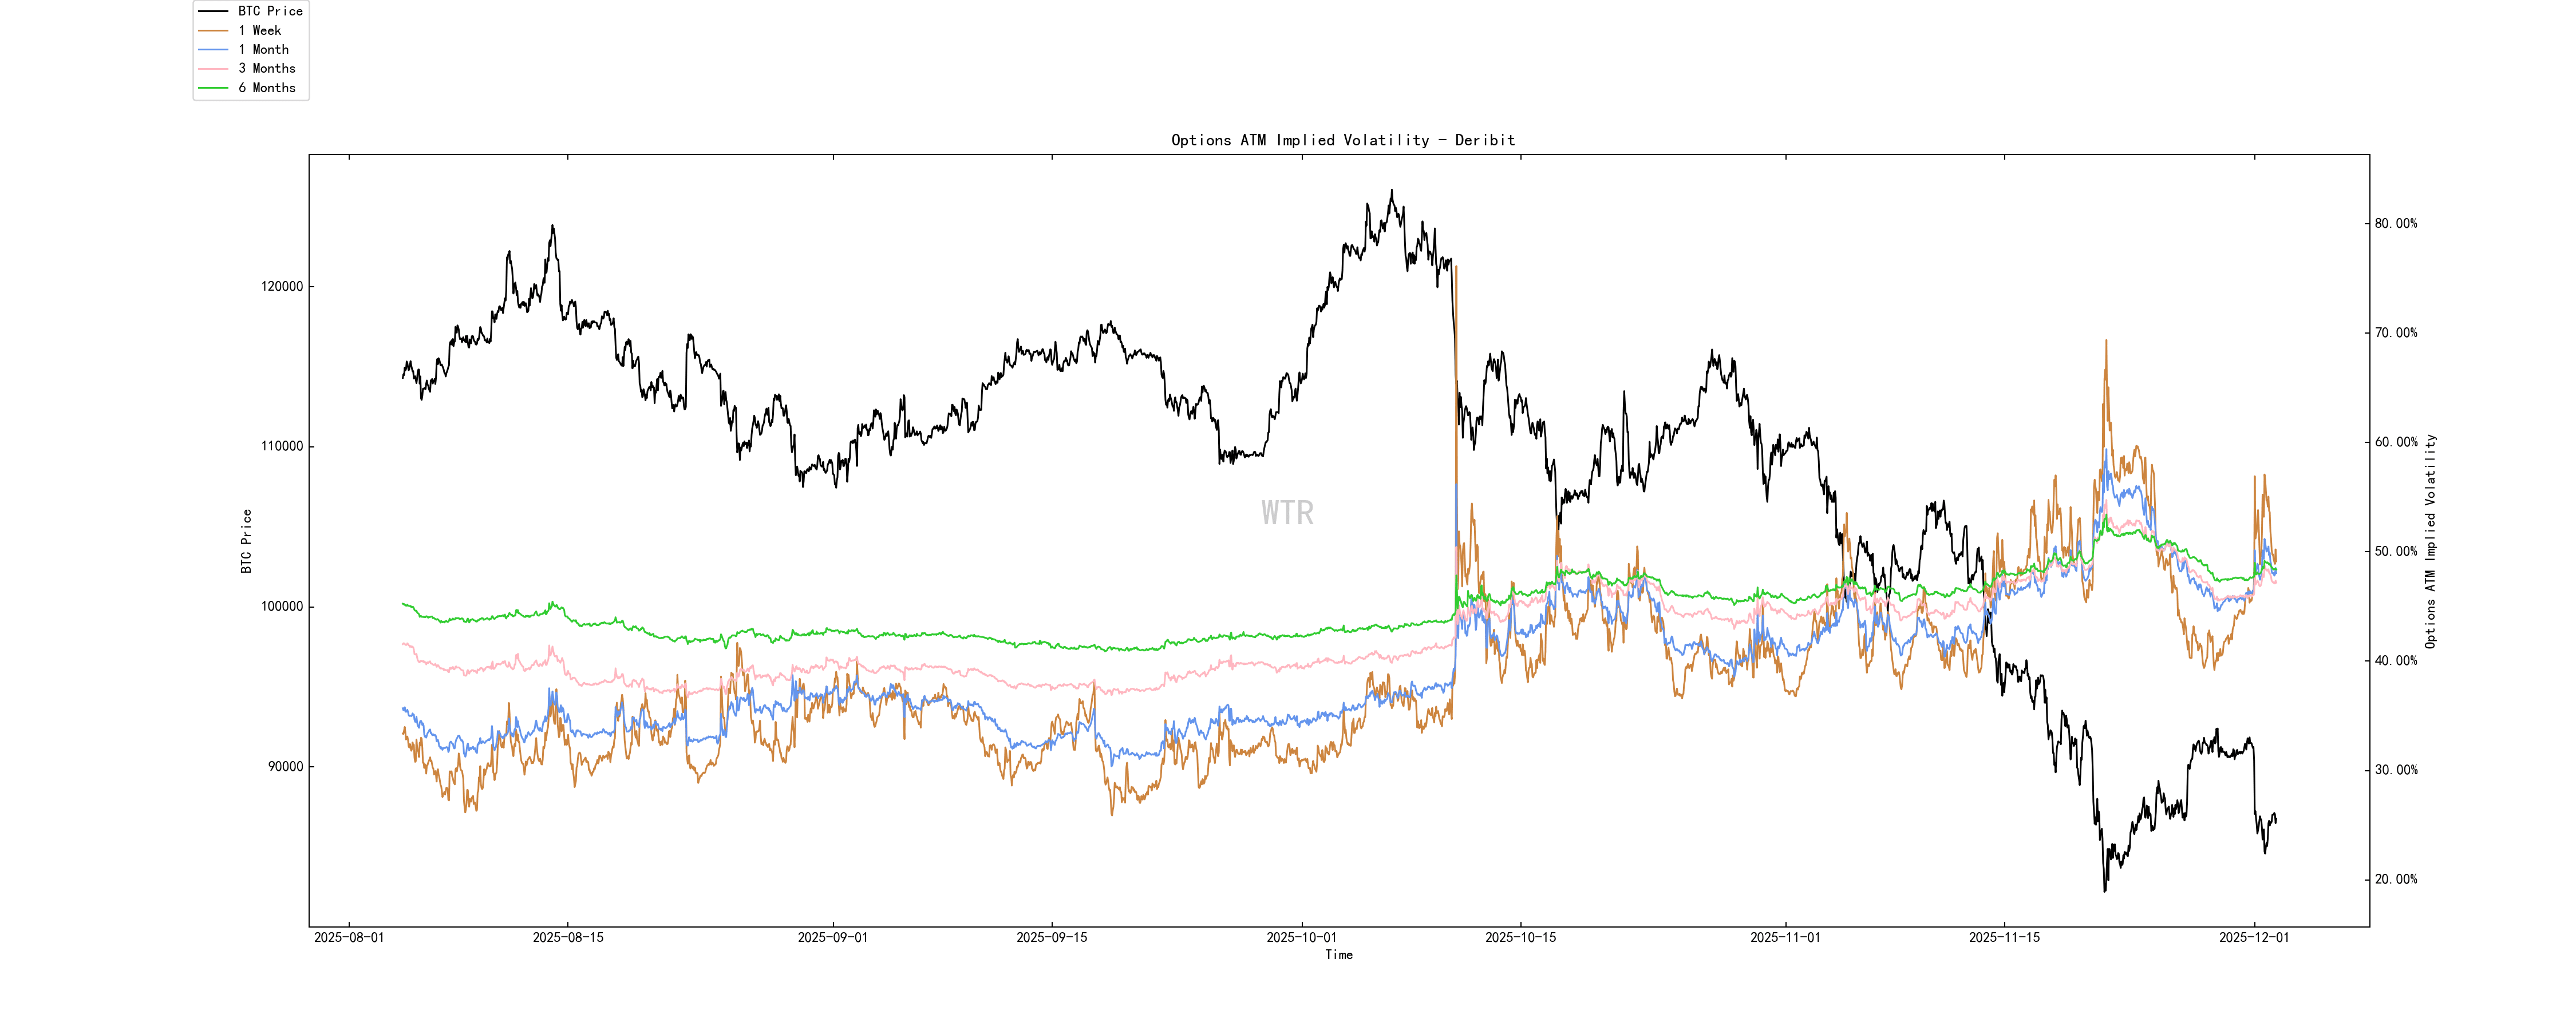
Implied volatility of options can fluctuate rapidly.
Emotional state rating: cautious, hesitant
(See chart below for profit/loss transfer amount)
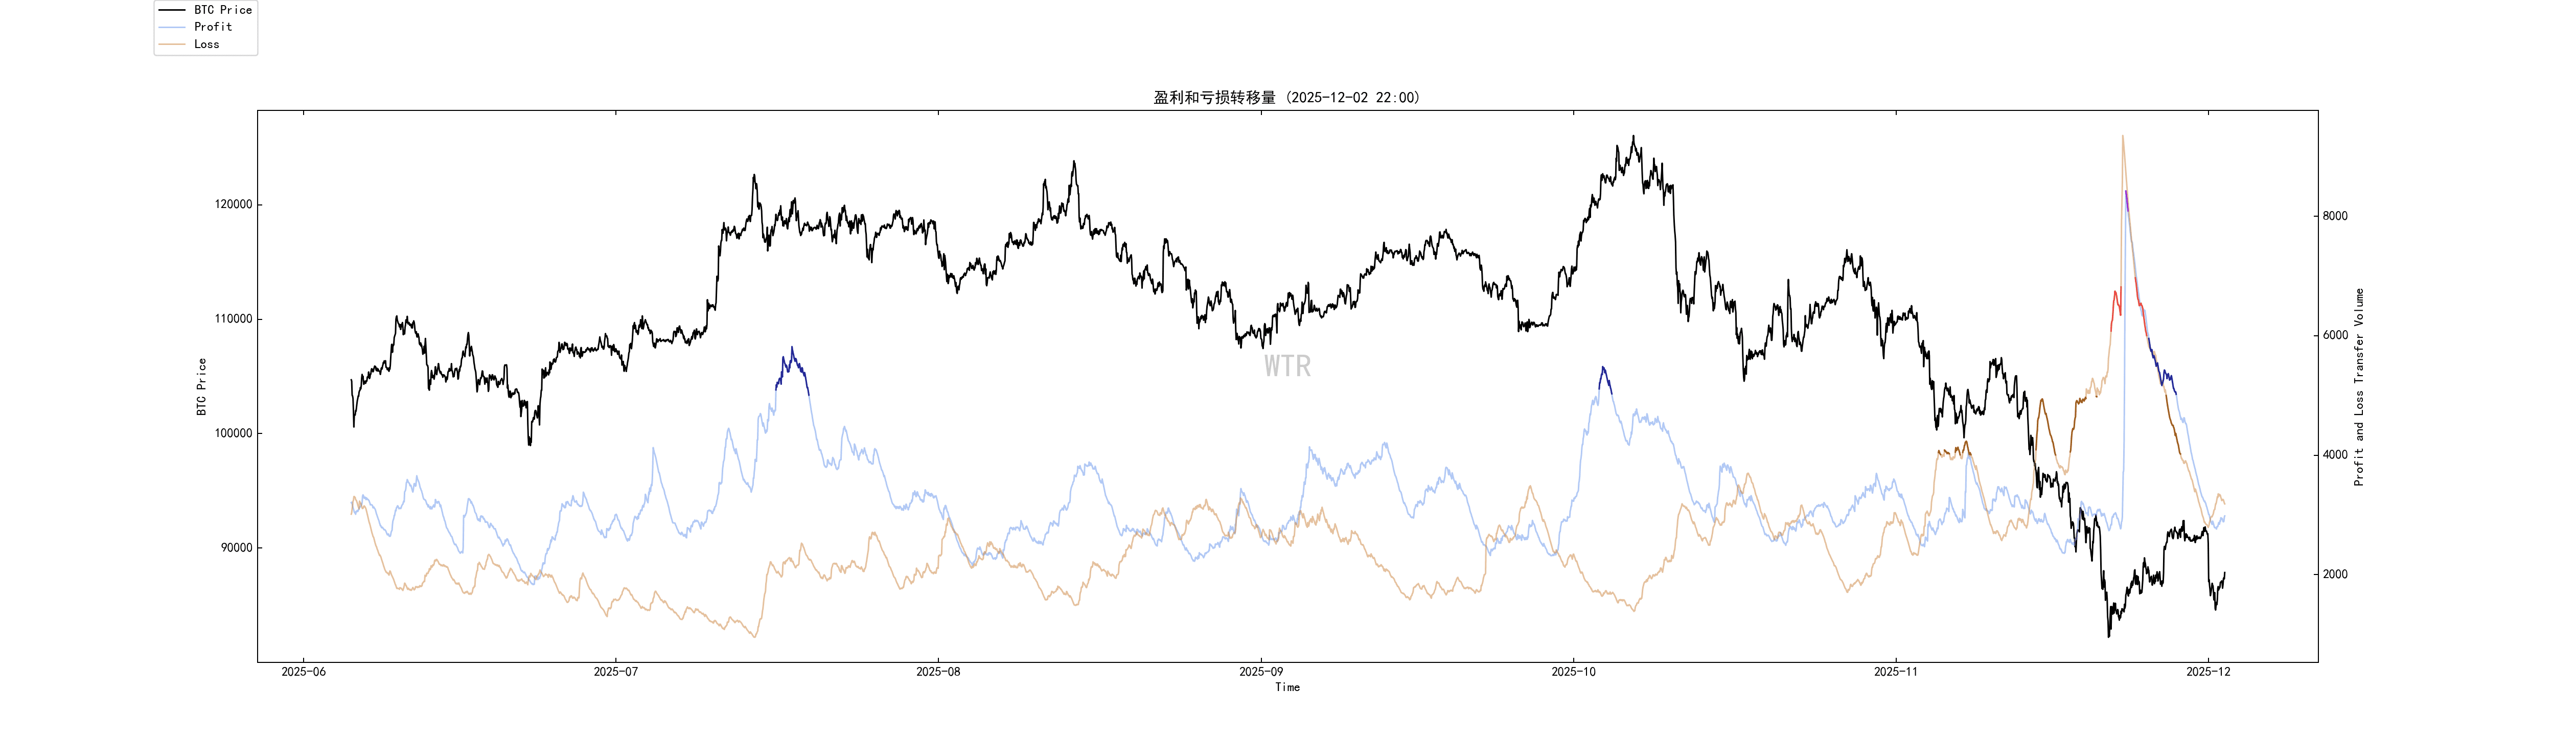
Both positive and negative sentiment are currently declining and have reached relatively low levels. Market sentiment is cautious and hesitant. Under these circumstances, volatility is more likely.
(See the image below for newly added and active addresses)
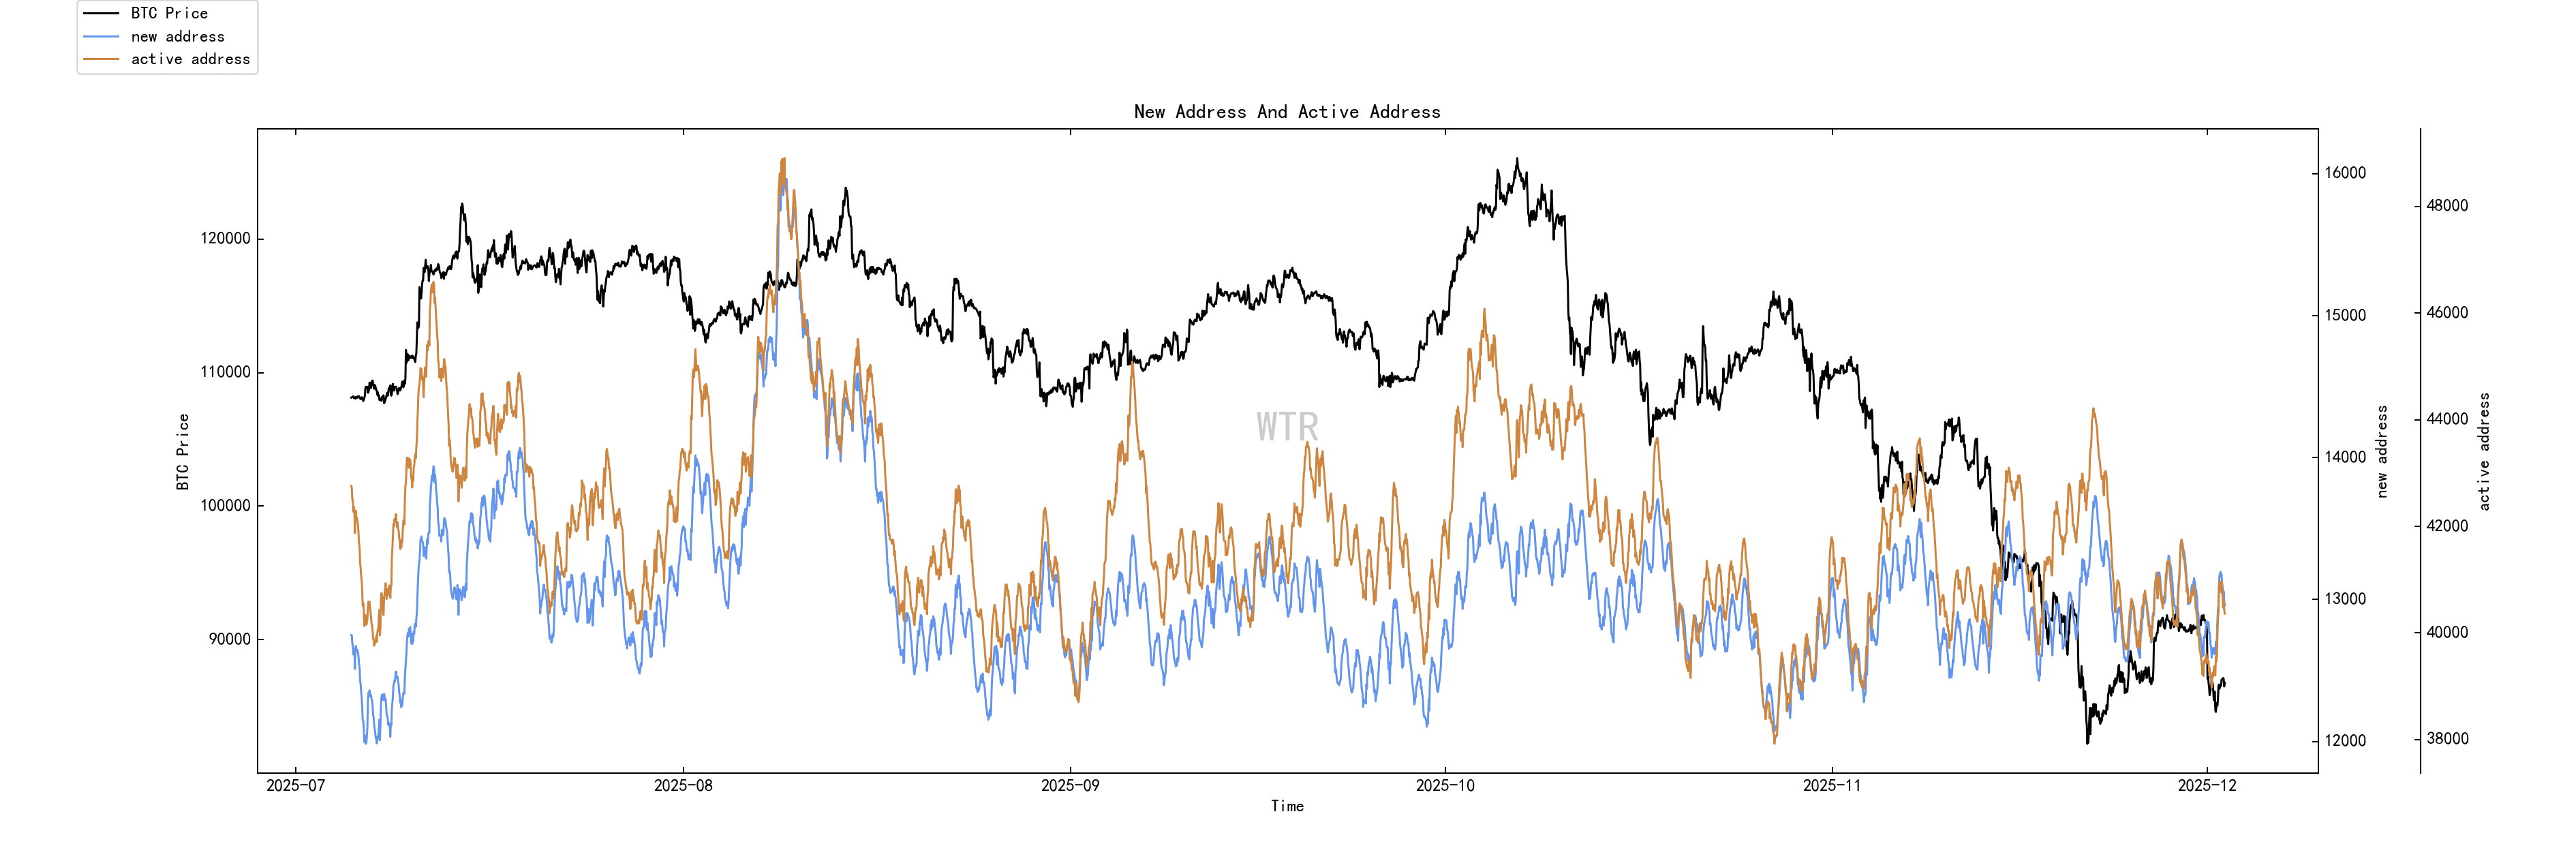
The number of new active addresses has increased to near the low end.
Spot and Selling Pressure Structure Rating: Net positions in BTC and ETH exchanges are generally experiencing a slight outflow.
(See chart below for Bing Tang Cheng's net exchange position)
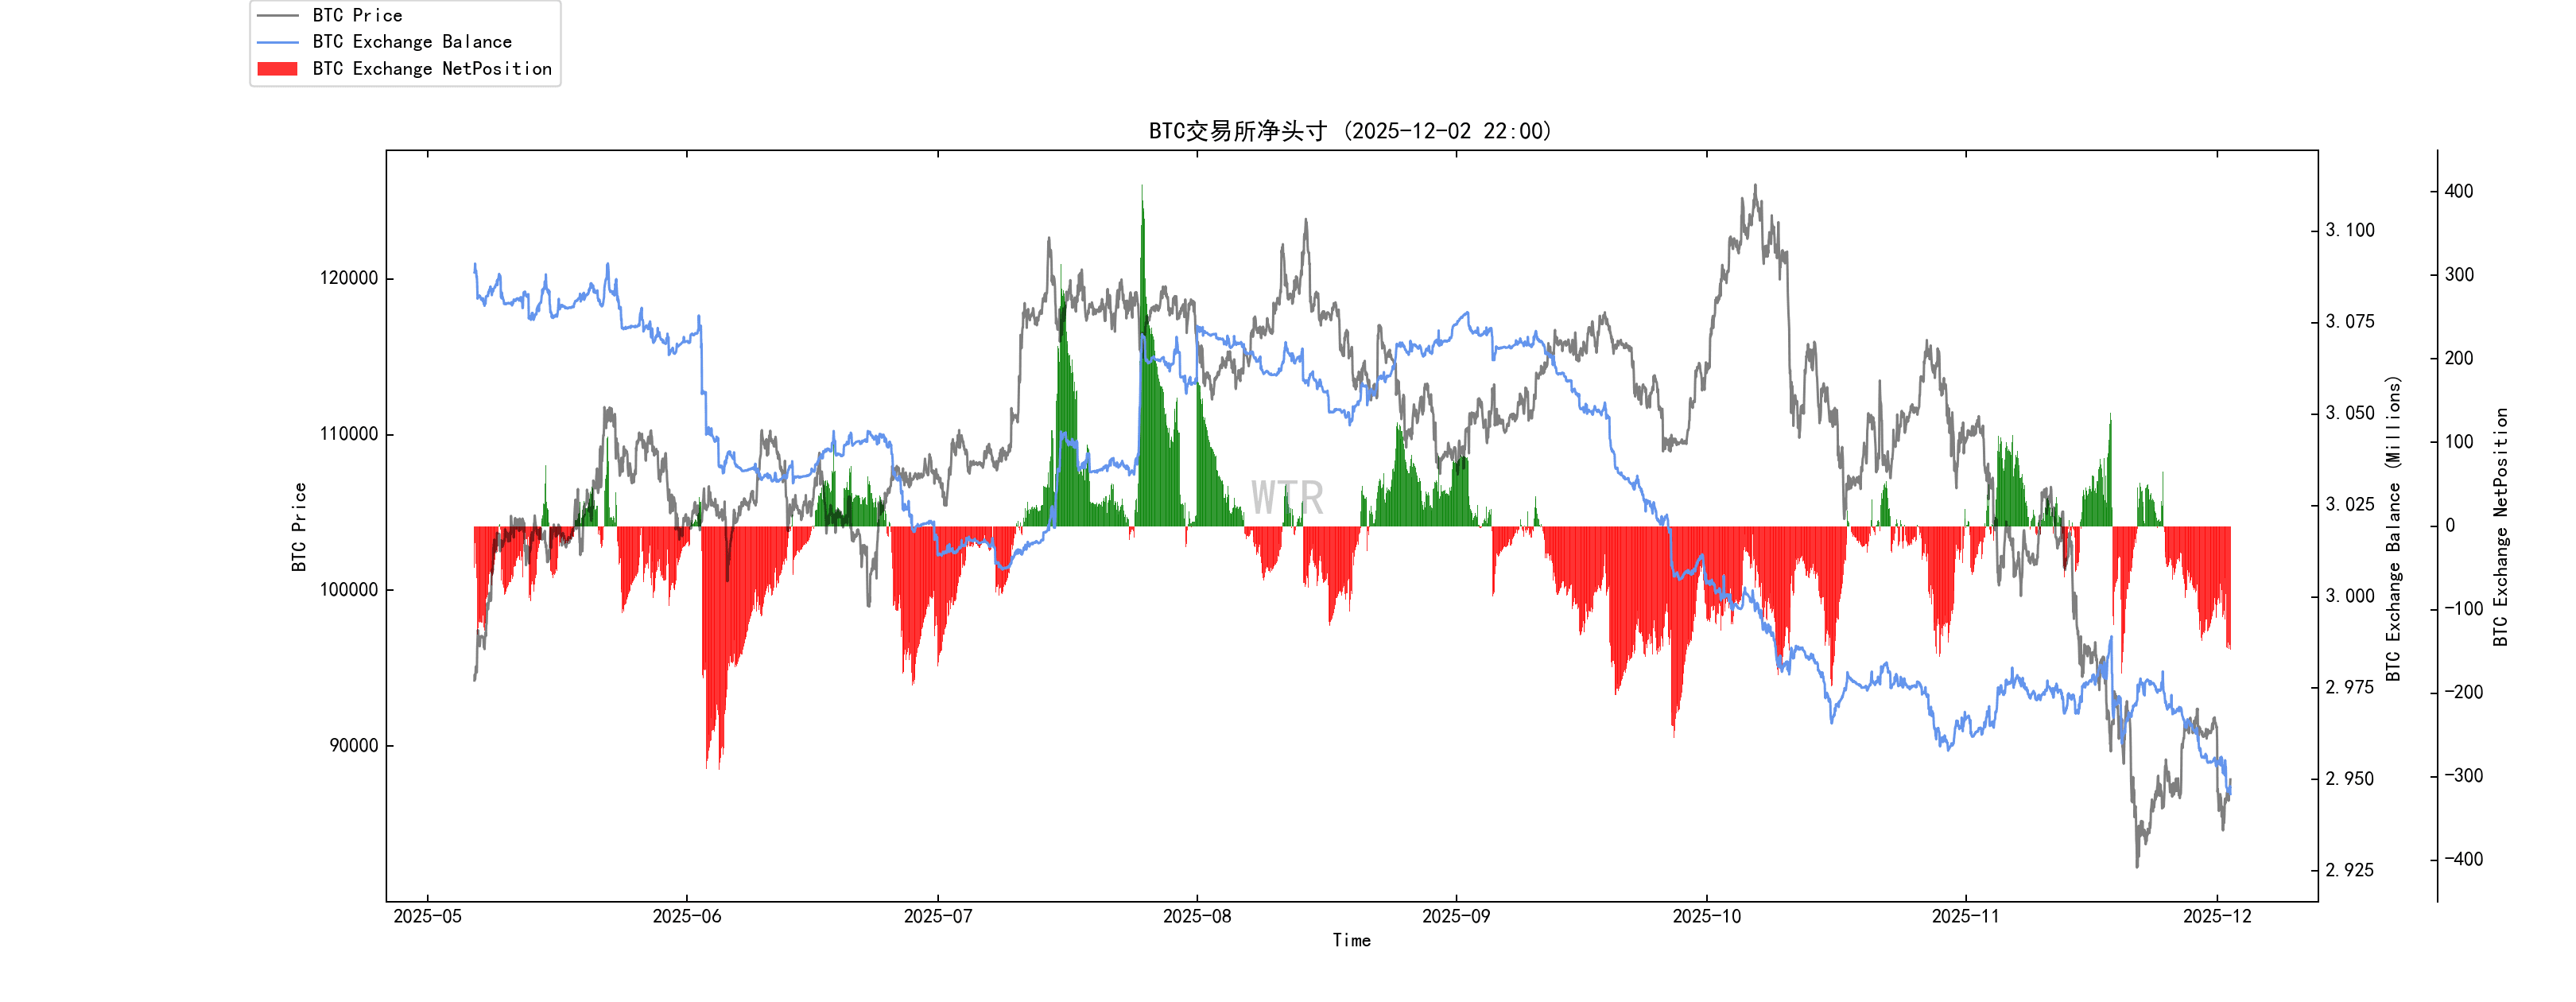
Overall, net positions on BTC exchanges are experiencing a slight outflow.
(See chart below for E-Taiwan exchange net positions)
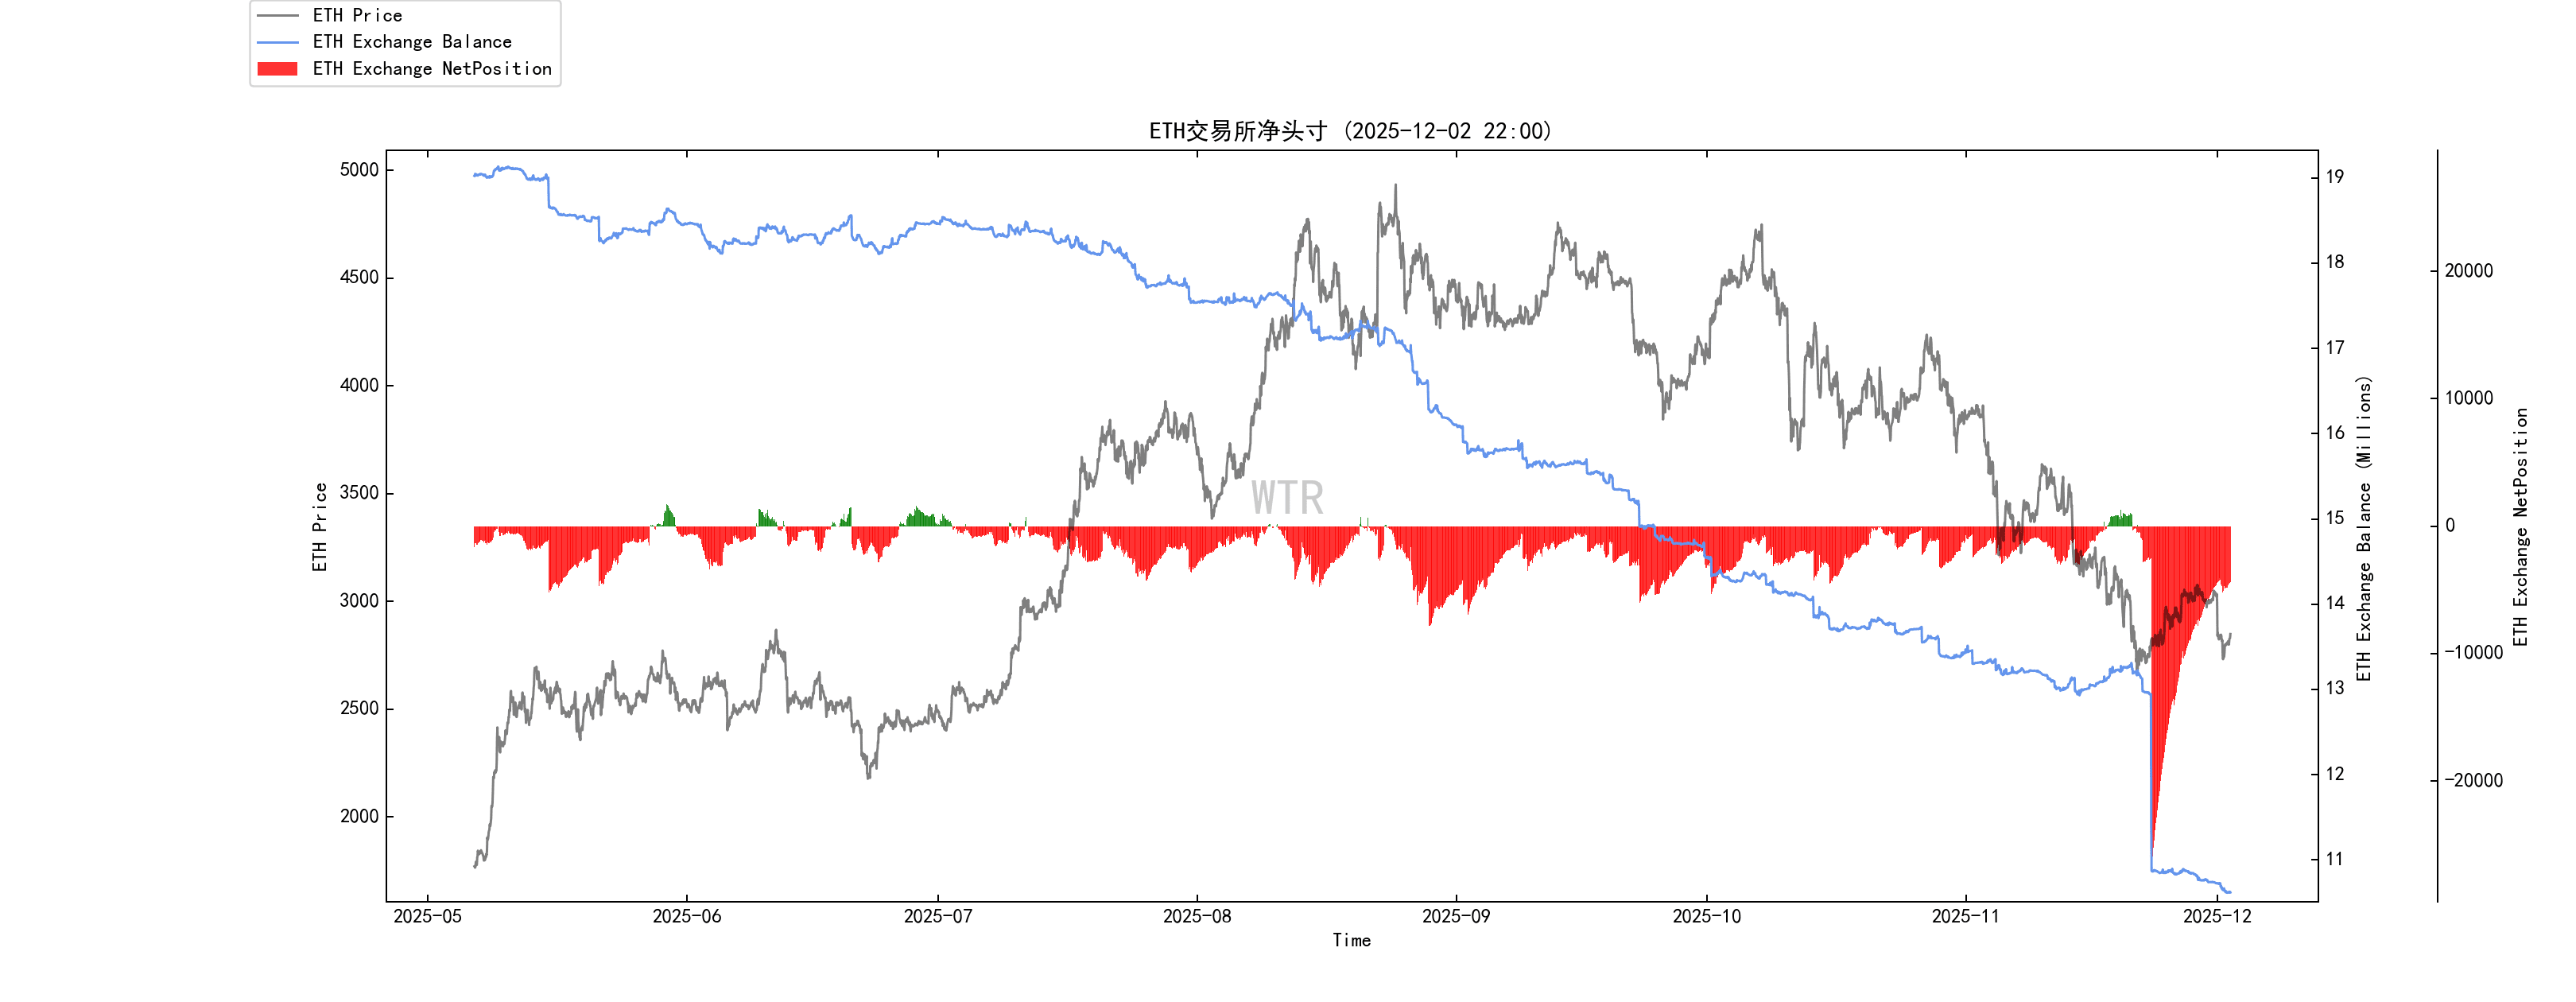
Similar to BTC, ETH is experiencing a slight outflow overall.
(See chart below: High-weighted selling pressure)
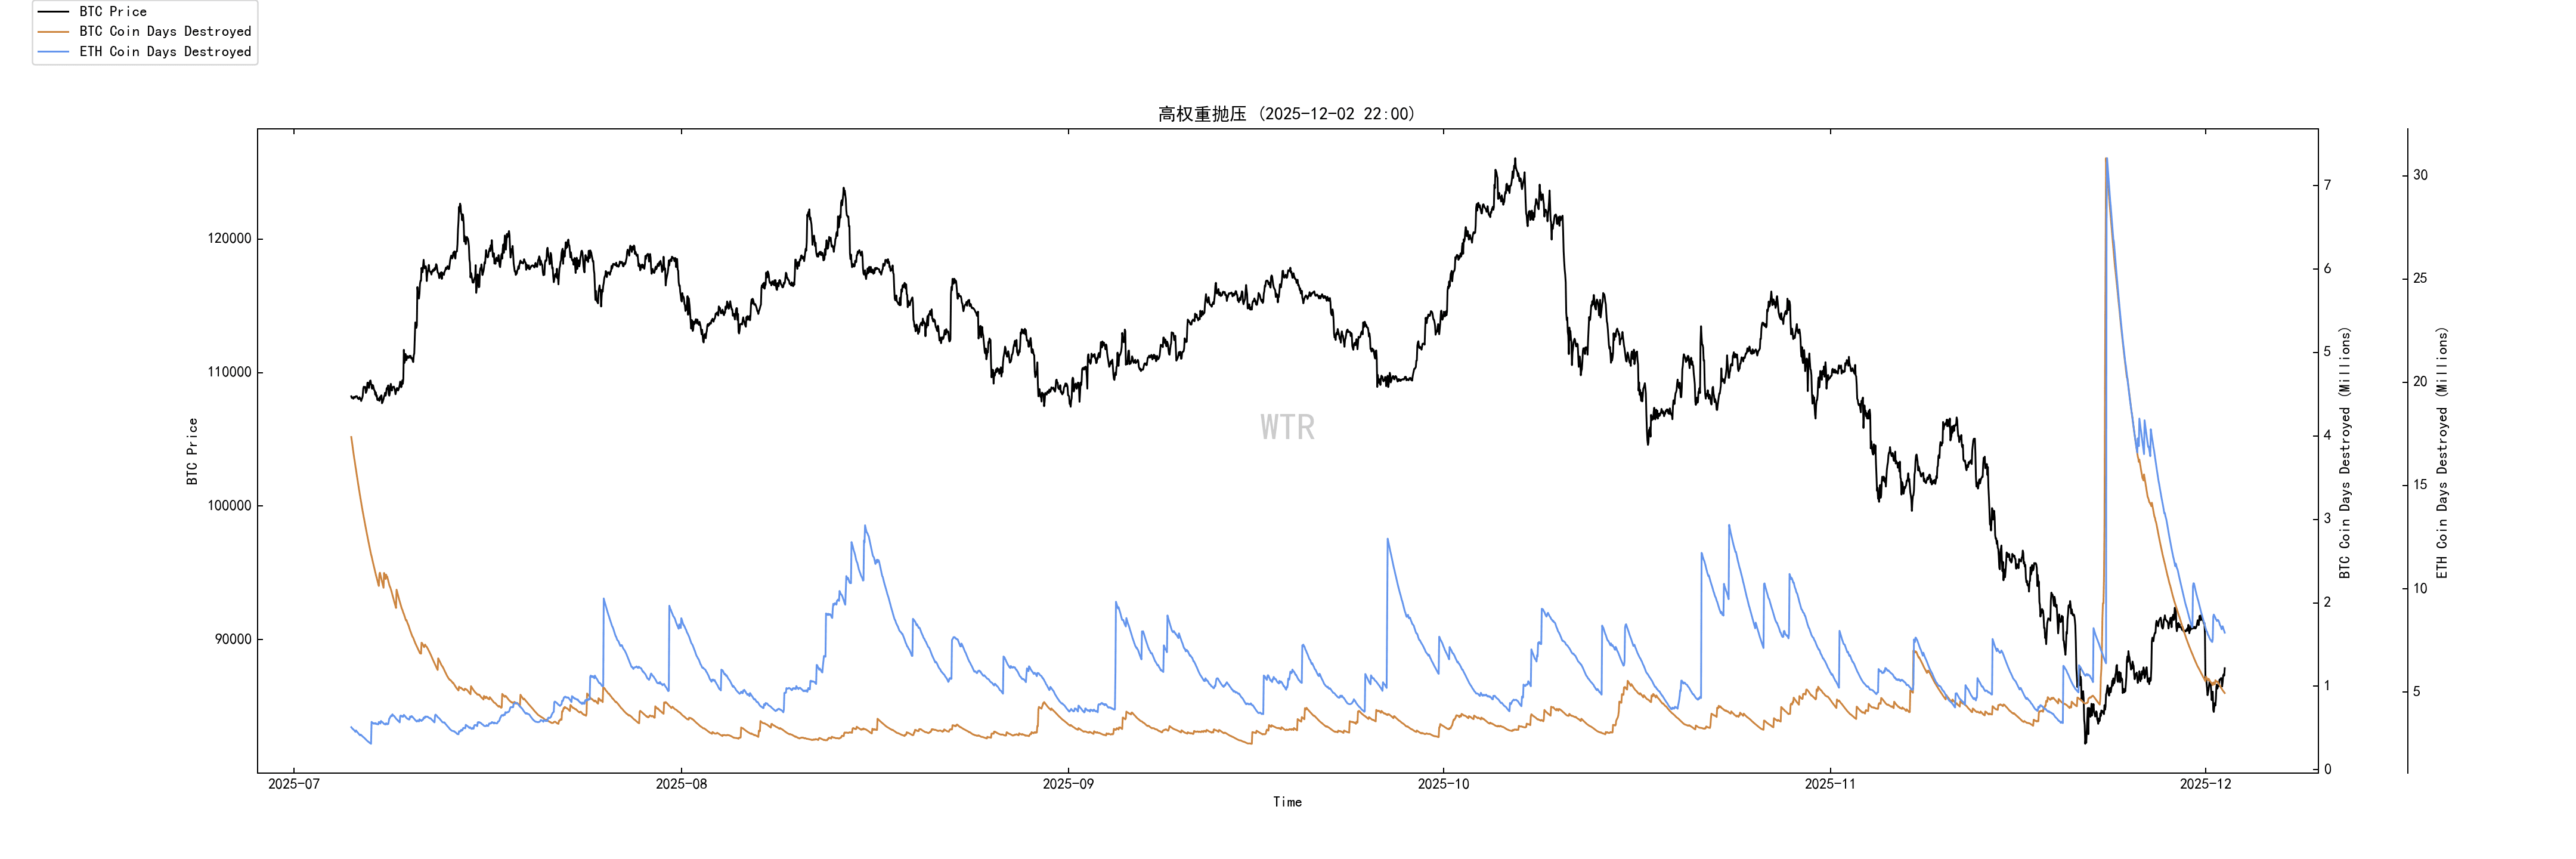
There is currently no selling pressure from high-weight stocks.
Purchasing power rating: Global purchasing power is experiencing a slight decline, while stablecoin purchasing power continues to decline.
(See chart below for global purchasing power status)
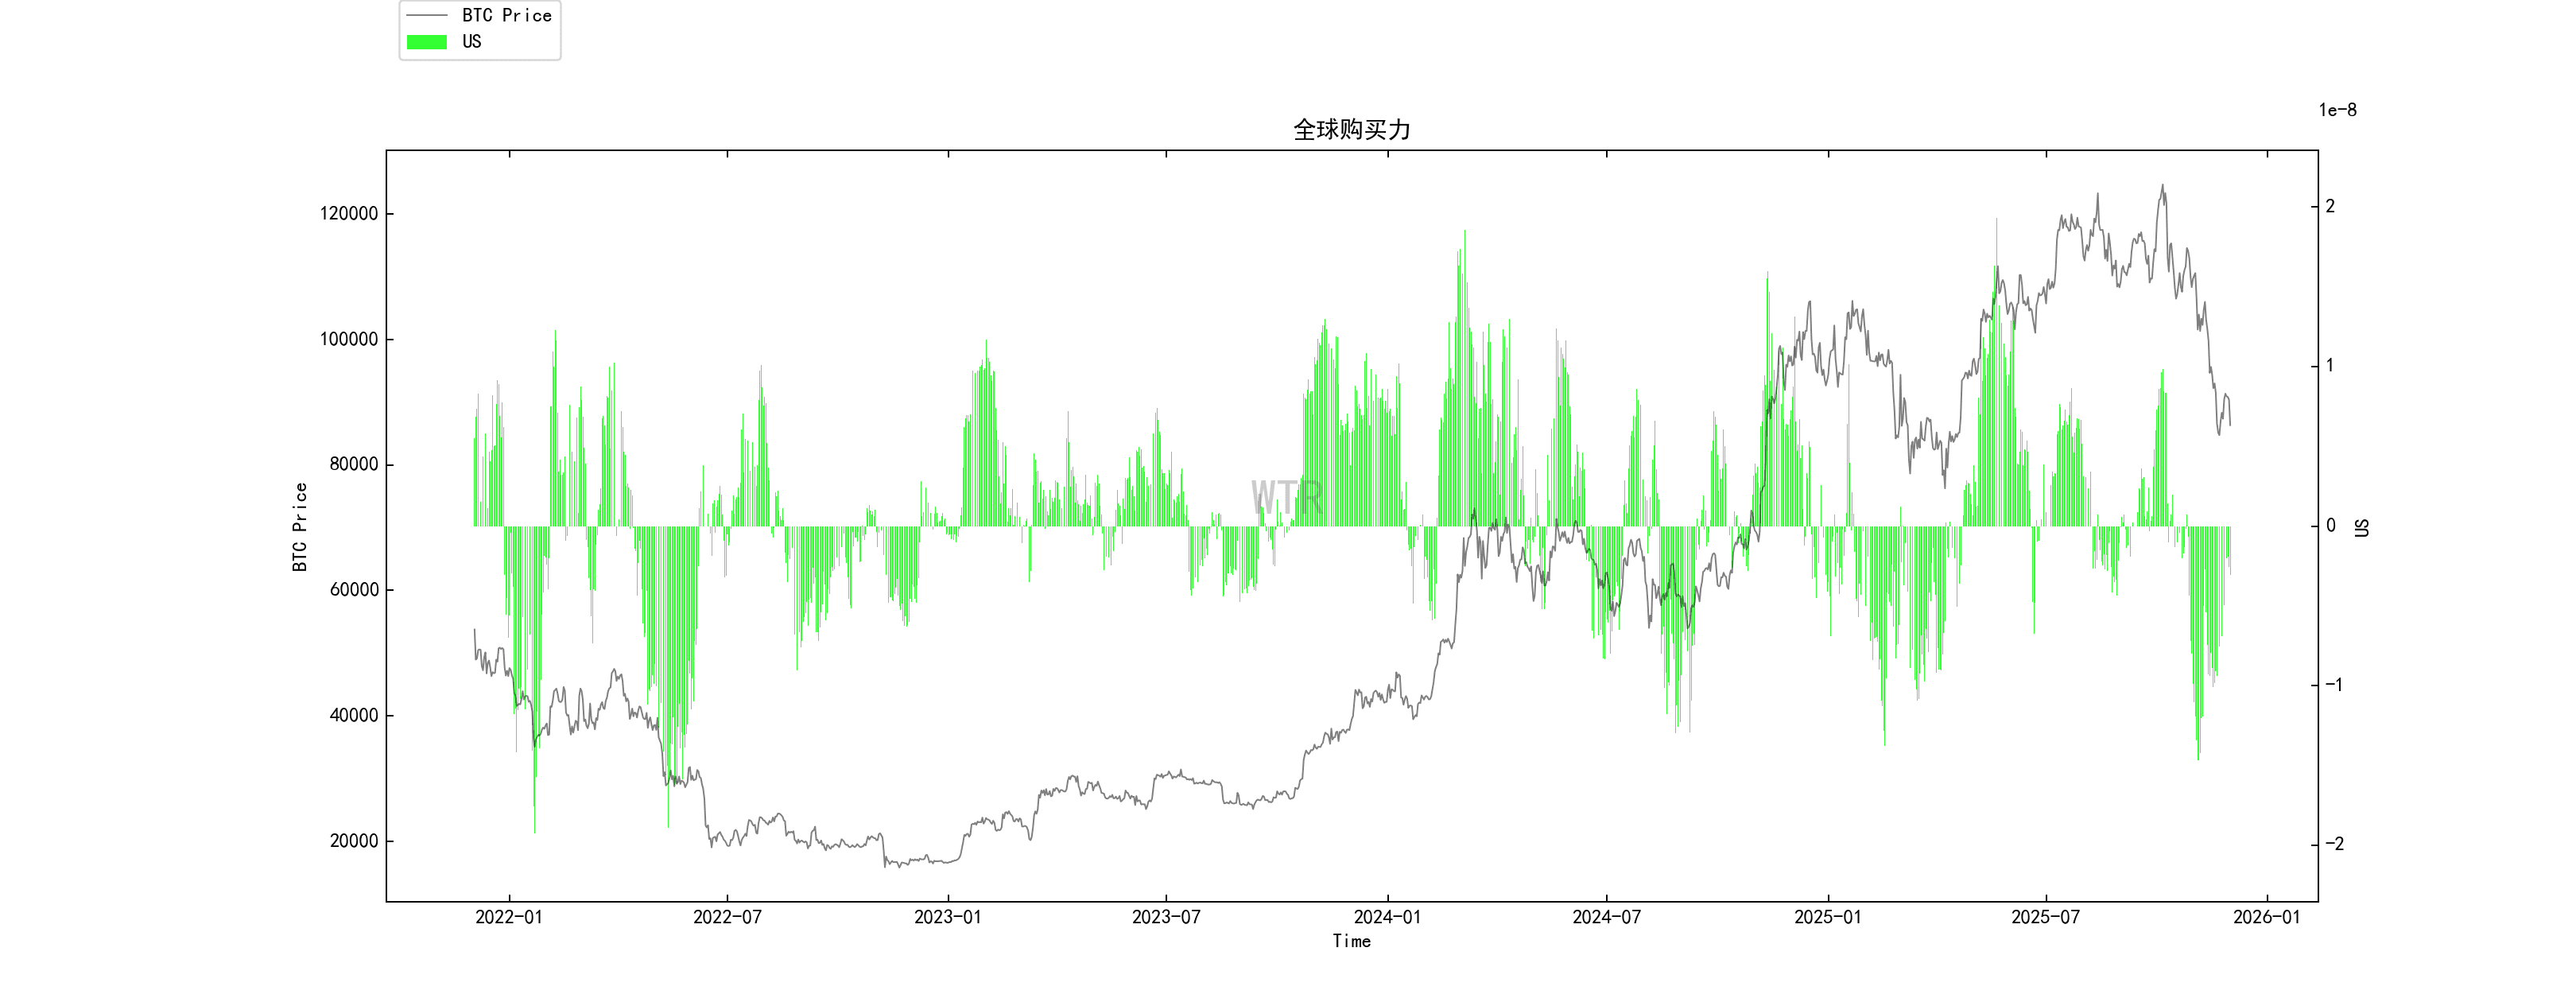
Global purchasing power is experiencing a slight decline.
(See chart below for USDC exchange net positions)
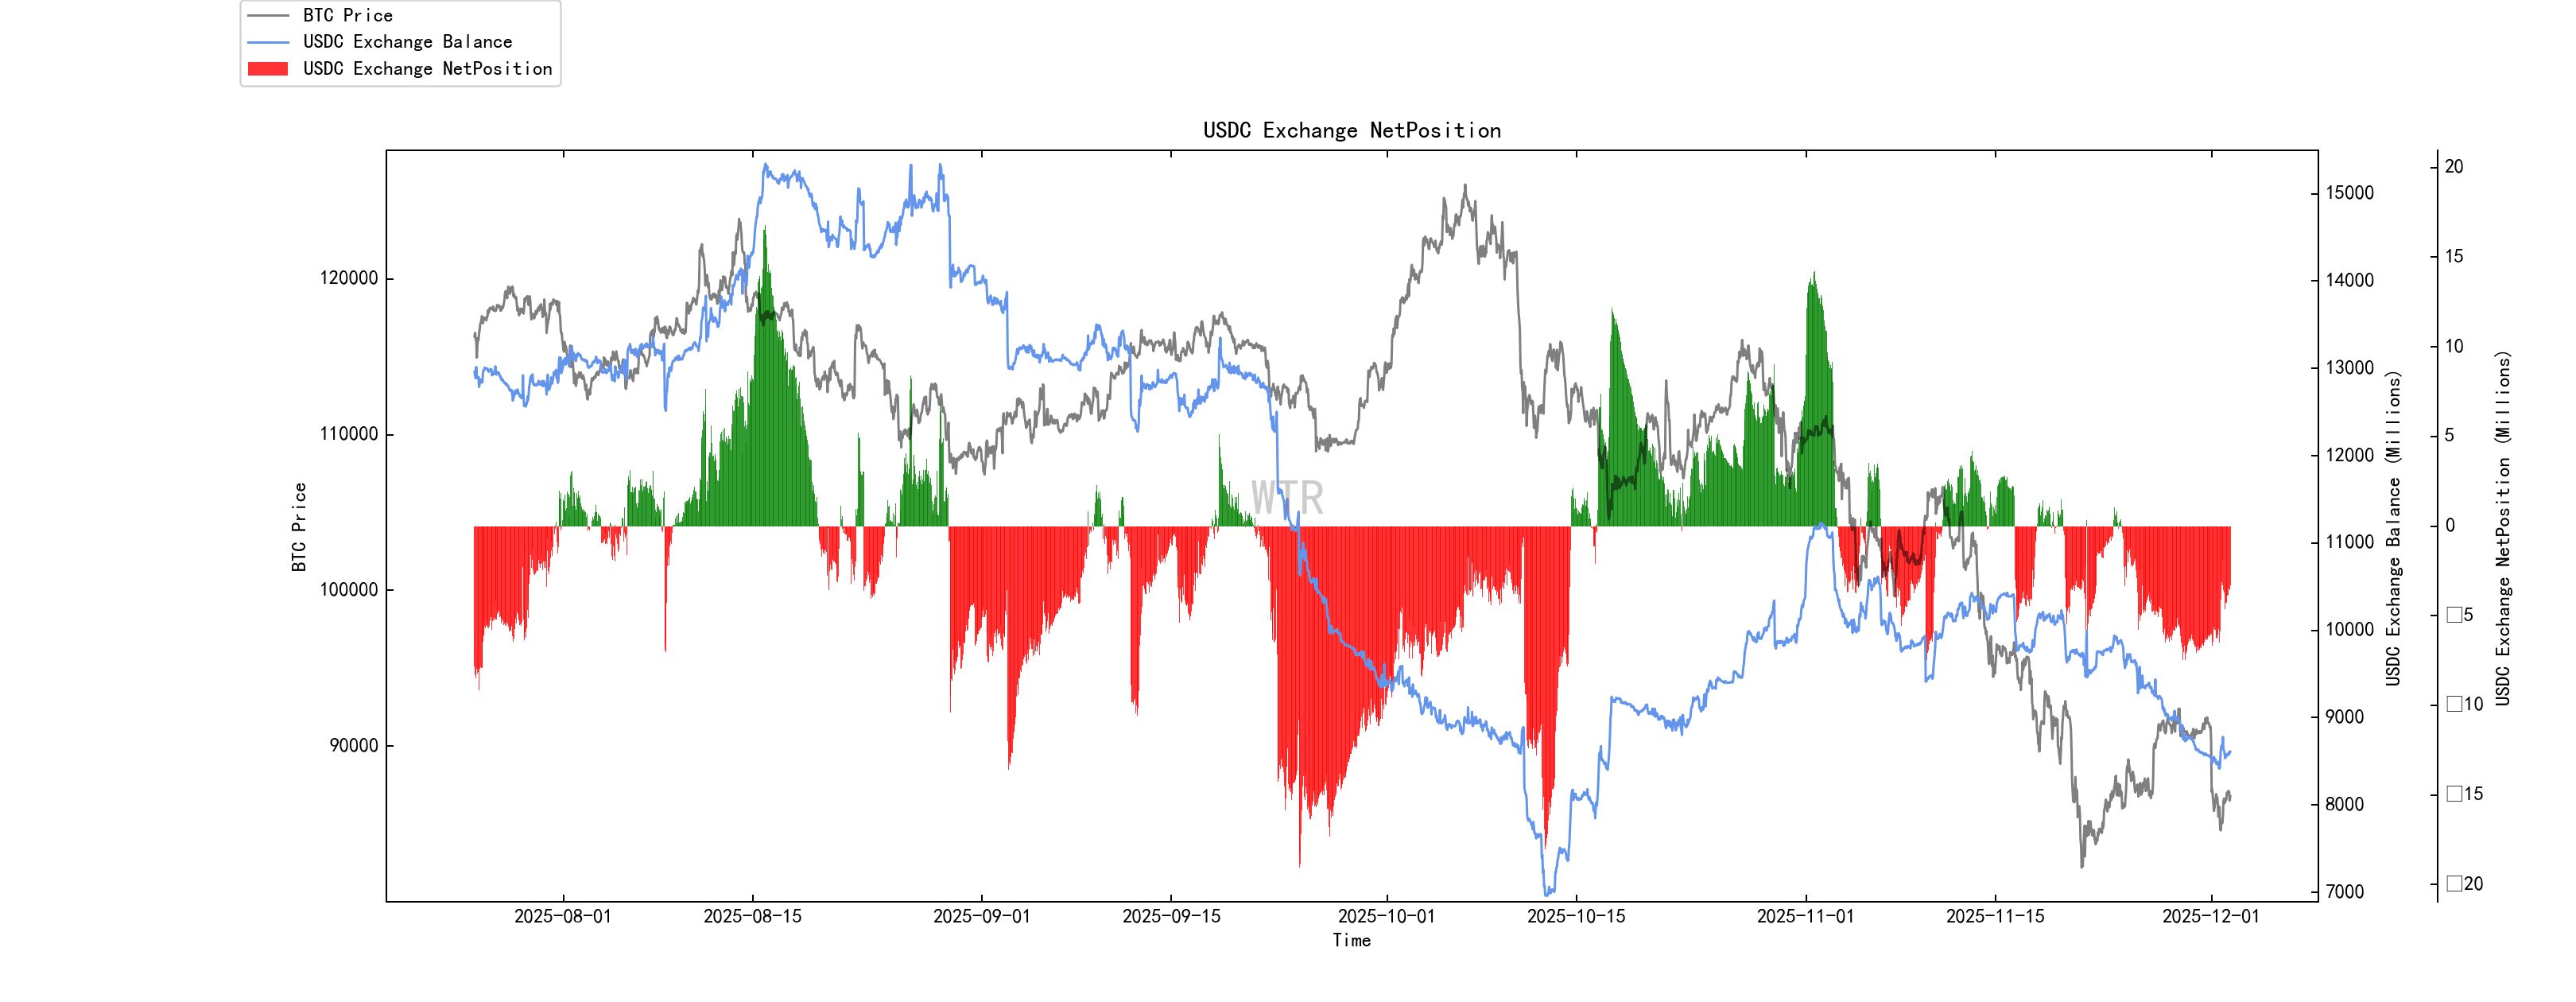
Stablecoins continue to lose purchasing power.
This week's summary:
News Summary:
The current environment is:
Growth has not collapsed, and policies have eased marginally, but Japan is tightening the last piece of its ultra-loose monetary policy. Coupled with the political maneuvering between the US and the Federal Reserve, global liquidity has been pushed to the eve of a turning point characterized by "short-term instability and long-term easing."
This round of cryptocurrency price crash is more due to:
High leverage + ETF cashing out + yen carry expectations changed, rather than the macroeconomy completely collapsing.
From a 3-12 month perspective, it's more like the eve of 2020, where the macroeconomic outlook wasn't bad, but asset prices had already priced in the most pessimistic expectations.
This current downturn is more like a macroeconomic shock and leverage cleansing similar to that of March 2020.
The macroeconomic outlook is not a hard landing like in 2011/2015; it is more of a combination of one-off tightening (Japan) and political uncertainty (Trump-Fed).
The core game isn't whether or not interest rates are cut, but rather who controls the long-term nominal interest rate path:
If political forces (Trump + Congress) ultimately prevail over central bank hawks, then in the long run, moderate inflation + low real interest rates will benefit commodities, gold, and BTC.
If the central bank insists on independence and maintains a relatively high real interest rate in the long term, then the price-to-earnings ratio/price-to-book ratio of technology growth and crypto will need to be compressed.
Macro level:
We are at a crossroads where global growth is still acceptable, inflation is slowly declining, policies are shifting from extreme tightening to neutral to slightly loose, Japan's tightening has shattered the last illusion of zero interest rates, and US politics is beginning to deeply intervene in monetary policy.
Encryption layer:
Prices have just experienced a brutal November like 2018, but while ETFs are experiencing outflows and leveraged positions are being liquidated, VCs, institutions, stablecoins, and tokenization infrastructure are accelerating their progress, and the macroeconomic outlook does not support extremely pessimistic pricing in the long term.
Long-term on-chain insights:
The main reason for this round of sharp decline was not the collapse of the on-chain structure, but the interest rate repricing caused by BOJ + FOMC combined with the large-scale redemption of ETFs. The external financial system took the initiative, and the on-chain funds were passively hit.
The overall long-term on-chain market remains stable. Idle whales buy below 108,000, sell above 100,000, and buy again below 90,000. The proportion of holders with more than six months of holdings remains high, indicating that the cyclical story has not ended.
Exchange whales were trading in the 80,000-90,000 range, while the real panic selling was concentrated in the 88,000 to 80,600 range. The selling pressure has now clearly subsided.
Short-term holders are generally experiencing unrealized losses, their cost basis has shifted downwards, leverage has been largely cleared, and sentiment has shifted from greed to apathy, which creates room for subsequent medium-term market movements.
In the medium to long term, as long as global real interest rates return to a slow downward trend, coupled with the advancement of tokenization and stablecoin institutionalization, Bitcoin will still stand in a macroeconomic context of long-term upward trend, only the pace and style have undergone structural changes.
Market tone:
The current market is undergoing a structural shakeout and a slow bull market, which is an institutional cleansing process rather than the end of a cycle: external interest rate shocks and ETF risk control have completed the restructuring of short-term funds, and the long-term stock structure is basically intact.
In the 80,000-100,000 range, the trend should be seen as a turnover zone between institutions and whales—whoever treats this period as the starting point of a bear market will hand over their most valuable chips to true long-term players.
On-chain mid-term exploration:
The market is showing signs of increased inflows, shaking off the slump and entering a phase of slow recovery.
USDC holders lacked patience and quickly sold off their holdings after the market rebounded.
Whales only provide bottom support, absorbing losses during declines and selling off after rebounds.
The short-term cost line is around 103,000. Short-term participants are still losing money and need time to digest the floating losses.
Exchanges have resumed outflows, and the accumulation rate of tokens on the exchange is steadily increasing.
Market tone:
Poor patience, slow repair
Funds are participating cautiously with little patience, and the market is unwittingly lingering in an atmosphere of slow recovery and low sentiment.
Short-term on-chain observations:
Derivatives rating: The risk level is close to the red zone, indicating increased risk in derivatives.
The number of newly added active addresses is relatively low.
Market sentiment rating: Cautious, Hesitant
Net positions in BTC and ETH exchanges are generally experiencing a slight outflow.
Global purchasing power is experiencing a slight decline, while stablecoin purchasing power continues to decrease.
Market tone:
Market sentiment is cautious and hesitant, coupled with the fact that purchasing power has not yet recovered and positive sentiment is lacking. There are too many trapped shares of 90,000 to 100,000 or more. In the short term, market trading opportunities will be fewer and more difficult. If there is a weak rebound, it is still best to focus on swing trading.
Risk warning:
The above are all market discussions and explorations, and do not constitute investment advice; please view and guard against black swan risks in the market with caution.
This report was provided by the WTR Institute.
Welcome to follow us!


