10U War God Survival Guide: How poor people can turn 73 yuan into a turnaround in the cryptocurrency world (with a bloody manual attached).
Now I'm breaking down this set of tricks and feeding it to you. Remember to bookmark it after watching, in case you can't find it later.
Survival rule number one: sew your pants pocket shut.
Immediately blacklist WeChat balance, Huabei, and Jiebei, leaving only 73 yuan in your pocket. Go to the convenience store downstairs to buy a bottle of Nongfu Spring, exchange it with the boss for 10U cash—don't ask why it's not 100U, the tolerance for poor people is thinner than paper.
The key point is coming: break this 10U into five 2U bills, wrap them in plastic wrap, and stuff them into the sock's compartment. Don't laugh, my brother survived on the last 2U using this trick during the crash on March 12 last year, and now he's become a local emperor in Vietnam.
The correct way to play Russian roulette.
Newbies often ask, 'When to enter the market?' I’ll let you in on a secret: when the Binance server crashes like a PPT, when you can't log into the exchange app, and when everyone in the groups is cursing—grab your 5U and throw it at the ETH contract, 100x leverage straight to the max.
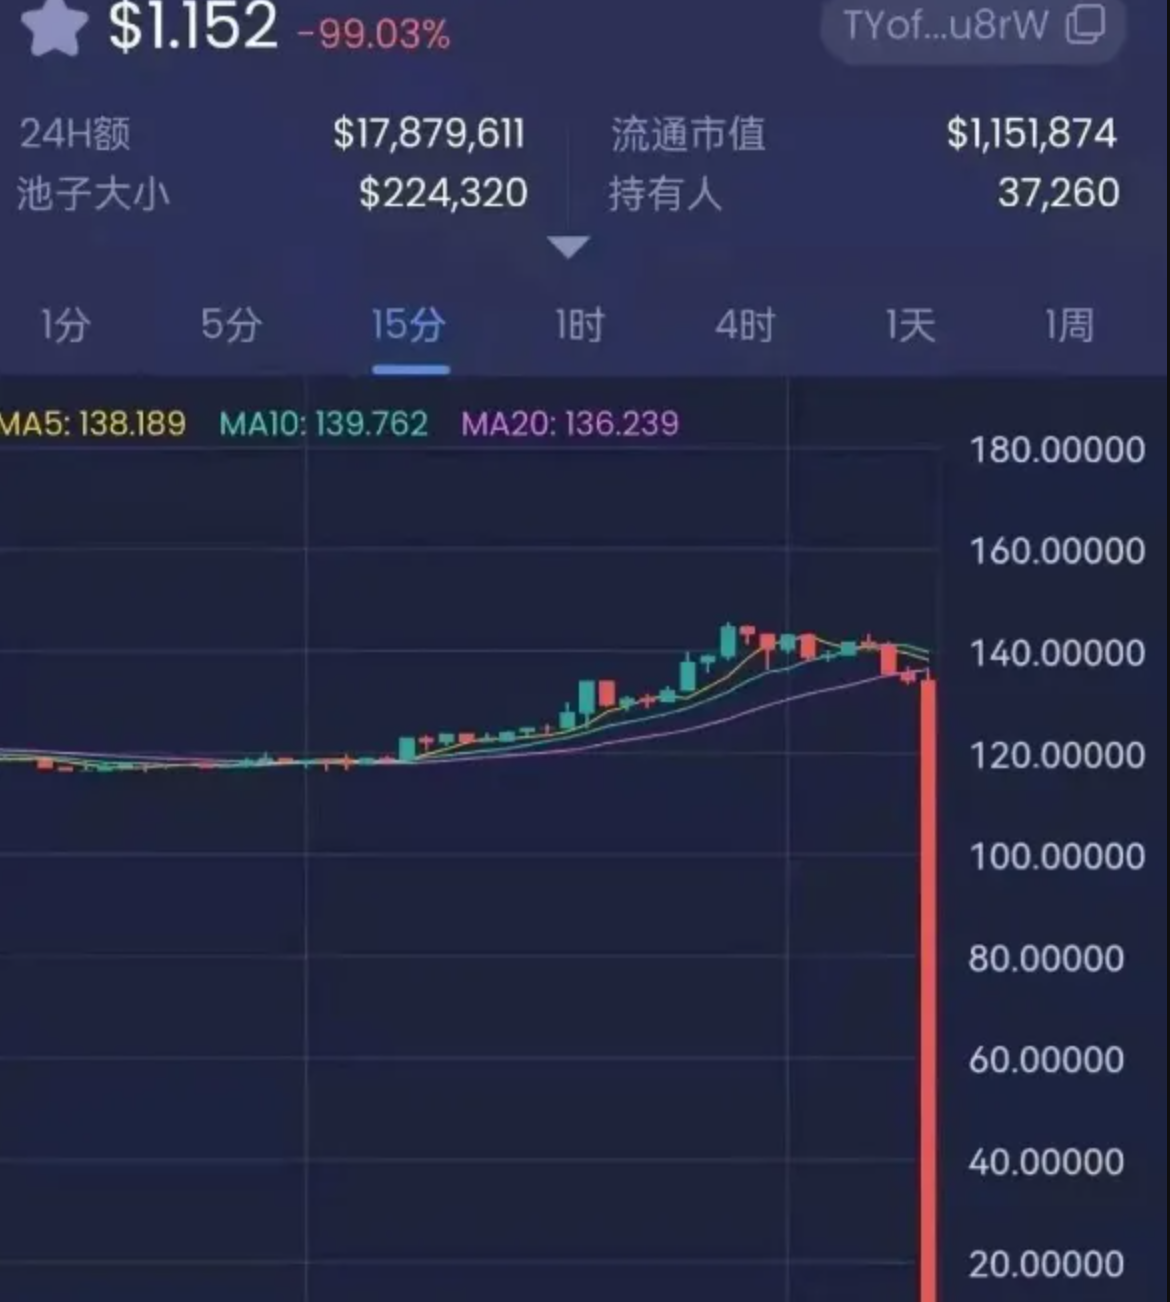
Forget about MACD golden crosses and death crosses; remember this ancestral saying: 'Catch flying knives under the waterfall, bet at the moments of needle insertion.' Last month, on the eve of Luna's zeroing out, I used this trick to turn 3U into 17U, enough to eat three days of pig's trotters in the village.
But remember to leave yourself a bullet: always keep 5U as a coffin fund. Just like my second uncle summarized after the 94 incident: 'As long as there's green mountain left, there's no worry about firewood, at least you can still top up your phone bill.'
The three realms of snowballing.
First stage (10-20U): Only trade during lunch break and at 2 AM. Don't ask why; even the market makers need to eat and sleep.
The second stage (breaking through the 50U threshold): divide the principal into red and blue parts. The red continues to battle in contracts, while the blue buys Dogecoin to store in a cold wallet—don’t look down on MEME coins; last year, I relied on this to send a 131.4 red envelope to my online dating partner on 520.
The second stage (breaking through the 100U life-and-death line): at this stage, learn to 'nurture the worm'. Open three exchange accounts, each with 30U, and let them fight each other. The last surviving account is the chosen one.
Advanced survival guide (blood and tears version).
1. When profits exceed 20U, immediately withdraw 5U and convert it to cash. Don't believe in the myth of compound interest; I've seen too many people fall on the road to withdrawal.
2. Download the National Anti-Fraud Center APP and whitelist it. Don't laugh; last year a brother was scammed 8U by a fake exchange and cried in the toilet.
3. Prepare three backup phone numbers; don't use your regular number for exchange verification codes. Don’t wait until you’re bombarded with texts to regret it.
4. Learn to buy overseas traffic packages on Taobao; it can save you in critical moments. Don't ask me how I know.
Ultimate principle: self-cultivation of the poor.
Remember these three moments:
- When you want to go all in, take a stroll in the village.
- When you want to give up, look at your WeChat balance.
- When you feel lost, think about what car your ex-girlfriend's current boyfriend drives.
You just need to grasp a few opportunities like this well.
Additionally, the most important thing is to clearly distinguish between isolated and total positions!
When it comes to contract trading, many friends’ first reaction is to use high leverage, fantasizing about 'turning 10u into 1000u overnight.'
To survive in this fierce market, it’s not just about being bold and careful, but also understanding the two basic operational modes: total and isolated positions.
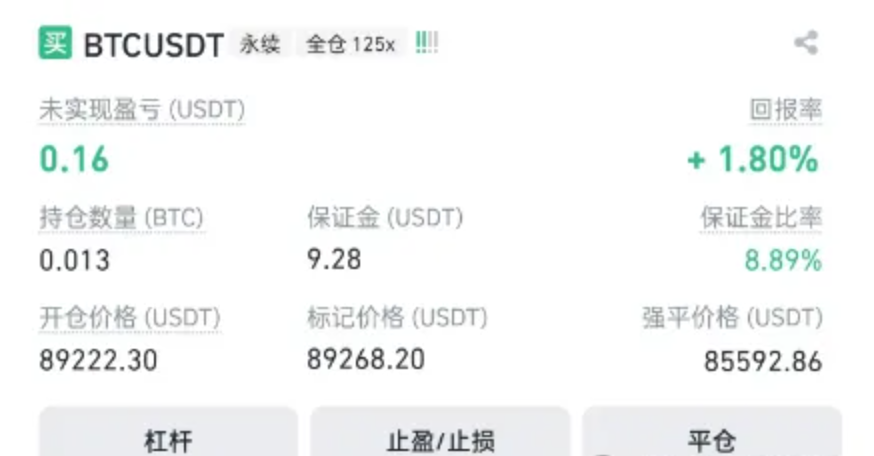
Let’s first look at a typical scenario. Suppose you used 9.28 USDT in margin to open a 125x high-leverage long position on BTCUSDT; don’t you feel like you've become a '10u war god'? But looking down, you might be shocked: wow, why is the liquidation price so low? The opening price is 89222.30, but the liquidation price is far at 85592.86. Isn't that a bit stimulating?
Don't panic; this is the charm of total position mode. Even though you only invested 9.28 USDT in margin, the other available balance in your account (like having another 40 USDT) will also act as 'support troops'. This money will help you hold on during market fluctuations, delaying the liquidation price. Therefore, in total position mode, even if the market is unfavorable, the liquidation price still won't be too close to the opening price. In other words, the idle money in your account becomes 'reinforcements', allowing you to endure a few more waves of market conditions.
So, it sounds appealing to go all in, right? With money backing you, you don't fear liquidation. Right? But don’t celebrate too early; there are also significant downsides to total positions. The 'pitfalls' of total positions are: once you are really liquidated, you not only lose the 9.28 USDT in margin but also the remaining 40 USDT in the account! In other words, one mistake could lead to you 'clearing out the account'. Imagine waking up after a night's sleep and finding your account at zero; that's a feeling not everyone can withstand!
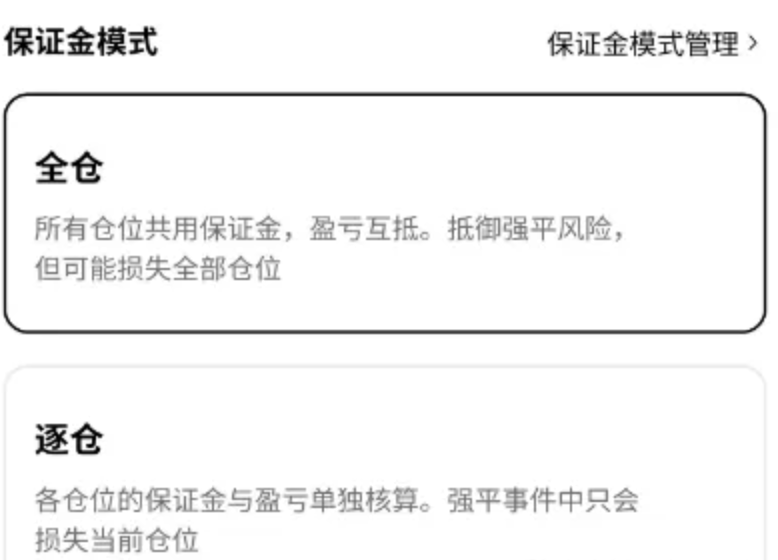
Now let’s take a look at isolated position mode. Isolated positions are easy to understand; it means that the risk of each position is isolated from each other. The margin you use to open a position is the risk you bear, and the other funds in your account won't provide a 'safety net'. For example, if you open a position of 9.28 USDT on BTCUSDT, that position only uses 9.28 USDT as margin. If the market goes against you, the liquidation price in isolated mode will be very close to the opening price, and a slight fluctuation in price may lead to liquidation—it's a thrilling ride. This mode of play may be more suitable for those who are bold and meticulous, especially those who enjoy high-risk 'extreme operations'.
Of course, the benefits of isolated positions are also clear. Even if you get liquidated, you only lose the 9.28 USDT margin for that position, without touching other funds in your account. It can be understood as a 'self-protection mode'; even if this position has issues, other positions remain intact. Therefore, isolated position mode is more suitable for friends who prefer a steady approach, helping you avoid the tragedy of 'one mistake leads to a series of mistakes.'
Can both modes be used together, having the resilience of total positions and the risk isolation of isolated positions? Hehe, don’t think too beautifully. Contract trading platforms usually set rules; for the same account and trading pair, you can only choose one of the total or isolated position modes. For example, if you open a total position mode on BTCUSDT, then in this account, BTCUSDT can only open positions in total mode. Want to switch to isolated? You must close all positions first. Therefore, whichever mode you choose, you must stick to it; switching halfway is not feasible.
Some may ask, 'If there are 40 USDT left in the account, can I still open a position in total mode?' The answer is: yes! In total position mode, all balances in the account can be used as margin multiple times. This means that the remaining 40 USDT can still be used to open new positions, either long or short. However, be aware that this means the risks are also shared. If one position triggers liquidation, the remaining 40 USDT may also be lost. So, total position mode is essentially putting all your eggs in one basket; once it flips, the whole basket breaks.
So, should you choose total or isolated positions? Actually, there’s no absolute answer; it completely depends on your trading style and risk preference. If you are an investor who prefers stable operations, isolated position mode may be more suitable for you, as it better controls the risks of individual positions without affecting the overall safety of your account’s funds. However, if you are a 'gamble' type of aggressive player who likes to use small amounts of money to seek higher returns, then total position mode allows you to utilize your account funds more effectively and withstand more market fluctuations.
Essential for cryptocurrency trading: last year, with less than 10,000 capital, I used trend lines for spot and contract trading and made over 5 million!
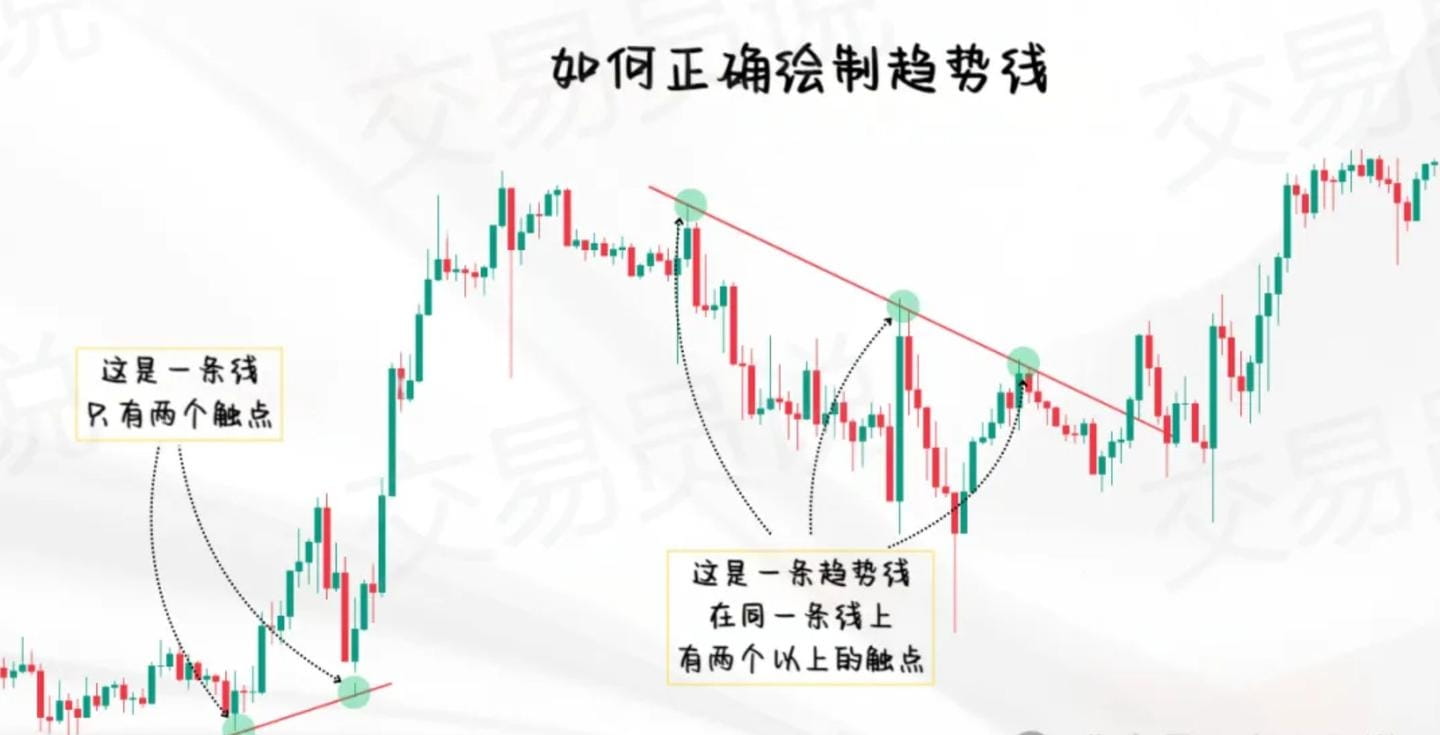
90% of people draw trend lines incorrectly! This is the correct way to draw them touching three 'volatility points' and several high-probability trading strategies.
Trend lines are one of the most commonly used forms in technical analysis. At the same time, they may also be one of the analysis tools that are not fully utilized. If you can correctly draw trend lines and support trading, their accuracy is no less than other methods. Unfortunately, the vast majority of traders cannot correctly draw trend lines.
If you are familiar with support and resistance (the most basic technical analysis patterns), understanding trend lines will be very easy. The function of trend lines is exactly the same as traditional supports and resistances, with the only difference being that supports and resistances are drawn as horizontal lines, while trend lines are diagonal lines. Apart from the direction of the lines, there is no difference at all. Let me help you better understand this with a chart.
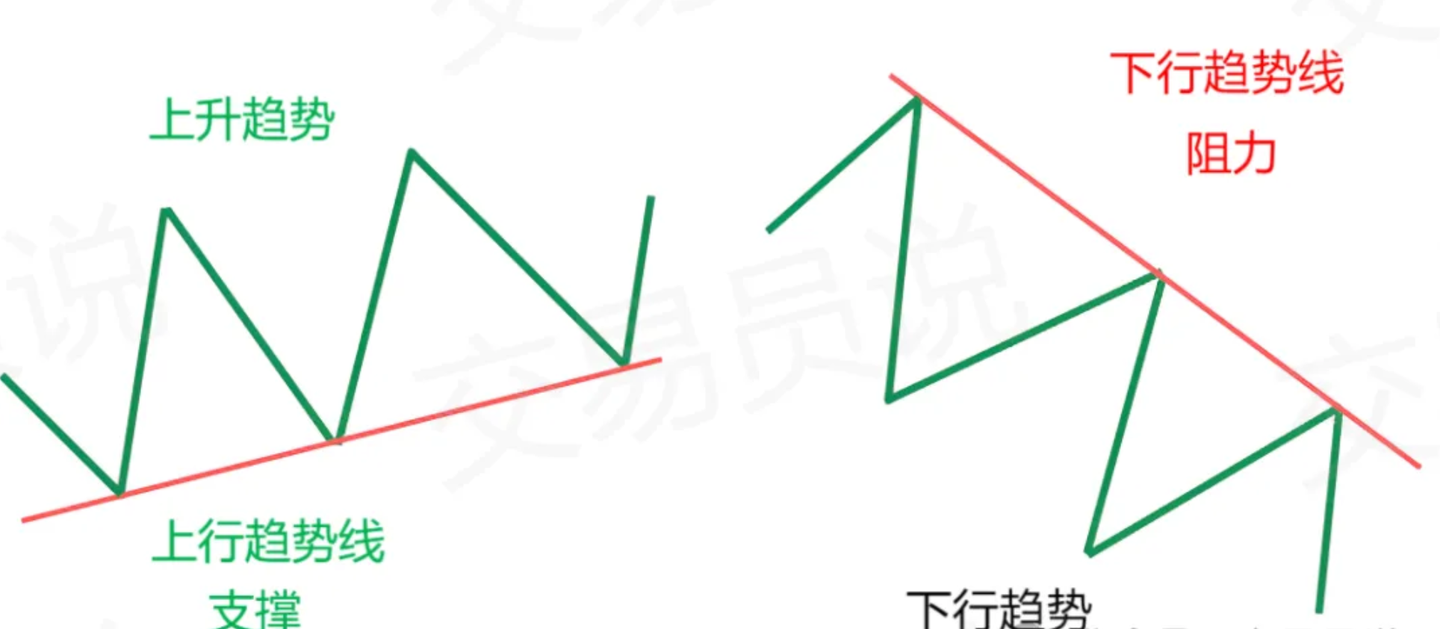
In its most basic form, an upward trend line is drawn along the bottom of easily identifiable support areas (low points). This is called an upward trend line. In a downward trend, the trend line is drawn along the top of easily identifiable resistance areas (high points). This is called a downward trend line.
How to draw trend lines.
I hope this example clarifies your understanding of trend lines, now let's continue discussing a frequently asked question about trend lines - how to draw trend lines? Honestly, it's very simple. There are many straightforward ways to draw trend lines, and each trader has their method, from drawing trend lines on volatile candlestick charts to drawing them at candlestick closing prices.
For a trend line to be considered effective, it must touch at least three points.
Today, I will show you how to use volatility points to draw trend lines.
What is a volatility point?
First, let’s understand what a volatility point is. Volatility points are basically divided into two types: volatility low points and volatility high points.
⊘ Volatility low point: When two consecutive higher lows appear on the left side of a price point, and two consecutive higher lows also appear on the right side, that point forms a volatility low point.
⊘ Volatility high point: When there are two consecutive lower highs on the left side of a price point, and two consecutive lower highs also appear on the right side, that point forms a volatility high point.
Trend lines must pass through these volatility points to be drawn.
How to trade trend lines.
Alright, this is a very simple and extremely effective way to draw trend lines. But the key question arises: how to trade trend lines? Where to enter? Where to place stop losses? How to set target prices? I will answer these one by one.
Trading trend lines is actually quite straightforward; you need to focus on:
⊘ Upward trend: You need to see at least two higher highs.
⊘ Downward trend: You need to see at least two lower lows.
You can also use tools like Fibonacci to assist in confirming these points, but ultimately it still relies on real-time market conditions.
Stop loss settings:
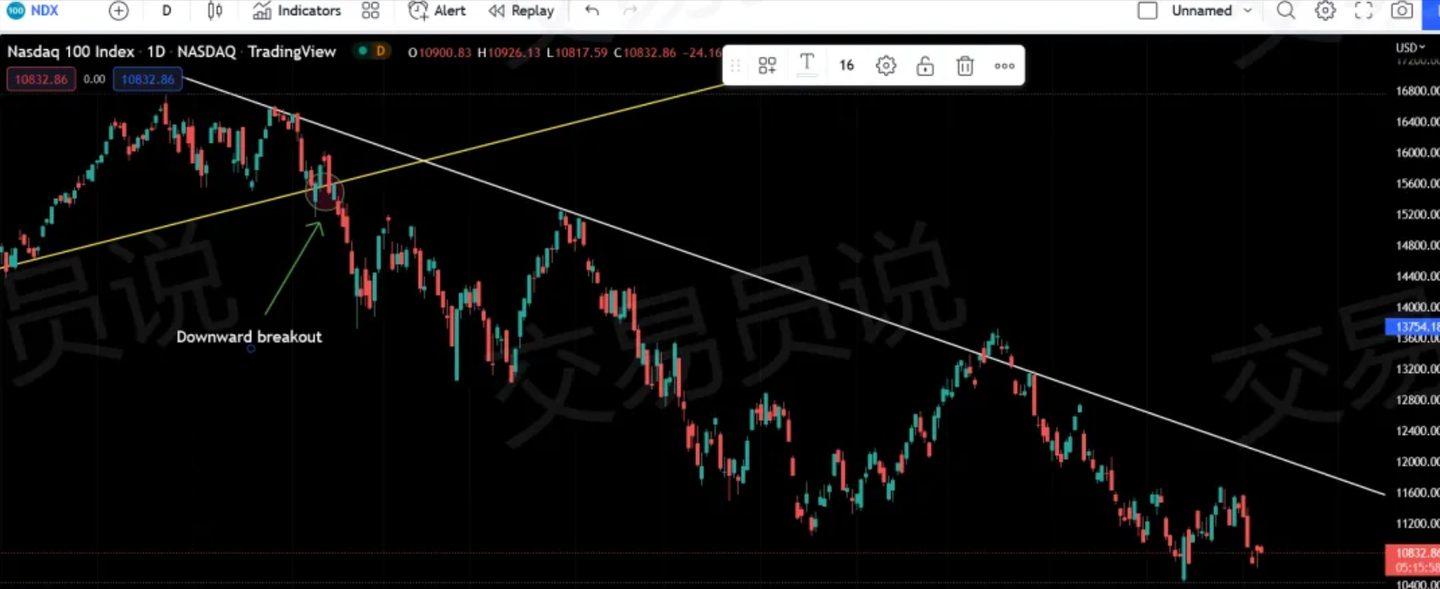
⊘ If it is a downward trend line breakout (upward breakout), the stop loss should be placed below the volatility low point.
⊘ If it is a breakout of the upward trend line (downward breakout), the stop loss should be placed above the volatility high point.
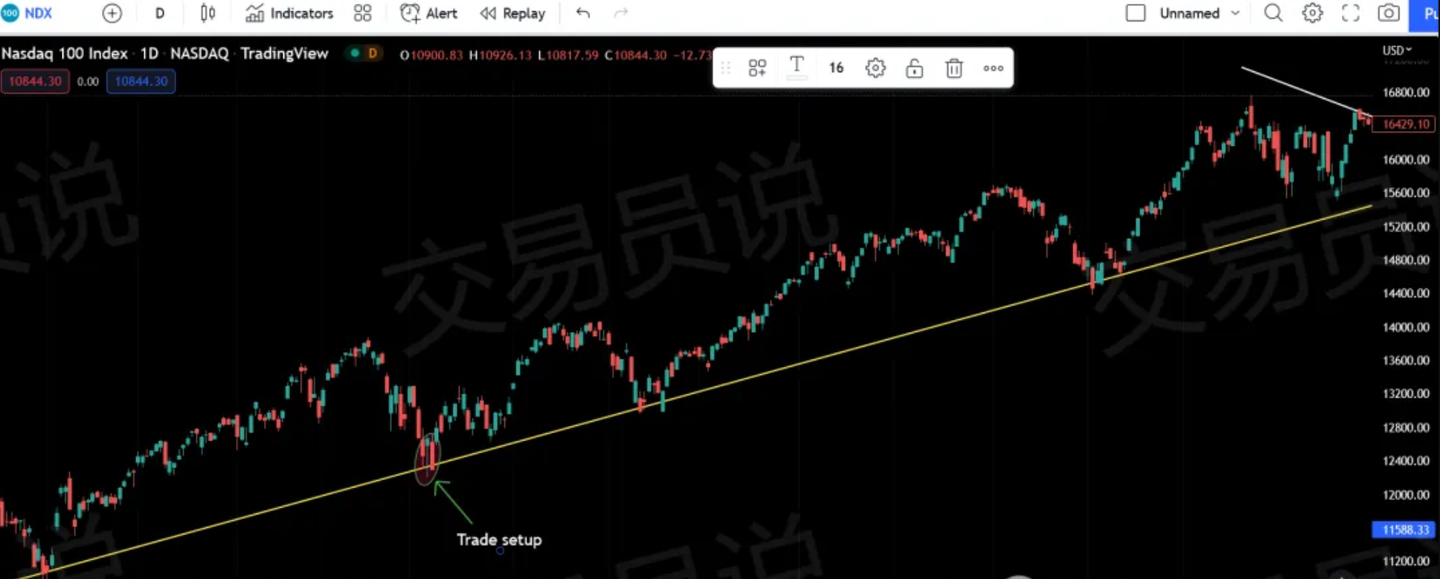
Take profit is divided into two parts:
⊘ Set the first target at the starting point of the trend line (whether it is upward or downward).
⊘ Set the second target at the 161% Fibonacci retracement level.
Types of trend lines.
There are three types of trend lines:
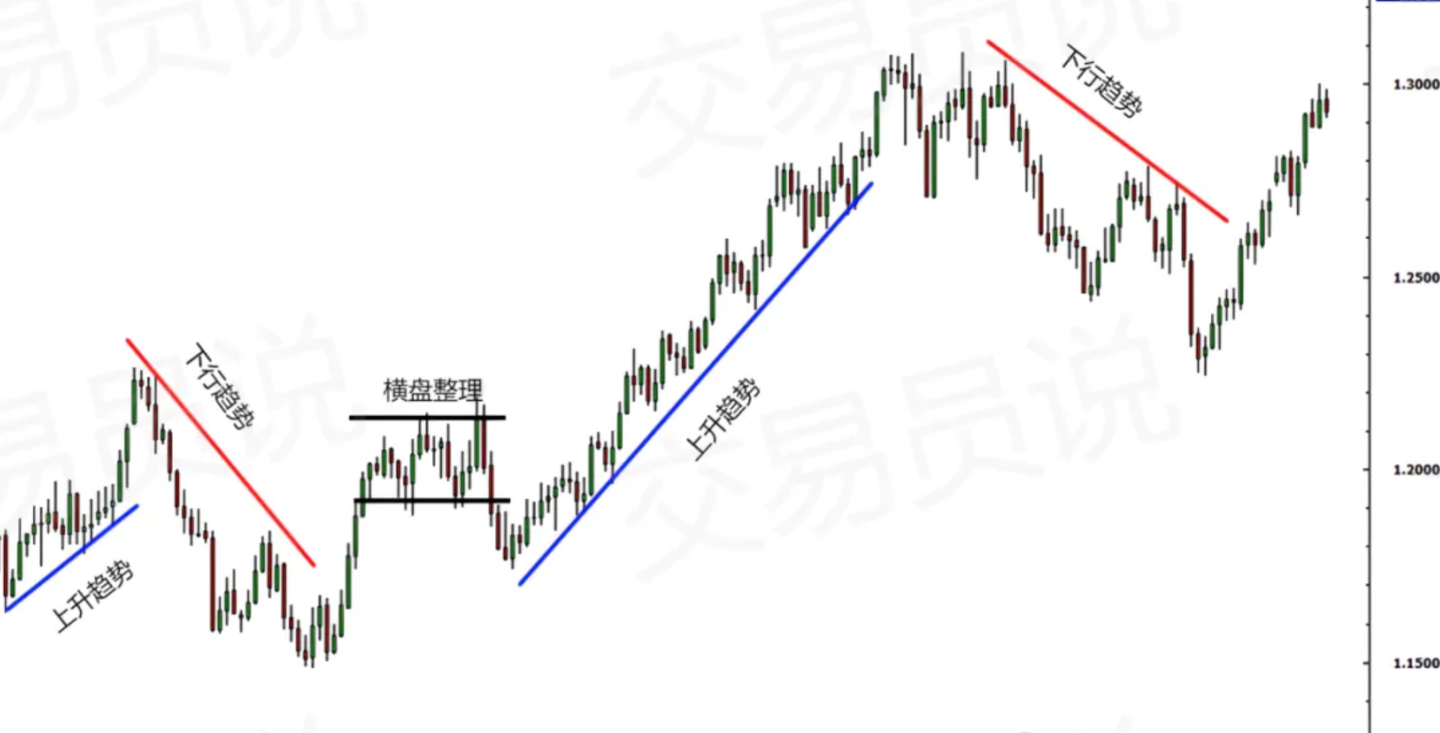
1. Upward trend line (low points continuously rising).
2. Downward trend line (high points continuously lowering).
3. Sideways trend line (range fluctuation).
Key points to remember about trend lines:
1. At least two highs or lows are needed to draw an effective trend line, but a third point is needed to confirm the trend line.
2. The steeper the trend line, the lower its reliability, and the greater the probability that it will be broken.
3. Just like horizontal support and resistance levels, the more times a trend line is tested, the stronger its role as support or resistance.
4. Most importantly, never force the trend lines you draw to fit the market. If they do not match the market trend, then the trend line is invalid.
How to use trend lines for breakout trading?
Trend lines are one of the most common methods in technical analysis. This method is actually quite intuitive, but once you know how to utilize it, it becomes a very powerful tool.
Trend lines represent strong support or resistance levels, so if this market structure is broken, significant breakouts may occur.
To capture trend line breakouts, we recommend using the closing price confirmation method. This means that you should not only look at whether the candlestick breaks through but also whether the closing price of the candlestick breaks through the trend line.
Because prices often pierce trend lines, but closing prices still adhere to the trend line; this is a common false breakout. Impulsive traders can easily fall into this trap.
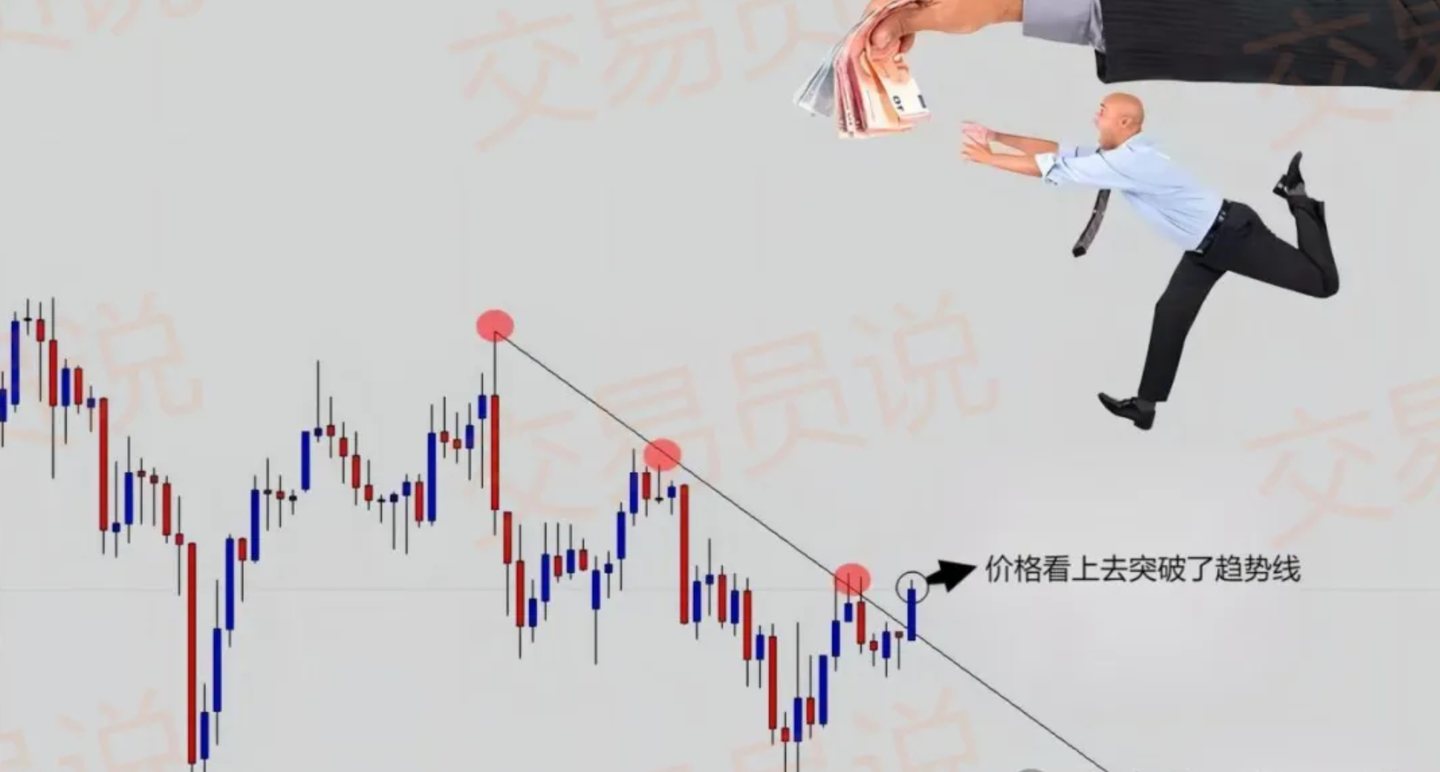
Once the price breaks the trend line, many traders immediately enter the market, hoping to seize the opportunity as soon as the breakout occurs. The problem here is that this candlestick has not actually closed yet...
These early-entering traders paid the price for their impatience. It’s important to know that temporarily breaking through a trend line is very common; it will quickly revert back. Therefore, trading on current breakouts is quite risky. If you pay attention to the closing prices of candlesticks, you'll have a higher likelihood of identifying true breakouts.
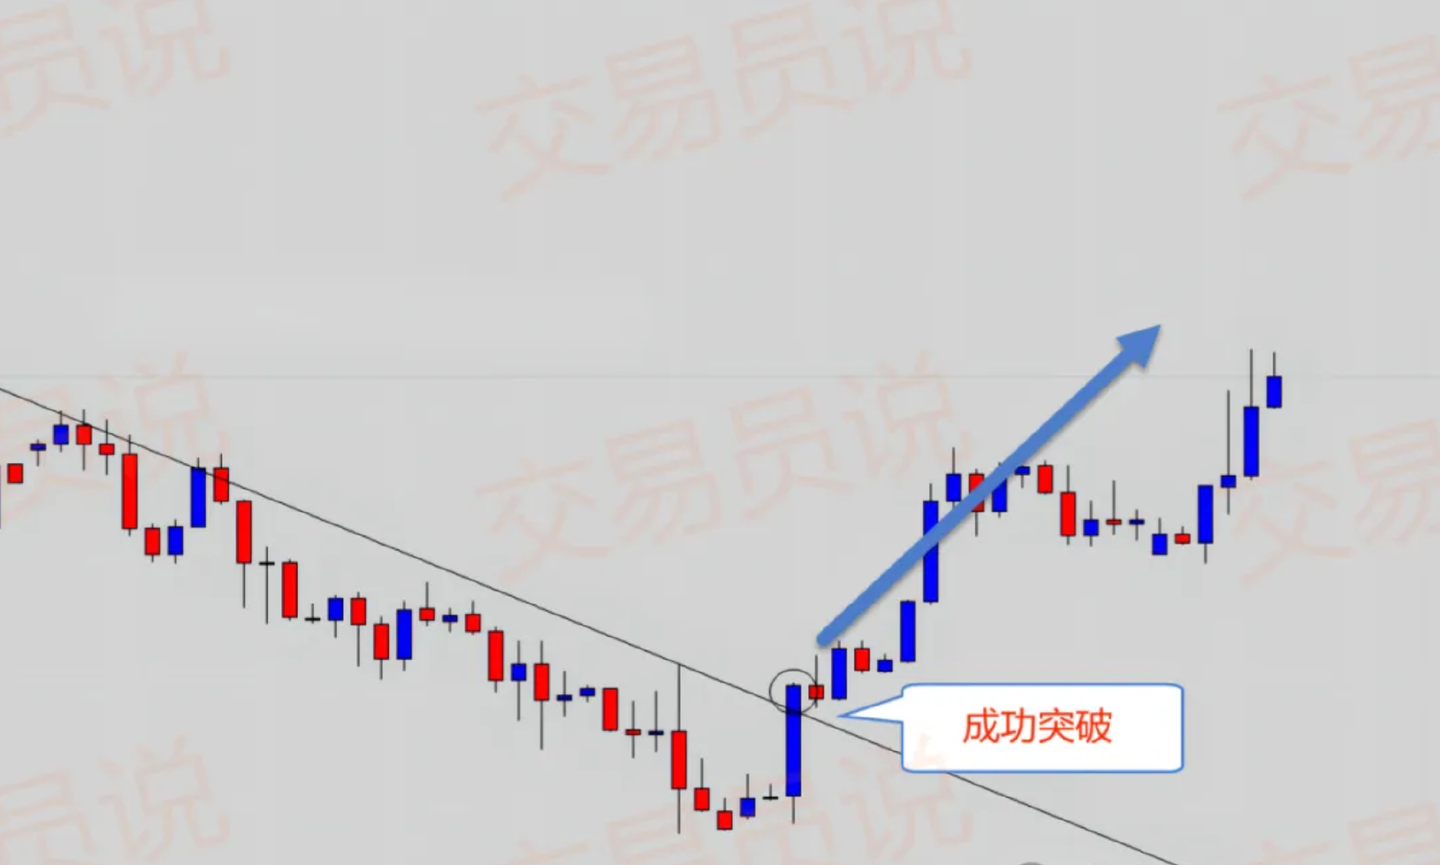
You can see that this candlestick has truly broken the trend line, indicating that the price will successfully break through next.
Other examples of trend line trading strategies.
Traders can use various trend line trading strategies. Here are some of the most common strategies:
✍ Trend following strategy: This type of strategy is typically used by trend followers based on price action. A typical practice is to utilize breakouts of trend lines or local support/resistance levels to identify the emergence of new trends, then use trend lines to mark the new trend and move the take-profit levels during the trend continuation.
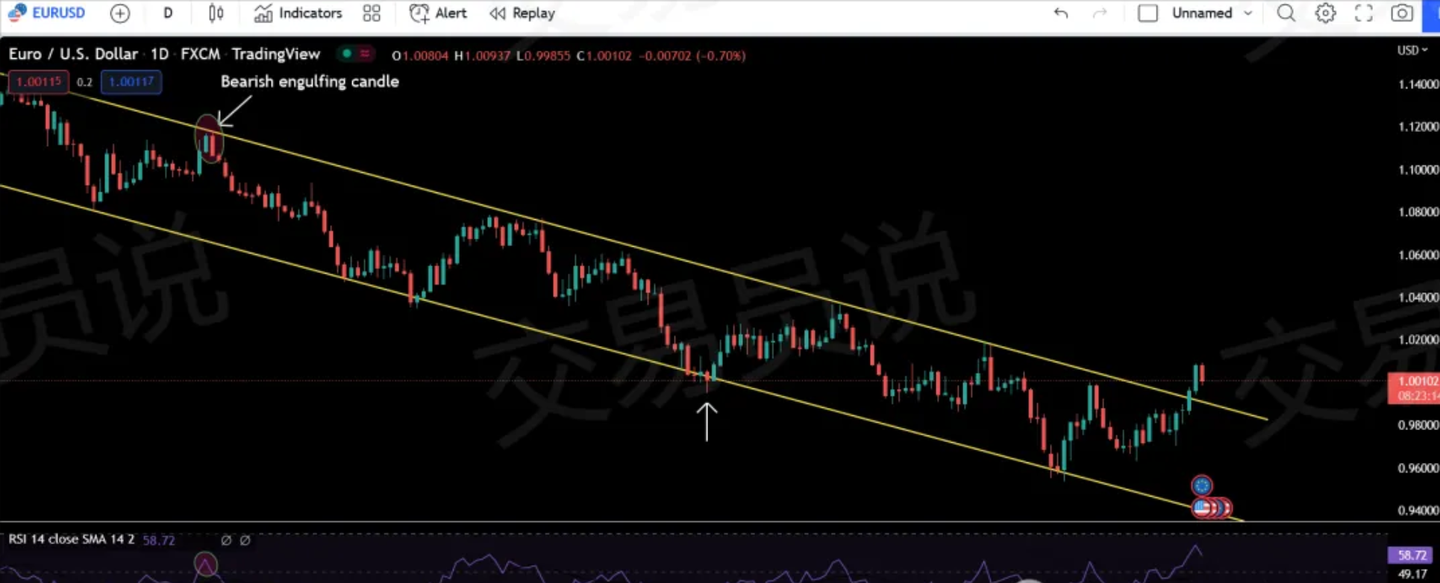
✍ Trend line pullback rebound swing strategy: This is a swing trading strategy belonging to pullback reversals. Traders wait for the price to pull back to the trend line and then rebound, entering in the direction of the trend. The entry trigger signal is usually a reversal pattern of candlestick combinations, such as hammer lines or engulfing patterns. The take-profit target is usually set at the next resistance level.
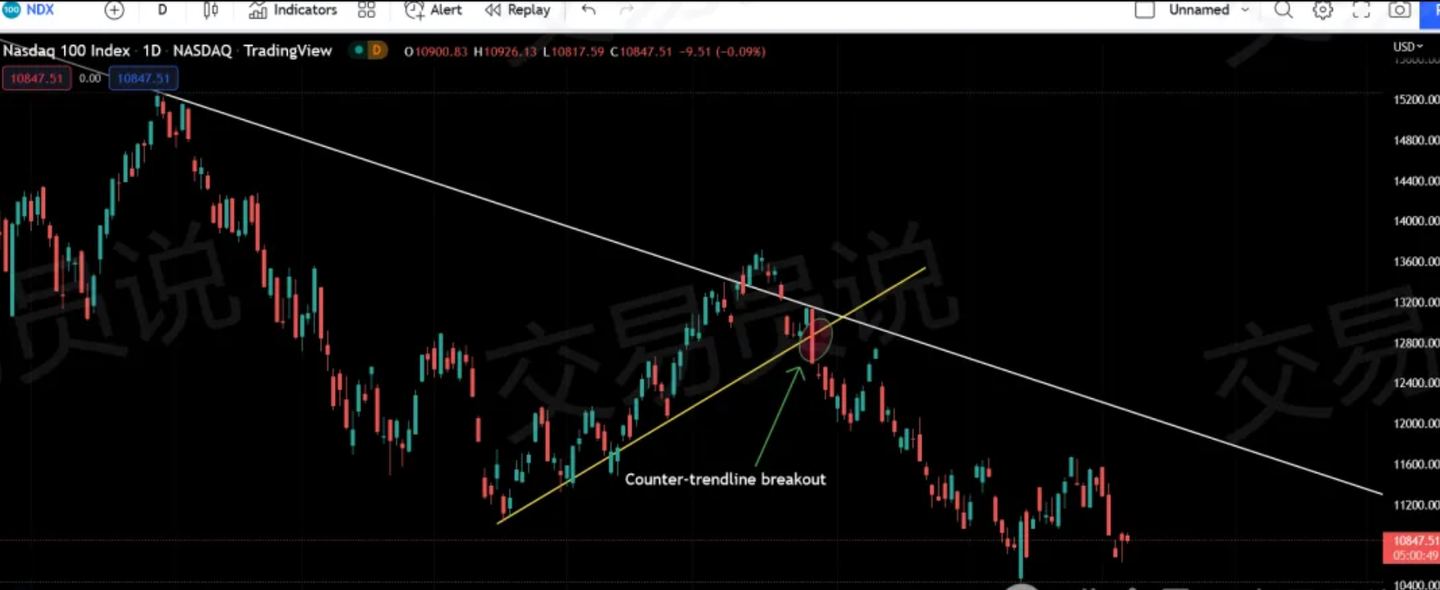
✍ Counter-trend line breakout strategy: In this strategy, traders draw a short-term 'counter-trend line' during price pullbacks. When the price breaks through this counter-trend line in the direction of the trend, it is considered an entry signal.
✍ Price channel strategy: This is a swing trading strategy where traders aim to trade each segment of volatility within the price channel. The price channel is formed by connecting swing lows and swing highs with two trend lines. When the price rebounds near the channel trend lines, trading opportunities arise. Typically, reversal candlestick patterns are used as entry trigger signals.
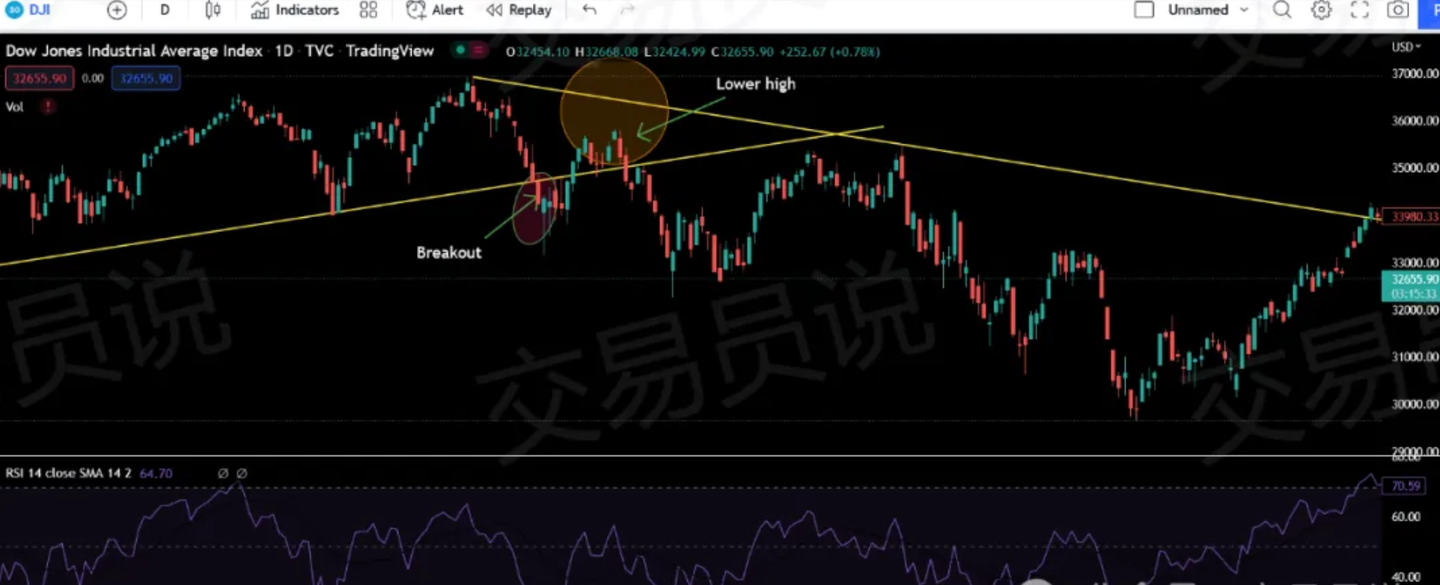
✍ Trend reversal breakout strategy: In this strategy, traders determine the possibility of a trend reversal through the breakout of the main trend line. Since false breakouts are common, traders need to further confirm whether the trend has truly changed. Confirmation may include, for example, when an upward trend line is effectively broken, and a lower volatility peak appears, which can serve as additional evidence of a trend reversal.
Conclusion.
Trend lines can be said to be one of the most powerful trading tools. When used correctly, trend line strategies can be very profitable. Many successful subjective traders rely on price action for trading, and trend lines are one of the key tools in their analysis. There are various strategies related to trend lines; one of them is to trade on rebounds when prices approach the trend line. This is a strategy similar to 'mean reversion': when prices deviate too far from their average level, they will attempt to return close to the average.
One challenge of trend line strategies is that they are difficult to code into trading algorithms, making them harder to quantify. However, they can still be systematized for trading and can yield considerable profits when executed correctly. What truly decides whether a strategy is profitable is the trader's execution quality and the risk management system employed.
Additionally, if executed properly, trend line trading can be effective in any time frame, as prices can form trends in any period. Therefore, the time frame a trader uses mainly depends on their trading style. However, the only way to determine the best time frame for a specific strategy and market is through backtesting. Only through backtesting can you find out which time frame is best for that strategy.
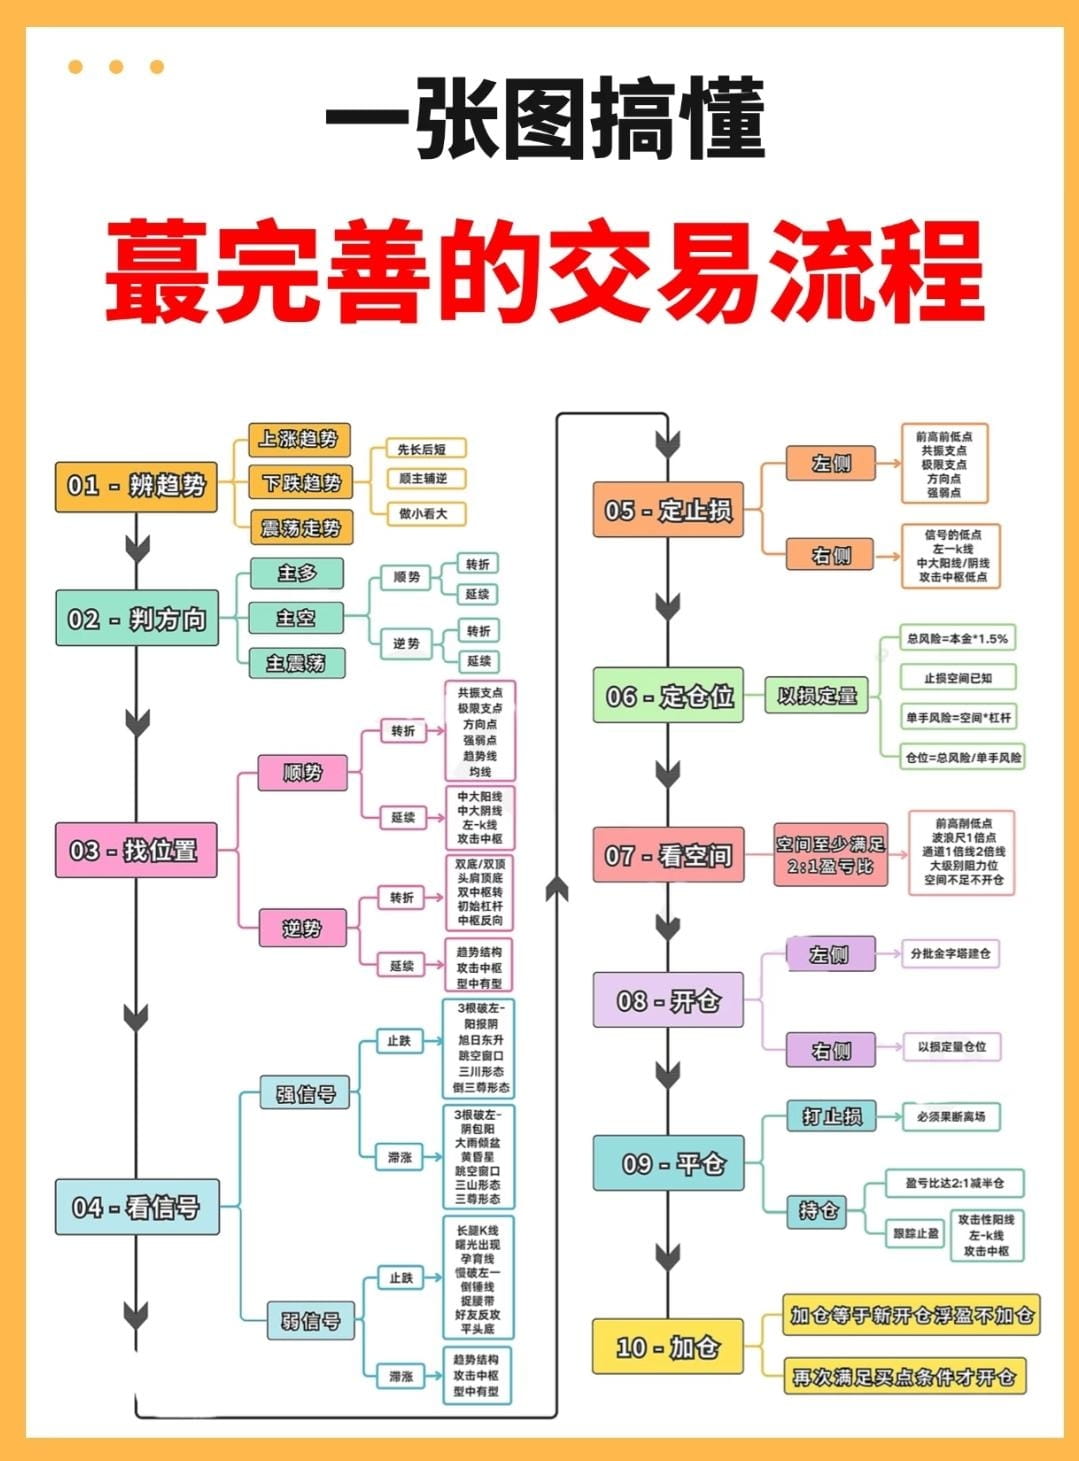
The trading processes summarized by 100 trading experts!
It is said that this trading process has created multiple billionaires, and many big players in the cryptocurrency circle are learning to apply it, making it very suitable for newbies.
Core process:
1. Determine the trend.
2. Determine direction 3. Find position 4. Look for signals.
5. Set stop losses.
6. Set positions.
7. Look for space.
8. Opening a position.
9. Closing position.
10. Adding to the position.
Based on the above standards, establish your own trading model. Lead the trading instead of being a slave to it!
30 cryptocurrency concepts that newcomers must master; first learn not to lose, then think about making money!
1. Trading operation types (understanding the logic of 'buying, selling, losing, earning').
Opening/closing positions.
The 'start and end points' of trading:
Opening a position = the first time buying coins (for example, if you bought 1 BTC today, that’s 'opening a position').
Closing position = selling all the coins in hand (for example, if you sell BTC next week, that’s 'closing position').
Bullish/bearish.
Your perspective on the price of coins:
Bullish = optimistic (expecting a rise, so buying to profit from the price difference).
Bearish = pessimistic (expecting a decline, selling first and buying later to profit from the drop).
Going long/short.
Turn ideas into actions:
Going long = buying coins (buy when bullish).
Going short = selling coins (borrow coins and sell when bearish).
The two main ways to trade in the contract market.
Leverage/liquidation.
Leverage = borrowing money to increase positions, using small amounts to leverage large returns (which also amplifies risks).
Liquidation = market reversal, margin fully consumed, position forcibly cleared.
Contracts/spots.
Spot trading = real buying and selling.
Contracts = betting on prices, not holding physical assets, only profiting from the price difference.
Simply put: spot trading is buying coins, while contract trading is buying expectations.
T+O/T+1.
T+0 = buy and sell on the same day (common in the cryptocurrency space).
T+1 = buy today and sell tomorrow (like A-shares).
Building positions/increasing/reducing positions.
Building positions = the first time buying.
Adding to the position = continuing to buy.
Reducing positions = selling part.
Controlling positions is the way to survive in the cryptocurrency space.
Take profit/stop loss.
Take profit = sell when the price reaches the target.
Stop loss = cut when the price hits the preset level.
A good tool to guard against greed and fear.
Averaging down/Bottoming out.
Averaging down = buying more as prices drop to reduce costs.
Bottom fishing = betting that the drop has hit the bottom and rushing to get on board (often leads to losses!).
Rally/dumping.
Rally = main players buying wildly to push up prices.
Dumping = main players selling fiercely to lower prices.
Common during the 'market maker washing' phase.
Market making/listing orders.
Market making = providing liquidity by placing orders on both buy and sell sides.
Listing order = setting a buying or selling price in advance and waiting for others to complete the transaction.
Forced liquidation/forced redemption.
Forced liquidation = system forced liquidation, preventing liquidation.
Forced redemption = the project party forcibly redeems tokens or assets.
OTC/On-market trading.
OTC = over-the-counter trading (like WeChat/Alipay trading USDT).
On-market = transactions completed within the exchange using matching systems.
Locking/unlocking positions.
Locking positions = temporarily restricting sale.
Unlocking = releasing after expiration, can be traded freely.
Transaction fees/slippage.
Transaction fees = fees charged by the trading platform for each transaction.
Slippage = the difference between the order price and the actual transaction price.
2. Price fluctuation types (understanding the ins and outs of 'rising, falling, washing, exploding').
Bull market/bear market.
Bull market = prices surge, everyone profits.
Bear market = prices plummet, everyone lies flat.
Market activities cycle back and forth, and emotional cycles are equally important.
Sideways/oscillation.
Sideways = price remains relatively stable.
Volatility = dramatic upward and downward fluctuations, most easily 'cut'.
Main players/retail investors.
Main players = wealthy individuals with strong trading capabilities.
Retail investors = blindly following trends, small investors who are harvested.
In summary: the main players eat meat, while the retail investors drink soup.
Market makers/retail investors.
Market makers = those who control the chips and manipulate prices.
Retail investors = ordinary players who can only go with the flow.
Bull pullback/bear rebound.
Bullish pullback = a short-term correction during an uptrend.
Bear pullback = a false rebound during a downtrend, often a trap for offloading.
FOMO/FUD.
FOMO = Fear of Missing Out, entering the market at high prices.
FUD = Fear, Uncertainty, Doubt, leading to panic selling.
Market capitalization/circulation.
Market capitalization = coin price × circulation.
Circulation = the amount of coins that can be traded freely in the market.
New coin listing/removal.
New coin listing = new coin goes online on the exchange.
Delisting = removed due to violations or lack of trading volume.
Rally/sharp drop.
Sharp increase = rapid price surge within a short time.
Sharp drop = sudden collapse, evaporating capital.
Famous scenes in the cryptocurrency space: a daily fluctuation of 30%.
Depth.
Order book = transaction list showing buy and sell orders.
Depth = the thickness of the buy and sell orders, representing liquidity strength.
Three, project and ecological types (understanding 'where the coins come from, what fuels the project').
Public chain/private chain.
Public chain = anyone can participate (like Ethereum).
Private chain = limited to internal use (enterprise-level blockchain).
Airdrop/candy.
Airdrop = project party sending money to attract fans.
Candy = another term for airdrop, often small rewards.
Token.
Token = digital assets on the blockchain.
Token = emphasizes liquidity, a broader version of a digital asset.
Mining/staking.
Mining = providing computing power or liquidity to earn rewards.
Staking = locking tokens to earn interest or governance rights.
DAO/DeFi.
DAO = Decentralized Autonomous Organization.
DeFi = decentralized finance, freeing oneself from traditional banking.
On-chain / off-chain.
On-chain = data written to the blockchain, immutable.
Off-chain = stored in external systems, fast but not transparent.
NFT/GameFi.
NFT = unique digital collectibles.
GameFi = game + finance, issuing coins through a play-to-earn method.
Public offering/private placement.
Public offering = financing from the public.
Private placement = financing only for specific groups.
Many early-stage projects in the cryptocurrency space follow the private placement route.
If you are still struggling in this liquidation cycle, force yourself to accomplish these three points first:
1: Reduce trading frequency:
2: Strictly execute stop losses.
3: Do not let any small losses spiral out of control.
If you still feel lost in the market and don't know how to plan your next step, I am here to share more specific strategies and mindset management methods with you. Opportunities are right in front of you; as long as you take the initiative, we will have stories to tell.
Investing is like cultivation; besides holding firm to your investment philosophy in the face of drastic market fluctuations, you also need to develop a simple and easy-to-follow profit model. However, many retail investors don't know where to start. There are both fish and fishing, compiling solutions for frequently encountered problems in spot trading, contracts, etc.: (Essential skills and learning materials for traders). I hope fans can find methods suitable for themselves and help establish a clear and effective trading system.