Filled in the last mid-term indicator - VIX
Combining stablecoin market capitalization, ETF AUM, and the VIX index
At the beginning, I still give my own opinion first
Currently, cryptocurrency cannot really be called a bear market; it can only be considered a correction in a mid-term bull market
It belongs to the mid-stage washout + turnover + deleveraging phase
The previous posts have already analyzed the stablecoin market capitalization and AUM; today we focus on VIX
1. VIX
VIX, also known as the fear index, mainly comes from S&P 500 index options, and is the market's expectation of the volatility of U.S. stocks over the next 30 days
Note that this is a prediction, a viewpoint on the future
We all know that cryptocurrency has a strong correlation with the risks in U.S. stocks, especially technology stocks and growth assets.
I remember that the 'Insider Brother' who shorted in advance on 10.8 later explained his bearish reasons on Twitter, one of which was this observation of U.S. technology stocks.
The reason is that before 10.8, technology stocks had already shown risk warnings.
Of course, whether that incident was insider information is not the focus today, but theoretically using VIX as an inverse indicator for crypto is a historically valid experience.
Here, the VIX has several key data points: 15, 20, 25; a simple judgment is:
Below 15 is a bull market.
15-20 the market is prone to fluctuations, starting to find direction.
20-25 is basically weak.
As for above 25, it is a bear market
But in reality, the VIX is very volatile; a sudden event can pull it from 15 to 50, so the mid-term data is more meaningful.
2. Verification
As usual, let's first verify the validity of this data.
The yellow line represents three key points of the VIX.
The blue line represents recent key fluctuation days of BTC.
The red line represents the approximate trend after key fluctuation days of BTC.
(I hope all teachers can help me by liking or giving some business tips, so I can get a membership and add BTC, without having to draw it manually.)
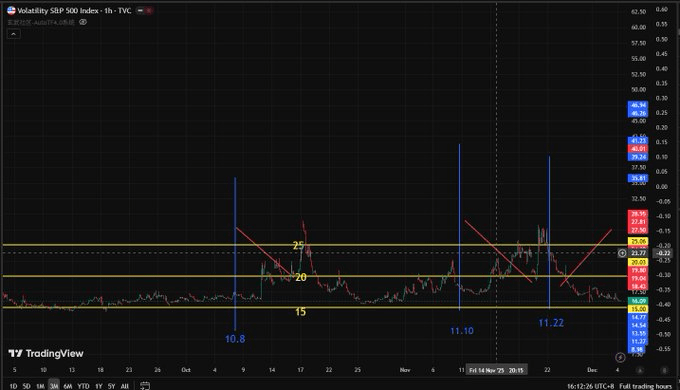
In fact, if you look closely at the chart, you can clearly see that the inverse relationship between VIX and BTC is quite apparent, with three key dates being effective inverses.
But more importantly, I found:
Before the plunge of BTC on 10.8, the VIX had indeed started to show a gradual upward trend, but the trend was not obvious.
Similarly, the new round of BTC adjustment on 11.10 lagged behind the market reaction; it wasn't until around 11.13 that it started to rise.
Only on 11.12 did it coincide with the BTC market time.
In other words, from a mid-term perspective, the VIX indeed has a good probability of being an inverse indicator, but the short-term judgment shows a delay, making it ineffective for short-term predictions.
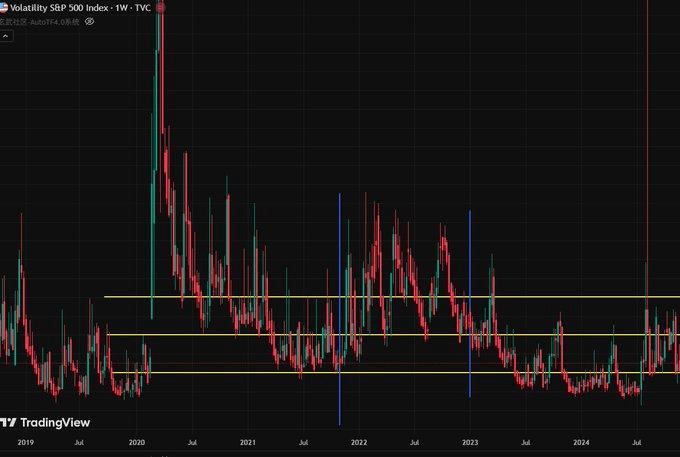
3. Reference for bear and bull markets
I mentioned earlier that the current market is far from being called a bear market.
If it were a bear market, one could look at the VIX in 2022; at that time, the VIX was completely hovering above 25, occasionally dropping to 20 but immediately rising again.
This is completely different from the current situation; now it is at least wandering between 15 and 20.
Conversely, looking at the bull market from April to October this year, the VIX dropped from 50 to below 15.
The highest point in the chart was in March of this year; the VIX first touched 25 in April, while BTC was in a positional fluctuation that month, clearly indicating the market was waiting for a signal.
As the VIX touched the 25 line in April and began to adjust downward, BTC started its largest bull market of the year.
4. Comprehensive judgment of mid-term indicators
Therefore, when the market direction is unclear, it is better to rest more and check my wellness posts.
In a bull market, going long can make money; in a bear market, going short can also make money. When there is no signal in terms of dimensions, hard operations are the easiest way to lose money.
I mentioned in previous posts that judging the market based on a single indicator is not accurate; it is only by combining them that we can improve our probability of judgment.
To summarize the previous analysis of mid-term indicators
The market value of stablecoins is steadily rising, currently still at a new high of 268.9 billion, indicating that on-chain funds have not fled, at most just holding USDT and waiting to buy the dip.
From the perspective of stablecoin market value, the market is not bearish; 80,000 is far from the bottom of a bear market.
The AUM of ETF positions showed a significant decline after 10.8, reaching the lowest scale at 11.25, but has recently started to recover, albeit very slightly.
From the ETF perspective, the possibility of continued adjustment is relatively high.
The VIX hovers between 15 and 20 and has already dropped below 17.5 twice since 11.25.
So currently the judgment on the market is that it is in a bull market correction period, but whether the correction has ended still needs to be observed with macro data.
As analyzed earlier, the reason for this correction is mainly due to traditional finance fleeing, which is related to ETFs.
Additionally, based on the experience from the correction at the beginning of this year, it took 2 months of downward adjustment and 1 month of volatility to produce a clear signal.
Although we cannot mechanistically demand according to this time cycle,
the obvious signals have indeed not appeared, and it is necessary to analyze the short-term data.
Let's slowly improve; the interest rate cut meeting is about to come out, and I will first improve the long-term data indicator analysis.
Over

