Every indicator is telling me
Cherish the current BTC at 8
Cherish the current ETH at 3000
Cherish the current BNB at 900
In agreement with Professor Xiao's viewpoint, crypto will be pulled very high next year.
https://x.com/Web3___Ace/status/1996509713299890635
I love pullbacks; I'm only afraid that the pullback won't be deep enough, and I'm afraid I won't have enough bullets (crying).
1. Rate cut path
Let's start with the first indicator, as the FOMC meeting is about to take place, and the rate cut meeting is about to begin.
But what I am studying here is the rate cut path, which are two completely different things.
The interest rates announced at the rate cut meeting are the rates that are about to be implemented, which are short-term indicators and have a relatively short-lived impact on crypto.
To study long-term trends, we need the rate cut paths formed by multiple rate cut meetings, including both past and future.
First, let's take a look at this month; my previous posts have analyzed the pullback of BTC to 11.25, one reason is that the market raised expectations for this month, which is about the rate cut expected in 5 days.
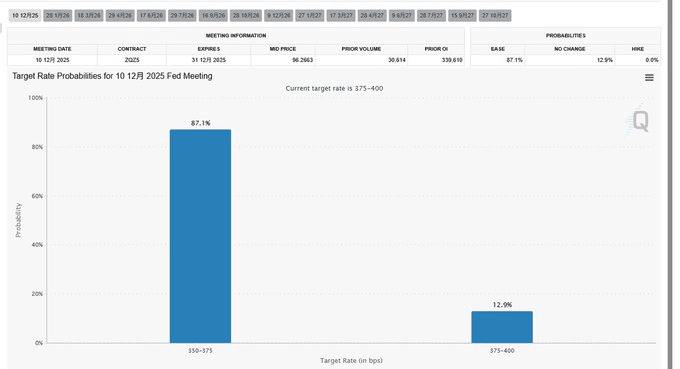
Currently, the expectation for a drop to the 350-375 range is 87.11%.
The expectation for a drop to the 375-400 range is 12.9%.
But I have written about this before, this belongs to short-term effects, and the market will also price it in advance.
When we get to the rate cut meeting in 5 days, if the good news is realized, the market may not see a significant increase, but if it cannot be realized, that would be a scary story.
But this is not the focus.
The focus is on the rate cut paths for the coming years.
Currently, the interest rate for November is 3.88; from the dot plot, it can be seen that the interest rate expectations for the coming years are all downward, and after 2028 it is expected to reach 3.
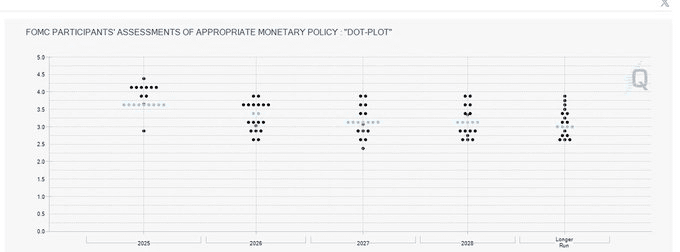
Looking back at the rate cut paths of the past few years, can you see any trends?
Since 2024, we have entered a long-term low-interest rate era, which is also the main reason why BTC performed so well in 2024.
In the coming years, the market is unanimously optimistic about risk assets!
But!
However, looking solely at the rate cut path is not enough, as it is just expectations, uncertain things; if there are any black swan events in the future, it could all change in an instant.
Relying on this single indicator cannot lead us to place heavy bets.
2. Actual interest rate
Why do bullish people in the market focus on the FOMC meeting?
Because this matter is more intuitive, easier to attract attention, and easier to speculate.
However, as I mentioned earlier, the FOMC has more impact on the short-term market, and it announces nominal interest rates, not actual rates.
How to understand nominal and actual rates? Let me give you a simple example.
Your middle school teacher assigned you 3 sets of math papers and required you to simulate an exam at home, timing yourself, scoring, and correcting errors. This is the nominal requirement from the teacher.
And how do we generally do it?
I usually get home, open the three sets of papers, take out the pre-printed answers to copy, and if I'm not careful, I might copy a few questions wrong. In the end, I score myself and correct the questions I accidentally answered wrong.
And I write that I was too careless while doing the problems and didn't get it right, promising to do better next time.
This is how I cope with the nominal homework versus the actual operation.
Interest rates are the same; Powell announces nominal rates, and these are short-term rates, but the market's reaction is most important, and we need to look at actual rates.
The difference in between is called an inflation indicator, but it's not the focus.
The theoretical explanation is complete; let's look at the data.
Looking solely at the 5-year data, 2022-2023 saw a significant surge, and that year was also a bear market for crypto.
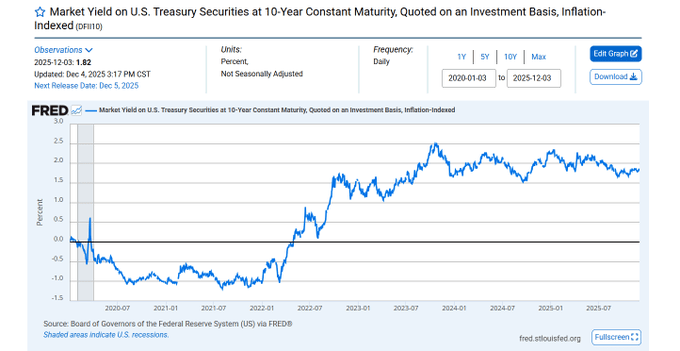
In October 2023, the actual interest rate reached its peak, starting a trend of fluctuations downward.
Carefully observing several peaks that appeared in 2024, the subsequent pullbacks correspond exactly to BTC's three waves of rise.
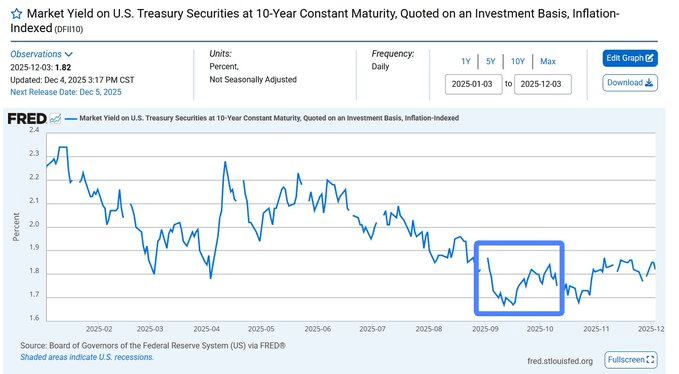
Looking solely at the actual interest rate for 2025, it can be seen that October ended the previous trend of steady decline, and it has been in a consolidation pattern since.
3. Long-term + medium-term data conclusions
So, as seen from the three medium-term data indicators earlier,
The market is currently in the pullback phase of a bull market, leaning towards optimism.
The rate cut path indicates that the coming period will be a golden age for risk assets, but is now the right time to get on board?
It needs to be viewed in conjunction with short-term indicators; we will continue next week.
From the ETF perspective, the possibility of continued pullback is relatively high
From a medium-term perspective, the crypto market still looks bullish in the future, optimistic!


