Look, my people, the Ethereum chart! 😱 If you are keeping an eye on this crypto game, you know that $3,050 dollars was not just a number, it was a wall. And what happened? BAM! They broke it, and not for the better. That's where the drama we are living starts.
The news is that the crypto market has just suffered a bearish blow that has everyone on high alert. In just one day, on December 5th, $491 million dollars in liquidations went down the drain 📉, a jump of 75% compared to the previous day! Think about that: almost half a billion dollars wiped out. And from that mountain of losses, $116 million was pure liquidation of Ethereum (ETH).
🚨 Analyzing the ETH Drama on the Chart 🚨
Shows the history of ETH divided into cycles: 2016-2018, 2018-2021, and the current one, 2022-2025.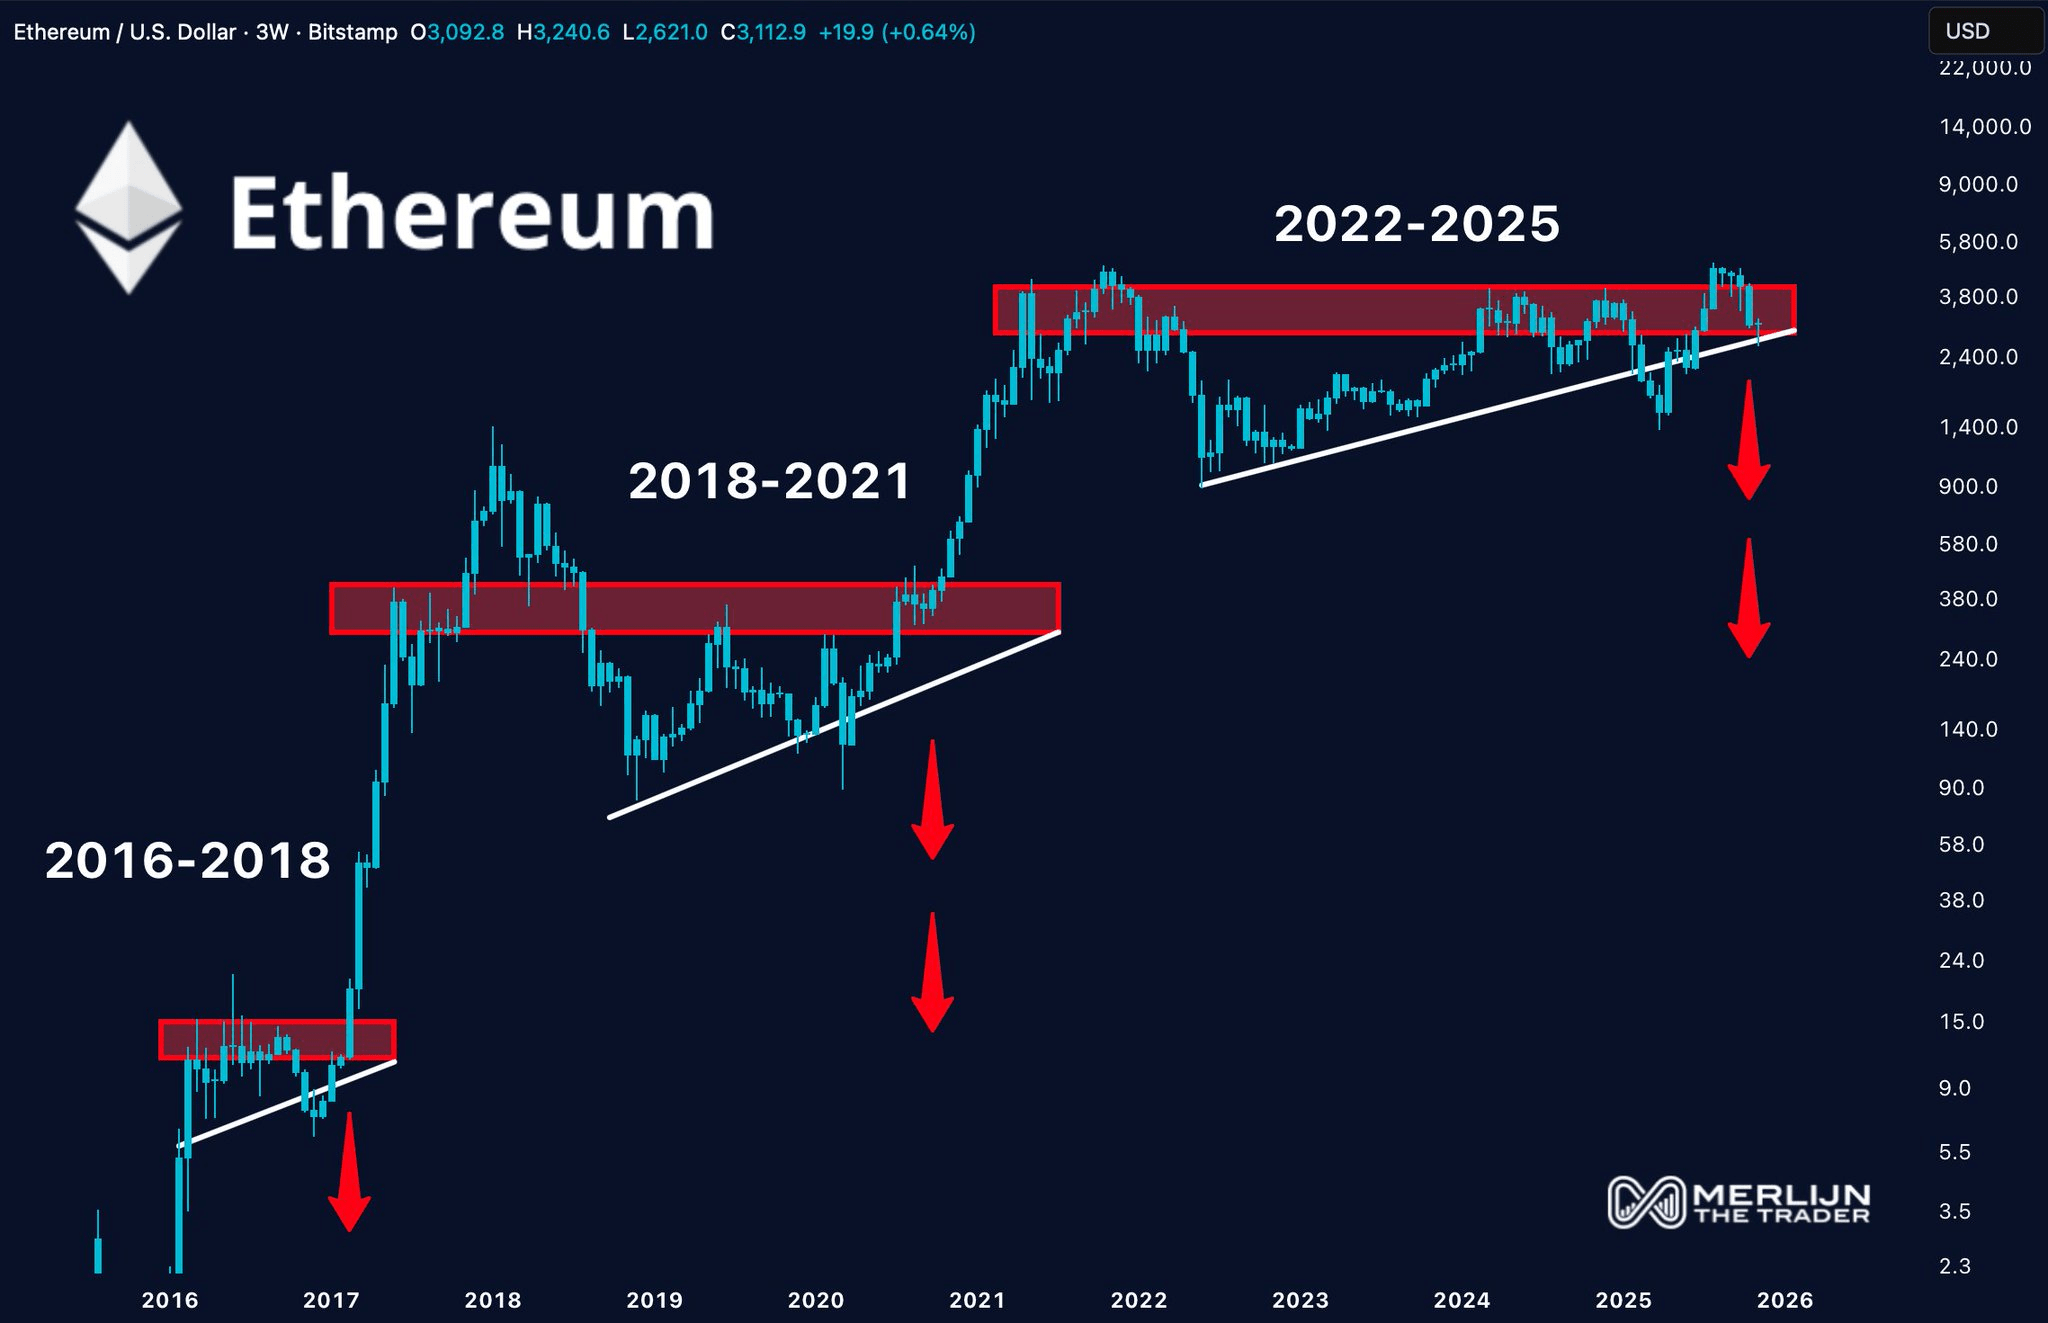
The Tension Pattern: In the three cycles, you see that the price of ETH moves within a shape that looks like an ascending triangle, with a resistance (the red line above) and an uptrend line below (the white line). It's as if it's accumulating energy.
The Breakout Point: In previous cycles, after that "tension" period, a red arrow came indicating a BRUTAL drop (a breakdown) after the price failed to hold that zone or fell below the white support line.
The Current Cycle (2022-2025): We are right at that critical point. The price has been stuck at the high resistance zone, but the recent drop broke the support. The liquidations of $116 million that we saw are the direct effect of the price breaking that $3,050 level downwards, confirming that "drop" pattern that historically repeats on the chart. It's as if the market is saying: "The party is over, at least for now."
🥶 Why Such a Drop? The Blame of Leverage
Here comes the technical part, but I'll explain it simply. Many people were playing with leverage (borrowing to invest more). The Open Interest of ETH was at $769 billion. This is like building a super tall building on quicksand. When the price started to fall, platforms forced everyone who was super leveraged to sell, and those forced sales only accelerated the drop. It was a chain reaction! 💥
Now, sentiment is at rock bottom. The famous Fear and Greed Index is at 25: "Extreme Fear". 😨 People are scared, and with good reason.
🔮 The Screensaver: The Fed
The market not only looks at what we do, it also looks at the big boss: the Federal Reserve of the USA (the Fed). Next week they have their interest rate meeting. The market has a huge hope: that the Fed gives dovish signals (market-friendly), meaning they'll lower rates or say they're going to stop raising them. The odds say there's a 93% chance of a 0.25% cut. If that happens, it could be the spark we need to stabilize and breathe. But if the Fed comes out hawkish (aggressive), hold on tight!
My advice, buddy: in these moments of liquidation and extreme fear, patience is golden. Don't trade out of panic. The market is waiting for the Fed's signal. Do you think the Fed will lend us the hand we need, or will we see the worst outcome that the historical chart is showing us? 🤔

