Day trading strategies are one of the most popular trading methods over the past 10 years. However, does this mean that day trading strategies are superior to swing trading strategies?
According to most sources, day trading is even considered gambling, and traders who adopt this strategy should rather be called 'speculators.'
It is clear, after countless data confirmations, that day trading is not suitable for everyone, which is why we need to delve into the details that help clarify how to shape your trading approach.
Since the emergence of new asset classes such as cryptocurrencies, day trading has become increasingly common, making it easier than ever to find trading opportunities.
I boldly guess that there are probably thousands of intraday trading strategies on the market, but the important thing is how to choose one that matches your 'trading personality'.
Next, we will introduce five effective intraday trading strategies for readers to read and reference.
Strategy #1: M5 Trend Following Combined with MACD Intraday Trading Strategy
This intraday trading strategy only requires three simple common trading indicators to make this trade profitable.
This is a strategy type that follows the main trend for pullback entry. The anchored chart timeframe is 5 minutes, but we will use two EMAs (Exponential Moving Averages) to gauge the larger trend.
We base the rules for setting trade direction on the EMA, while the MACD provides trading signals.
Please remember: if you modify the strategy rules, the strategy may not work as expected.
This also means that your trading must strictly adhere to trading discipline and comply with strategy rules.
 Strategy Points
You can use this strategy in any trading market (asset), such as EUR/USD, and set its trading chart to the M5 timeframe.
Add the first EMA, setting its parameters to 600 periods; this will be our primary trend indicator. The second EMA period parameter is set to 150, which is another trend indicator we will use with the EMA crossover rules.
The last point is about the MACD indicator with default parameters (Fast EMA: 12, Slow EMA: 26, MACD SMA: 9, Close). Strategy Rules
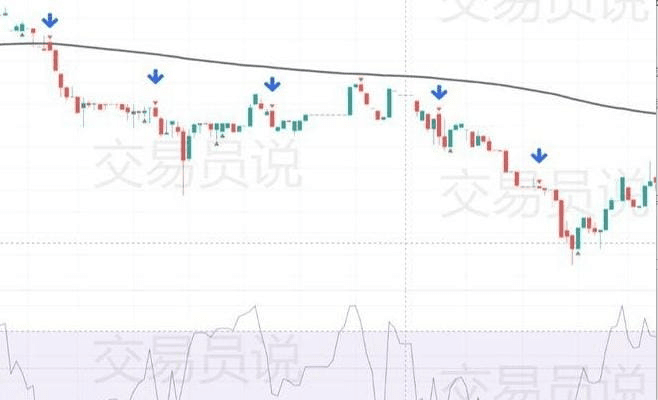
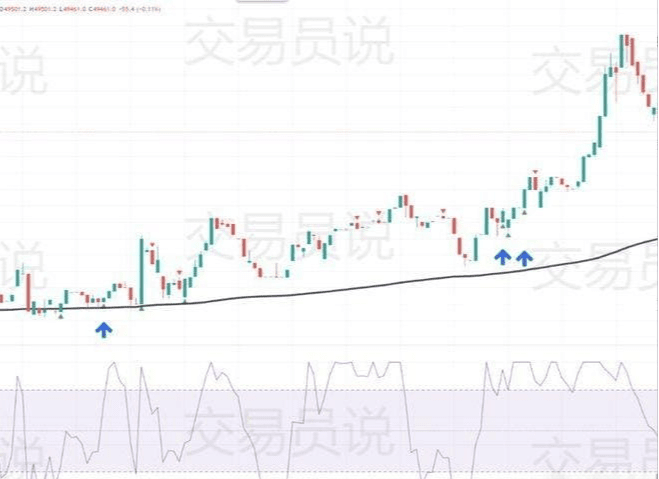
When the fast EMA (150) crosses the slow EMA (600), we only trade in the direction of the EMA crossover.
Therefore, when the fast EMA crosses above the slow EMA, we can only enter long. Conversely, when the fast line crosses below the slow line, enter short.
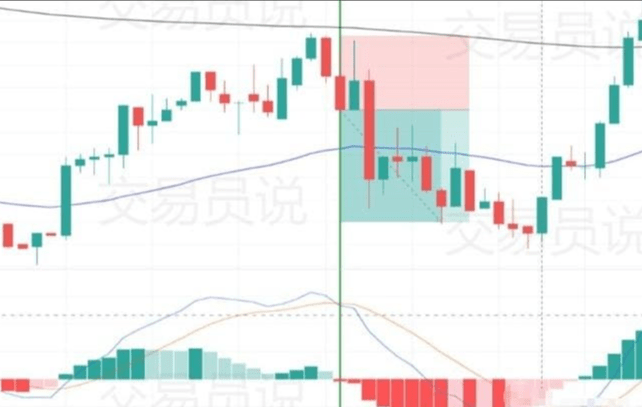
The second rule is about the MACD entry signal. To enter, the MACD line must be below the zero-axis histogram (for more on MACD, see (Finally, someone explains the 'MACD trading indicator' clearly, as very few truly understand how to use it)).
When the MACD line is below the zero-axis histogram and then crosses upwards, we have a buy signal, following the EMA rules; likewise, when the EMA crossover indicates a bearish trend, we wait for both MACD lines to be above the histogram.
Then, we trade at the MACD line crossover.
The MACD tells us when there is a good pullback entry point in already established trends, thus giving us better chances and better outcomes.
 Risk Management
Note that when market volatility is low, some signals may still occur, even if the main trend continues. Such signals should have adequate stop loss and take profit levels set.
No trade has the same stop loss and take profit distance (range).
For this specific strategy, for long trades, it is advisable to set your stop loss at the low of the previous candlestick; for short trades, find the high of the previous candlestick and set your stop loss near that level. Additionally, you can use various risk/reward ratios or use trailing stops to exit.
You can even try to take partial profits at the first take profit level while letting the other part run without limits, using a trailing stop to end. Start from 1.5 times the risk of the take profit level to see which method suits you the best.
Advantages and disadvantages
This strategy is simple but effective, easy to set up and follow. However, it is an indicator-based strategy and does not follow market structure well.
You will notice that when using the strategy, the downside may slowly accumulate when the trend changes, but the EMA will not reflect this immediately.
Additionally, when the market enters a calm state, the MACD may produce false signals.
Traders adopting this simple intraday trading strategy will add MACD divergence rules to improve reliability.
However, this significantly reduces the frequency of entry signals and makes it harder for traders to find opportunities.
Strategy 2: M30 RSI Divergence Combined with Stochastic Indicator Intraday Trading Strategy
If the market continues to perform well, you can trade on the 30-minute trading chart the next day. Following your risk management is more important than staying intraday.
This intraday trading strategy uses hidden divergence on the RSI, confirmed further by stochastic line crosses (for more on 'hidden divergence,' see (Simple and Effective Strategy: Trading 'Hidden Divergence')).
We do not focus on the overbought or oversold levels of the RSI, only looking for divergences on the chart.
This means you need to understand how to use price action points and extremes on the RSI to identify divergences (for more RSI divergence strategies, see (How to Determine RSI Indicator Divergence and Capture Maximum Trading Profits?)).
I will show you a method to easily identify hidden divergences. On average, this strategy will generate about 15 signals per month on any given trading chart.
Strategy Points
To judge the primary trend, add the 200 EMA, RSI, and stochastic indicators. The RSI and stochastic settings should be at default values. For ease of finding divergences, use a trading platform that can draw horizontal lines (like TradingView or MT platforms).
Strategy Rules
The 200 EMA will tell us when the trend structure is intact and when it is broken.
When the price is above the 200 EMA, you can enter long trades, and when the price is below the 200 EMA, enter short trades.
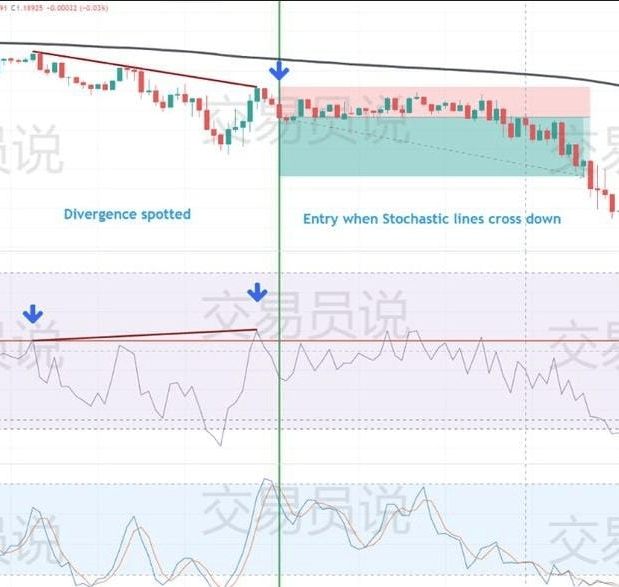
RSI divergence generates trade entry signals, which are then confirmed by the stochastic indicator. After you spot RSI divergence, only enter when the stochastic line crosses in the direction of the trend. To spot divergence, always draw a new horizontal line at the RSI lows and look for any new crosses below that line.
When a new lower low on the RSI below the horizontal line matches a higher low on the chart, that is a bullish divergence. The next step is to wait for the stochastic line to cross upwards, which is your buy signal. For short trades, do the opposite, looking for an RSI higher high that matches a lower high on the chart.
You just need to pay attention to the RSI/horizontal line crossover and confirm the divergence with the price chart.
 Risk Management
Intraday traders rarely risk more than 2% per trade on any given strategy.
For this specific strategy, place your long position stop loss at the latest swing low or the bottom of the lowest candlestick. For short positions, do the exact opposite of the above setup, which will allow you to follow the trend structure.
The take profit level should be twice the stop loss, with a total R/R ratio of 1:2. Using this risk management means you need to hit the stop loss consecutively over 2 times to incur losses. Additionally, you can decide your take profit level or use a trailing stop.
Advantages and disadvantages
Once you master the nuances of divergence, intraday trading strategies like this become very simple. More importantly, this strategy has a win rate of over 50% with a 1:2 R/R.
The downside is that you may wish to see more signals daily. One solution might be to use this strategy across multiple asset classes (but only after you have backtested it).
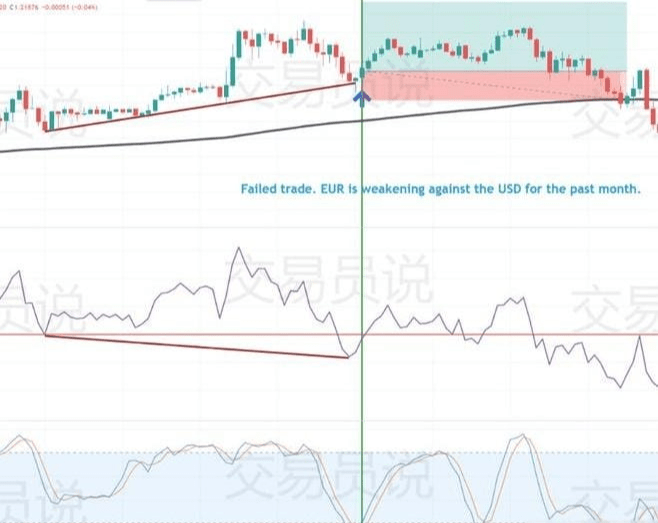
Like the previous one, intraday trading strategies work best in already established trends.
When the price fluctuates near the 200 EMA without a clear direction, the risk of loss is increasing. However, using this strategy is still very promising for obtaining high profits.
 Strategy 3: 1-Minute Scalping Intraday Trading Strategy
If you want to use a scalping trading strategy, I will show you one of the most exciting intraday trading strategies. This strategy has been tested and works (and has made money).
(For more 'scalping' related content, see (Is scalping strategy really easier to make money than intraday trading? What do you think), (Scalping trading 1-minute chart practical analysis, profits can be so fast and simple!)).
Although this strategy is suitable for major cryptocurrencies, you can also try it on other trading assets. The main reason cryptocurrencies favor this strategy is due to the high volatility and low trading costs of some crypto platforms. Therefore, ensure you have a low-cost trading platform or exchange; otherwise, spreads and commissions will eat into your profits.
If you are a beginner, please avoid using this strategy. It will require a lot of time, energy, quick thinking, finger dexterity, and EA-like behavior.
Strategy Points
By default, add Williams %R with a period of 14, which will be our main confirmation indicator (for more on the 'Williams %R indicator', see (11,000% historical profits! It is still sought after by global investors today)).
Add a 200 EMA as a trend direction filter and judgment tool.
Finally, we will use price action patterns - engulfing bearish and bullish candlestick patterns as our trade entry signals.
Strategy Rules
Similar to other intraday trading strategies, trend trading remains our primary style. Enter long trades only when the price is above the 200 EMA, and enter short trades only when the price is below the 200 EMA.
In the one-minute chart, engulfing candlestick patterns occur frequently, and you will receive a lot of signals. Logically, only trade bullish engulfing patterns in an uptrend, and vice versa.
After confirming the pattern at the candlestick close, check the Williams %R indicator. The indicator line must be above -50 to confirm a bullish signal, and below -50 to confirm a bearish signal.
 Risk Management
Considering this is a very fast-paced strategy with many signals, you should not risk more than 0.5% per trade.
Set your stop loss below the entry candlestick for long trades and above for short trades. Use twice the stop loss level as your risk management.
Considering this is a very fast-paced strategy with many signals, you should not risk more than 0.5% per trade. Set your stop loss below the entry candlestick for long trades and above for short trades.
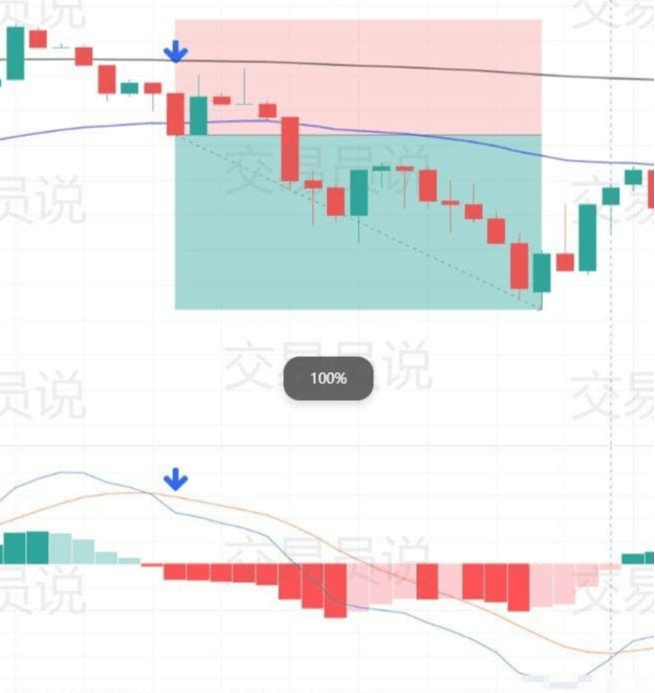
Use twice the stop loss level as your take profit target to achieve a 1:2 risk/reward ratio.
In terms of exiting, you can try using Williams %R for partial closing, or you can use a fixed 100% take profit as an exit strategy.
 Advantages and disadvantages
Choosing the right broker or exchange is very important.
The 1-minute scalping intraday trading strategy is very active and may be interesting for some traders, but it is advised to at least practice 1000 trades on a demo account.
The good news is that you can test this high-frequency scalping on a chart in just a few days.
The liquidity of the 1-minute timeframe can be an issue; if you see gaps and there are still candlesticks, avoid trading this strategy.
Additionally, when using this trading strategy, it is crucial to pay great attention to trading costs. If it suits you in the 5-minute timeframe, you can give it a try.
Finally, the biggest enemy of this strategy is a market with low trading activity; it is not recommended to use it in low-volatility markets.
Strategy 4: Donchian Channel Intraday Trading Strategy
Interestingly, when combined with proper capital management, a trading indicator can be sufficient for you to profit.
However, after all, everyone's trading situation is different, so it is necessary to master this strategy based on each person's trading practice.
The Donchian channels are similar to price action breakout strategies. Adding a simple EMA as a trend filter further improves the results.
Since this strategy only uses two indicators, it is relatively friendly for novice traders.
(For more on the 'Donchian channel,' see (So simple and effective! 'Donchian Channel' trading strategy guide)).
Strategy Points
Use the default parameters with a 21-period setting to add the Donchian Channel indicator.
Add a 200 EMA as a trend direction filter, but you can also choose other trend indicators you are familiar with.
Strategy Rules
You can use a 30-minute trading chart, but you can also try trading charts with other periods to see which one suits your situation best.
Similarly, only enter long trades when the price is above the 200 EMA and only enter short trades when it is below the 200 EMA.
The Donchian Channel will tell you where to set your stop loss and when to enter trades.
For bullish trend signals, the price needs to push the Donchian lower channel down and then break above the Donchian upper channel line at a higher high.
For short signals, the price needs to first push the top band and then enter a candlestick that forms a lower low at the bottom band.
Price action is the reason for confirming pullback and breakout entry signals.
Risk Management
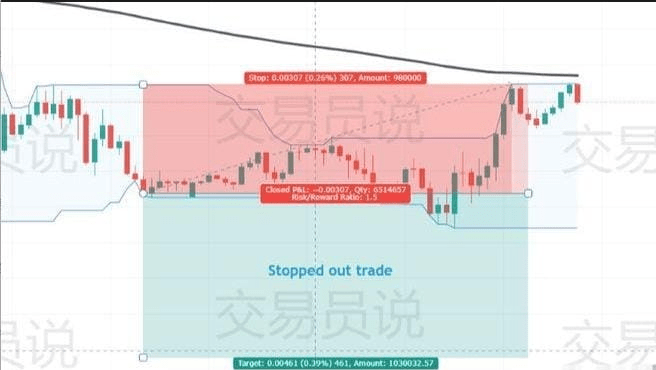
The good thing is that the Donchian channels tell you where your stop loss should be. For long trades, simply place your stop loss at the lower channel line; for short trades, set the stop loss at the upper channel line.
The take profit target is a 1.5 R/R ratio. In other words, your take profit will be 1.5 times the entry.
Try using trailing stops or taking partial profits, as this day trading strategy also follows trends.
Advantages and disadvantages
The Donchian Channel indicator is excellent for beginners who want to understand market structure, pullbacks, and breakouts.
If you experience price fluctuations, you will notice that the upper channel line of the Donchian channel can also serve as support and resistance.
Under measurement conditions, the channel will narrow significantly, so you may even choose to avoid trading.
Under the Donchian Channel intraday trading strategy, while using a 1-1.5 R/R profit/loss ratio has a win rate above 50%, it may not yield the best profits for some traders.
 Strategy 5: Waddah Attar Explosion Intraday Trading Strategy
Waddah Attar is a comprehensive indicator that shows when there is enough momentum in a trend. Additionally, it shows several movement directions and when the price movement loses momentum.
Thus, we are discussing a trend-following intraday trading strategy that filters range markets.
Strategy Points
Additionally, it should be noted that the Waddah Attar Explosion indicator is not as popular as the RSI or MACD, and many traders have not even heard of it, let alone used it. However, it can effectively identify sustained trends.
In the MetaTrader platform, the Waddah Attar Explosion indicator is not included in the default indicators toolbar, so you need to add it manually.
TradingView has some variant tools based on the Waddah Attar Explosion indicator, but keep the default settings and select the first one from the list.
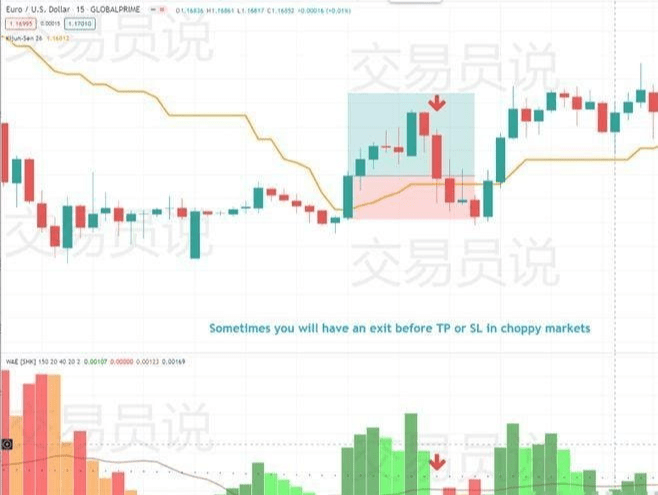
Additionally, add the Kijun-Sen moving average. This is an element of the famous Ichimoku Cloud indicator, which we will use to confirm the trend. The period is set to the default of 26.
(For more on 'Ichimoku,' see (See the trend at a glance, how magical is the 'Ichimoku chart'!?)).
Strategy Rules
When the price is above the Kijun-Sen line, we only go long; when it is below, we go short.
Waddah Attar shows red/green bars indicating bearish and bullish trends, along with a line running. You can only enter trades when the histogram is above this line, indicating that the price has enough momentum.
You can also use this rise/fall line to exit trades, as it indicates that trend momentum has disappeared.
Risk Management
Waddah Attar will filter signals from ranging markets, but it will not tell you where to set your stop loss.
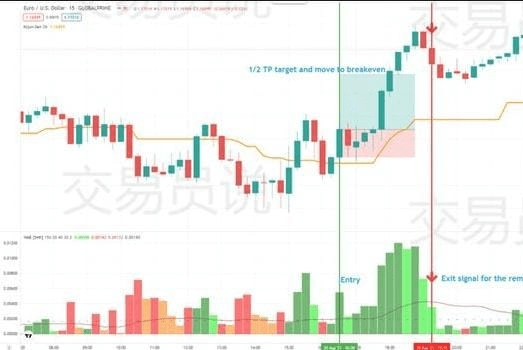
Once you receive a trading signal, you can place your stop loss at the bottom of the candlestick and aim for a take profit target twice that.
Now, you can use fixed stop losses and take profits like this, but since Waddah Attar also tells you when trends stop, we can use it for exits.
When taking profits, close half of your position; as long as momentum exists, the other half can remain open.
Additionally, once your take profit is triggered, you can move your stop loss to break even (entry price level).
Now your remaining half position will never be a losing trade.
Once you see a bar below that line on Waddah Attar, close out the remaining half of your position, as the trend has lost momentum.
This way, you can enjoy the larger trend without capping your profits.
 Advantages and disadvantages
Following this trend-based intraday trading strategy will tell you when to trade, when to exit, and when the market is volatile.
It also provides a horizontal scaling position management technique that can maximize profits over longer trends.
In MetaTrader 4, you must open two identical positions for each half.
Even with range market filters and Kijun-Sen, you may still get false breakouts, so be prepared for the worst and expect the best outcomes.
 Summary
Like any other style, intraday trading is a way of market trading that captures unique trading ideas. Being able to profit daily is very tempting. Unfortunately, when using intraday trading methods, you need to pay attention to the statistics.
Statistics from the past indicate that more than 95% of traders incur losses in intraday trading over the long term (related articles: Scientific Discoveries: Why Most Traders Can't Escape Losses? Practical Coping Rules Included).
In this article, we have seen that losses are a part of any trading strategy, especially in intraday trading.
Therefore, having strict capital management and excellent skills is necessary. Solid trading discipline is crucial for achieving the goals of intraday traders. Perhaps there are as many intraday trading strategies as there are intraday traders; the five strategies introduced in this article are just a small part of them. Finally, I wish you success in trading!
I am Little Egg Tart, a professional analyst and teacher, a mentor and friend on your investment journey! As an analyst, the most basic thing is to help everyone make money. To solve your confusion, your positions, and to speak with strength, when you are lost and do not know what to do, follow Little Egg Tart; Little Egg Tart will guide you.