#PIEVERSEUSD Current consolidation and potential movements
Timeframe: Daily (D1), 4-hour (H4)
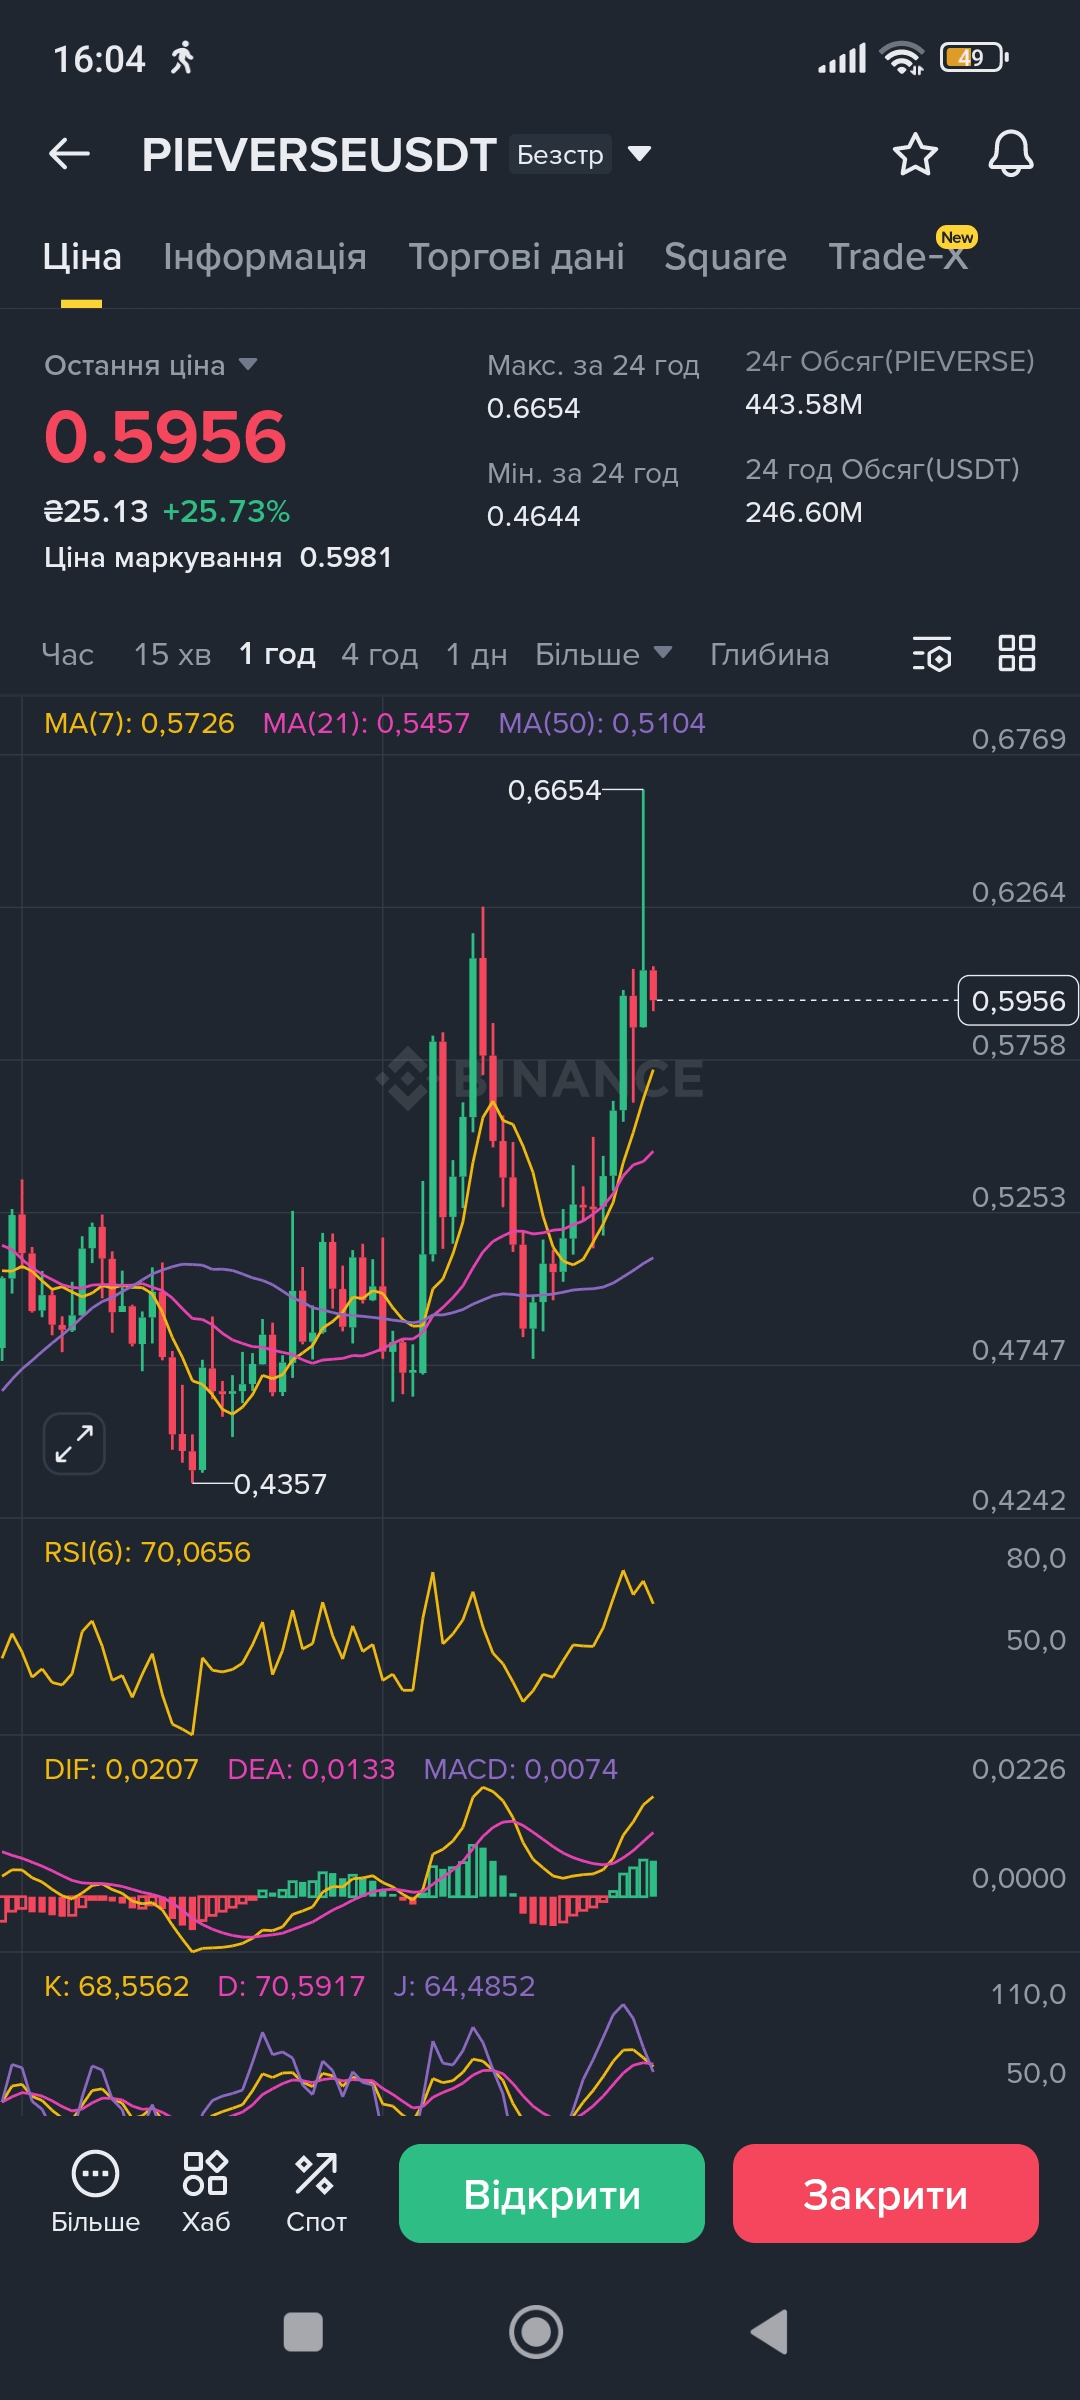
Current price: ~$0.5797 USDT
$PIEVERSE demonstrates significant volatility over the past week, recovering after a recent pullback from historical highs. The price is stabilizing, and technical indicators are giving mixed signals, indicating a consolidation phase before the next big move.
Key Levels:
Support Level: $0.50 – $0.51 USDT. This is a critical zone where high demand was previously observed. A breakdown below this level could lead to further declines to $0.45.
Resistance Level: $0.60 – $0.61 USDT. Overcoming this resistance will open the way to the next targets.
Indicator Analysis:
RSI (Relative Strength Index): On the 4-hour chart, the RSI recently bounced off the oversold zone to a level of 55, indicating a return of bullish momentum in the short term. However, the daily chart shows a more neutral situation.
MACD (Moving Average Convergence Divergence): The MACD line is above the signal line, which is typically interpreted as a buy signal and indicates a potential upward trend.
Moving Averages: On the 1-hour chart, the price is holding above key EMAs (Exponential Moving Averages), confirming a bullish structure in the current range.
Event Scenarios:
Bullish Scenario: If $PIEVERSE can break and hold above the resistance level of $0.60 USDT, the next targets will be $0.65 and $0.70 USDT.
Bearish Scenario: If the price fails to hold support at $0.50 USDT, a drop to $0.45 USDT and then to $0.40 USDT is possible.
Trading Recommendations:
Entry Zone: $0.52 - $0.54 USDT
Take Profit 1 (TP1): $0.58 USDT
Take Profit 2 (TP2): $0.61 USDT
Stop Loss (SL): $0.49 USDT (close of 4H candle below)
#MarketPullback #Write2Earn #PrivacyCoinSurge #BinanceLiveFuturesWeb3

