$XRP is showing some interesting price action today!
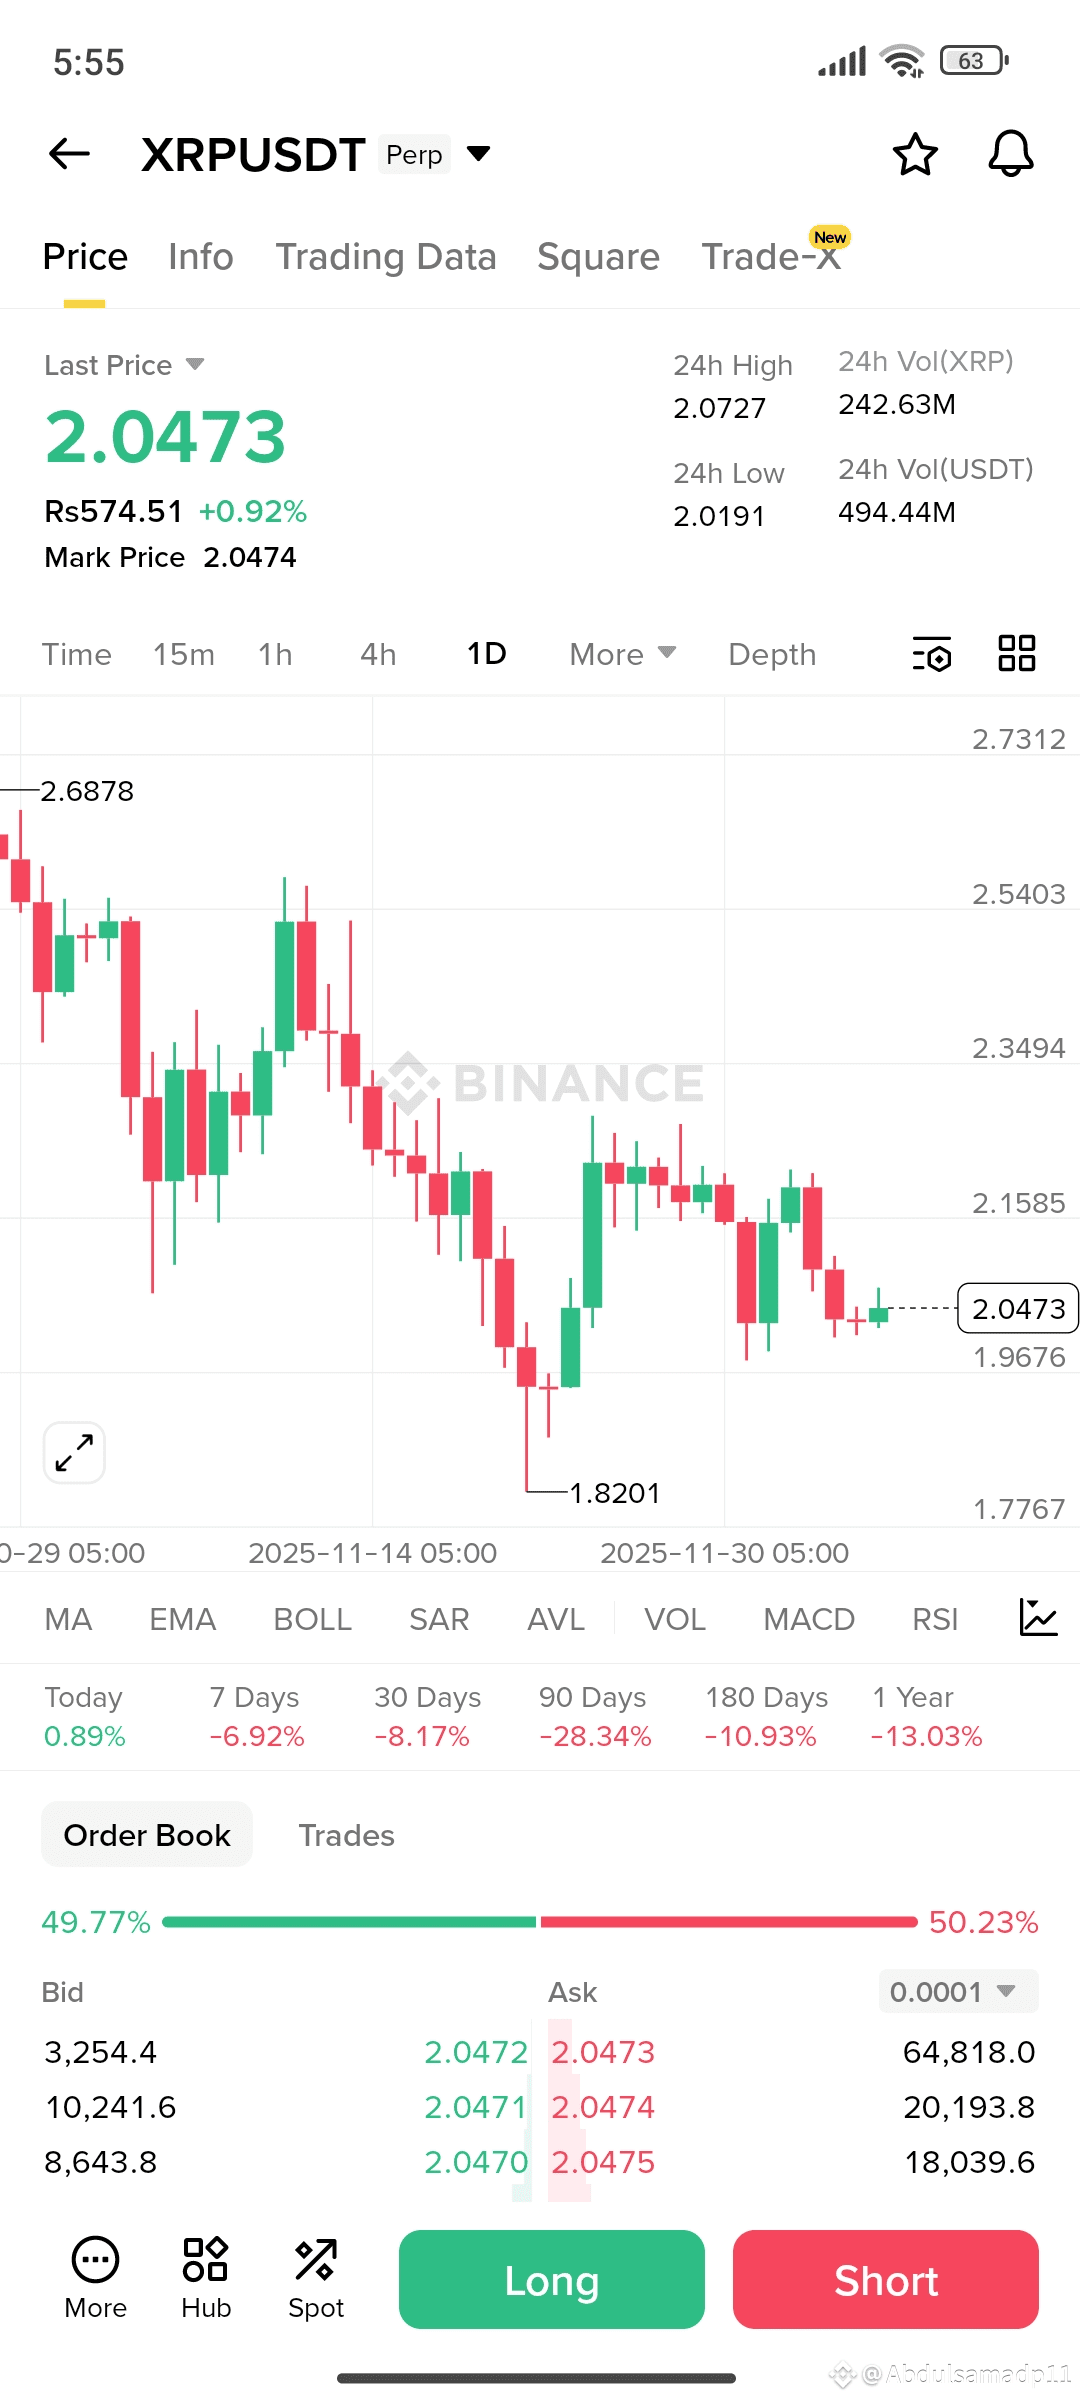
At the moment, XRP is trading around $2.047, up almost +0.90% in the last 24 hours. But the real story is hidden inside the chart…
---
🔥 📉 After the Drop… XRP Is Finally Stabilizing
Looking at today’s 1D chart:
XRP recently hit a local low around $1.820
Since then, it has been forming higher lows
Today’s candle is showing small but positive buying pressure
Buyers and sellers are almost balanced: 49.77% vs 50.23%
This shows one thing clearly:
👉 The selling pressure is slowing down, and bulls are quietly stepping back in.
---
📊 Key Levels to Watch
Support Zones
$1.82 — Strong bounce area
$1.96 – $2.00 — Important psychological support
Resistance Zones
$2.15
$2.34
$2.54 — Major breakout trigger
If XRP breaks above $2.15, we might see a quick move toward $2.34 again.
---
⚡ Market Sentiment Turning Positive?
Even though XRP has been down over the last:
7 Days: -6.92%
30 Days: -8.17%
90 Days: -28.34%
…but today’s structure shows stability returning.
This usually happens right before a trend reversal.
---
🎯 My Take: $XRP May Be Forming Its Bottom Zone
The chart suggests:
✔ Sellers are weakening
✔ Buyers are accumulating slowly
✔ Price is holding above the psychological $2 level
✔ Volatility is decreasing — a sign of potential breakout setup
If Bitcoin stays stable, XRP could attempt a move back to the $2.20 – $2.35 range soon.
---
🚀 Conclusion: XRP Is Entering the "Watch Closely" Zone
This isn't the moment to panic —
This is the moment to observe, because the chart structure is shifting.
XRP may be preparing for:
➡ A short-term bounce
➡ Or a bigger trend reversal if it breaks $2.15+
Let’s see how $XRP reacts in the next few candles — the next move can be explosive.