
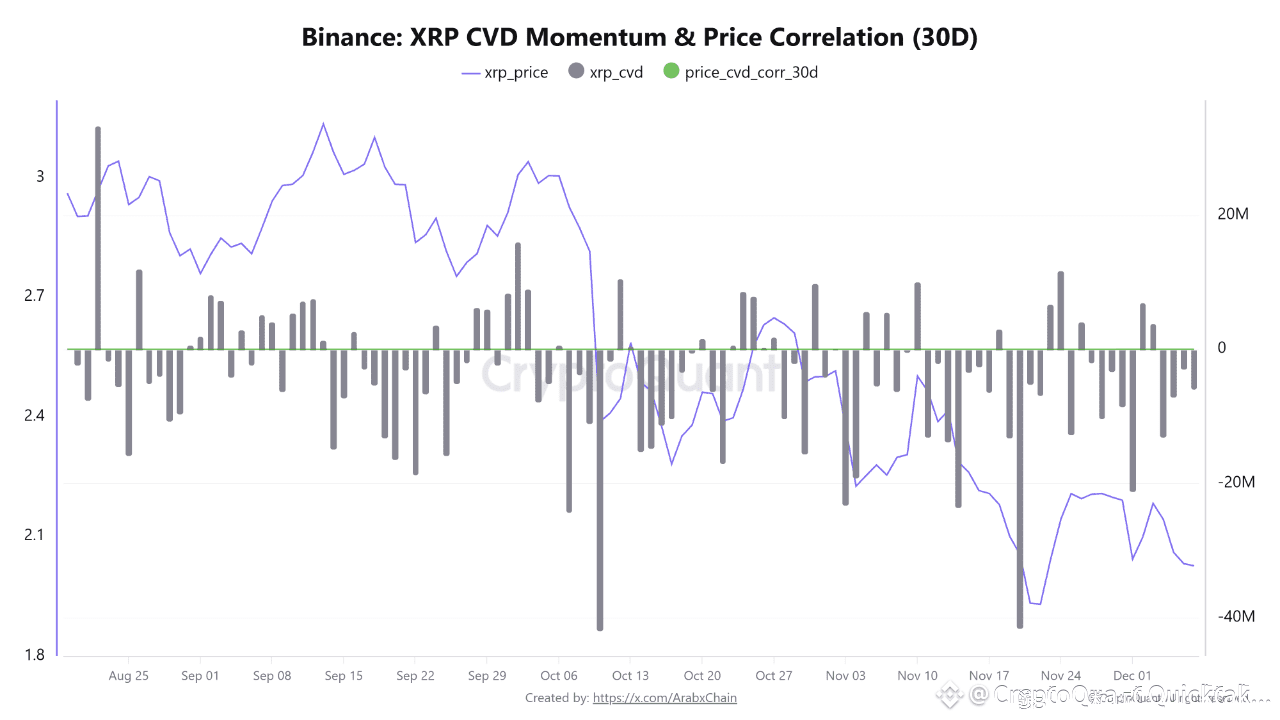
Data from Binance, the leading trading platform, shows that Ripple is going through a sensitive period characterized by weak price momentum and a shift in liquidity flows. XRP is trading around $2, while the CVD indicator has registered a sharply negative value of -5.9 million, reflecting the clear dominance of selling pressure over the past few weeks and a weakening balance of power between buyers and sellers in favor of the downward trend.
The CVD curve indicates that accumulated selling volumes over the recent period have significantly exceeded buying volumes, leading to a gradual price decline. This drop in the CVD is not merely a momentary movement but reflects a continuous shift in trader behavior. Large portfolios and professional traders have begun reducing their positions instead of accumulating them a clear indication of declining short-term confidence.
Conversely, the 30-day price CVD correlation indicator shows a positive value of 0.59, which is a crucial point This level indicates a strong correlation over the last 30 days between price movements and CVD changes. In other words, when the CVD falls, the price follows closely, demonstrating that the market is heavily reliant on actual liquidity flows within the Binance platform, not just speculation or sentiment.
This strong correlation reinforces the idea that the current decline is not merely a technical correction but rather the result of genuine selling pressure driven by active traders in the spot market. As long as this correlation remains positive, any improvement in the CVD could quickly translate into a price rebound, while continued negative pressure increases the likelihood of further declines.
Written by Arab Chain


