
# Analysis of the trading pair BEAT-USDT
Time period: 2025-12-07 17:45:00 ~ 2025-12-08 04:45:00
Nature of data: K line in real-time
## Analysis of candlestick patterns
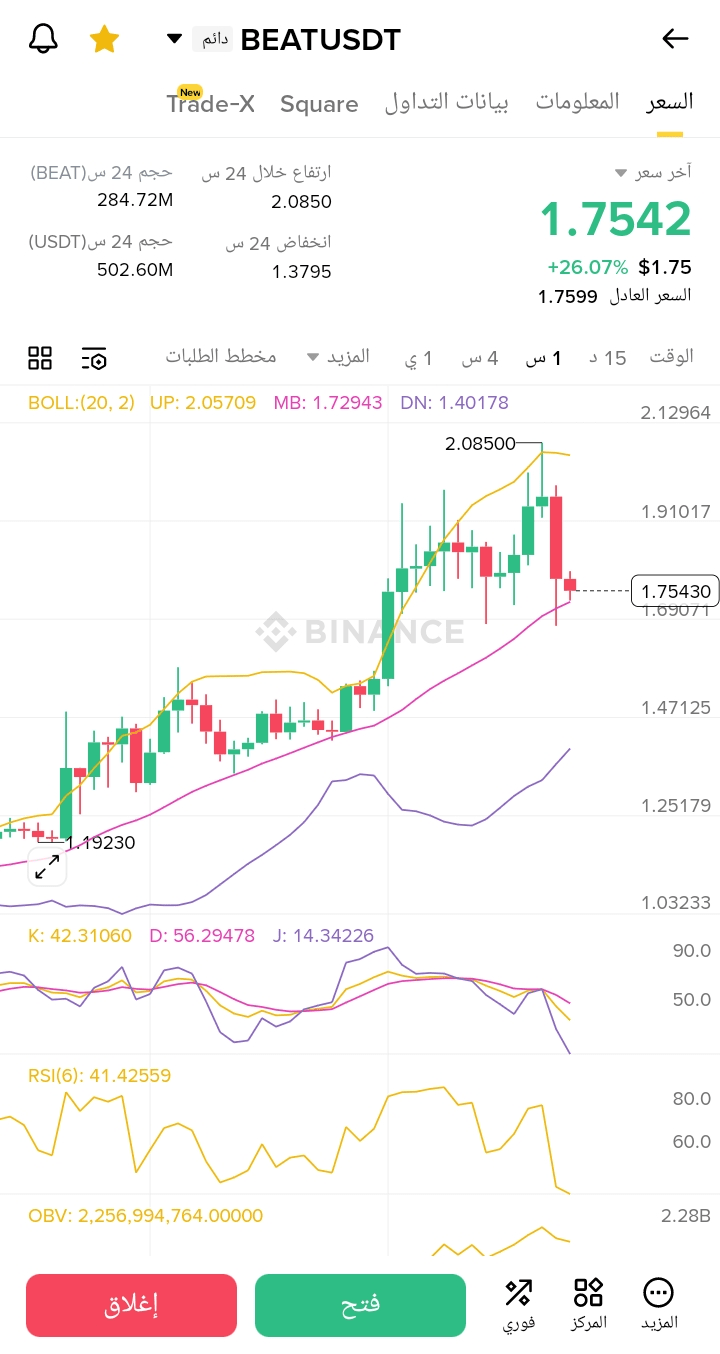
*Strong height pattern in the middle of the chart at 1.9248** - A series of consecutive green candles forming a strong upward trend - Strong signal
*Inverted hammer candle appears after reaching the peak 2.0741** - Bearish reversal signal - Medium strength signal
*Bearish engulfing pattern at 1.9248 after reaching the peak** - Strong reversal signal for the upward trend - Strong signal
*Long bearish candle appearing after a bearish engulfing** - Confirmation of the downward trend - Strong signal
*Doji candle appearing at 1.6793** - Sign of market indecision and potential trend reversal - Medium signal
*Retracement pattern at 1.6793** - Strong support at this level - Positive signal
*Last candles show volatility and consolidation around 1.7496** - Sign of price stabilization after the rebound - Medium signal
## Technical indicators analysis
*Volume Indicator (VOL)**: Shows a significant increase in trading volume during both the upward phase and the sharp decline, confirming the strength of both trends. Trading volume decreased at the end of the period, indicating a decline in momentum.
*MACD Indicator**: Appears on the chart and indicates the formation of a positive signal during the upward phase, followed by a negative reversal during the decline.
*RSI Indicator**: Present on the chart and shows overbought levels at the peak before the sharp decline.
*KDJ Indicator**: Appears on the chart with bearish crossover signals after reaching the peak.
## Identifying support and resistance levels
*Main resistance level**: 2.0700 (near the previous peak 2.0741)
*Average resistance level**: 1.9250 (price congestion area before the recent rise)
*Nearby support level**: 1.7400 (current price level where the price is fluctuating)
*Strong support level**: 1.6800 (near the bottom 1.6793 where the price rebounded strongly)
*Major support level**: 1.6000 (an important psychological level below the last bottom)
## Overall technical assessment
The chart shows a clear pattern of strong rise followed by a rapid collapse and then stabilization. High trading volume coincided with major price movements, confirming the validity of the trends. After the sharp decline, the price showed signs of stabilization at current levels, forming a bottom at 1.6793 and rebounding from it.
## Summary
The BEAT-USDT pair experienced sharp fluctuations during the analyzed period, with a strong rise reaching 2.0741 followed by a sharp decline to 1.6793. Currently, the price seems to be trying to stabilize around 1.7496 with the potential to form a double bottom pattern if it continues to rebound. For traders, the level of 1.6800 can be considered important support for long positions with stop-loss orders placed below 1.6700. Cautious investors should wait for confirmation of a new trend before entering new trades. Always remember to manage risks appropriately due to the high volatility exhibited by this pair.