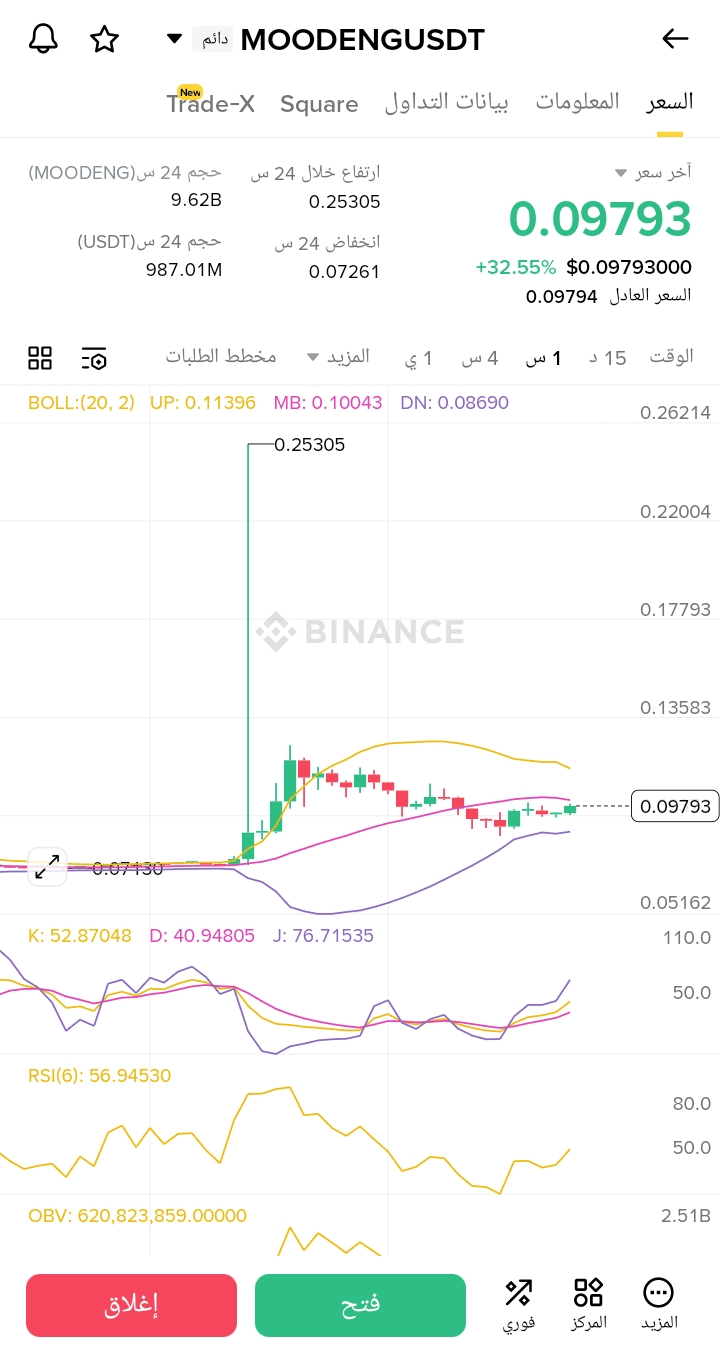
# Analysis of the trading pair MOODENG-USDT
Time period: 2025-12-07 14:15:00 ~ 2025-12-08 04:45:00
Nature of the data: Real-time data
## Analysis of Japanese candlestick patterns
*Appearance of a reversal pattern at the beginning of the chart at level 0.11193** - Strong bearish signal followed by sharp price correction
*A doji pattern forms around the middle of the chart at level 0.10176** - Market indecision and a potential signal for trend reversal - Medium strength signal
*A hammer candle appeared at level 0.08503** - Exhaustion of the bearish trend and a potential beginning of a rebound - Strong signal.
*A bullish engulfing pattern formed around 20:15 at level 0.09000** - Confirmation of the bullish trend reversal - Very strong signal.
*The last candles show the formation of a bullish flag pattern around the level 0.09840** - Potential continuation of the bullish trend - Medium strength signal.
## Analysis of support and resistance levels
Support levels:
* First strong support: 0.08500 (last rebound area)
* Average support: 0.09000 (price accumulation area)
* Nearby support: 0.09500 (psychological level)
Resistance levels:
* Nearby resistance: 0.10000 (important psychological level)
* Average resistance: 0.10500 (previous trading area)
* Strong resistance: 0.11200 (previous peak)
## Overall technical assessment
*Volume and price coordination**: An increase in trading volumes is observed with the recent green candles, supporting the current bullish trend.
*Overall market trend**: Bullish reversal after a sharp decline, with a higher low formation compared to the previous low.
*Summary of technical signals**: Most signals lean towards bullish, especially after the formation of a bullish engulfing pattern.
## Conclusion
The MOODENG-USDT pair shows a clear bullish reversal after a sharp decline. The technical pattern indicates a recovery of positive momentum with the formation of a series of consecutive green candles. Traders can consider buying opportunities at the specified support levels while placing stop-loss orders below level 0.08500.
It is important to monitor the resistance level 0.10000 as a breakout might form an additional positive signal. However, caution should be exercised due to the high volatility exhibited by this pair, especially with the significant rise of 32.86% over the last 24 hours.