


Monero is trading below $370 after recording a drop of nearly 8% on Sunday and breaking below the 50-day exponential moving average.
Aster has returned below $1 after four consecutive days of losses, putting a critical support level at risk.
Bonk continues to hold below the psychological resistance at $0.00001000, with bears focusing on the support level of $0.00000884.
Altcoins, including Monero ($XMR ) and Aster ($ASTER ) and Bonk ($BONK ), face the risk of extending their losses as the broader cryptocurrency market stalls amid stalled peace talks between Ukraine and Russia.
Monero under pressure risks testing the 200-day exponential moving average.
Monero is trading below the 50-day exponential moving average at $371 after an 8% drop on Sunday, which recorded the fourth consecutive bearish candle on the daily chart. At the time of this report, XMR stands with a 1% rise on Monday as bulls defend the $350 level.
A potential slip below this level could extend the bearish trend to the 200-day exponential moving average at $319.
Momentum indicators on the daily chart indicate a tightening bearish grip. The Relative Strength Index (RSI) is at 43, slipping below the middle line, suggesting relatively stronger selling pressure.
At the same time, the MACD indicator is approaching the zero line, maintaining the sell signal resulting from Wednesday's crossover.
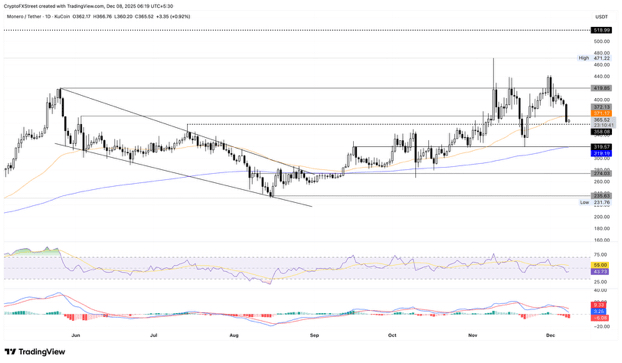
Daily chart for XMR/USDT prices.
If XMR returns above the 50-day exponential moving average at $371, it could extend its recovery to the round level of $400.

Aster's decline is gaining momentum, risking a new low.
Aster is trading above $0.900 at the time of this report on Monday, after losing 6% the previous day. The futures-focused exchange token risks losing the 0.882 level, aligning with last week's low.
If ASTER records a successful close below this level, it risks testing the historical low of $0.817 from November 4. Below this, the exchange token may enter price discovery mode for a new low.
Momentum indicators on the 4-hour chart indicate strong pressure from above. The Relative Strength Index (RSI) at 32 hovers near the oversold zone while MACD and signal lines extend in a downward direction.
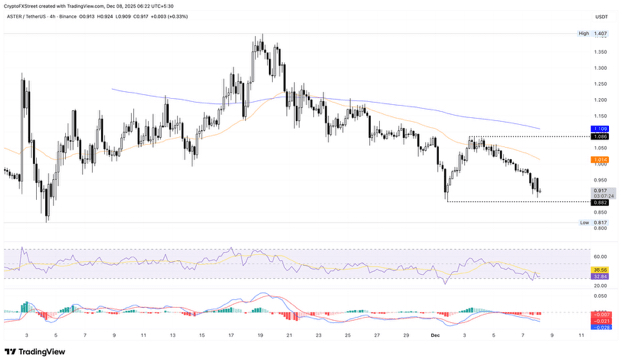
4-hour price chart for ASTER/USDT.
However, a potential recovery in Aster from 0.882 above the psychological level of $1.000 could restore recovery towards a high of $1.086.
Bonk's path of least resistance indicates further losses.
Bonk remains under pressure below $0.00001000 at the time of this report on Monday, trading within a consolidation range on the 4-hour chart, with support at the November 22 low of $0.00000844 and resistance at $0.00001034.
The path of least resistance for the meme coin points to 0.00000844, as the Relative Strength Index (RSI) is at 42 on the 4-hour chart, with room to drop before oversold levels. Meanwhile, the MACD and signal lines are moving flat below the zero line, lighting up mixed signals.
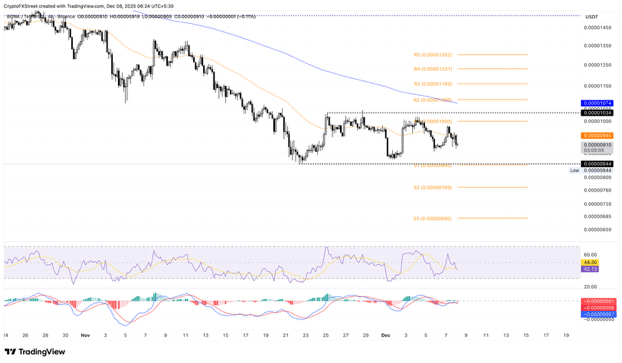
4-hour price chart for BONK/USDT.
In the event of a bullish breakout of the range, Bonk could target the 200-period exponential moving average at 0.00001074, followed by the R3 pivot point at 0.00001160.
