

Solana rises by about 5% on Monday, as bulls seek to surpass the upper resistance line.
Derivatives data indicate a rise in the funding rate, suggesting a decrease in bearish interest among traders.
Solana's ETFs recorded light inflows last week, indicating a decline in institutional interest, but it marked the sixth consecutive week of inflows.
Solana (c-66) is moving up about 5% at the time of this report on Monday after forming a Doji candle on Sunday. Derivatives data shows an increase in the funding rate, indicating reduced incentive for traders to hold short positions. At the same time, Solana-focused ETFs are recording their sixth consecutive week of inflows, indicating ongoing interest from institutional investors.
The technical outlook for Solana places a local resistance line that has remained steady since October 6 in focus.
Strong demand for Solana indicates an improvement in sentiment.
The open interest for c-73 futures contracts (OI) remains steady above $7 billion, indicating almost stable capital flow in SOL derivatives. CoinGlass data shows that the open interest for SOL futures contracts is $7.16 billion on Monday, generally stable over the past 24 hours.
However, the increase in the weighted funding rate indicates that the interest in holding short positions has significantly decreased. The funding rate stands at -0.0018%, up from -0.170% on Sunday. If funding rates turn positive, it would indicate a rise in bullish confidence as bulls would pay a premium to hold long positions.
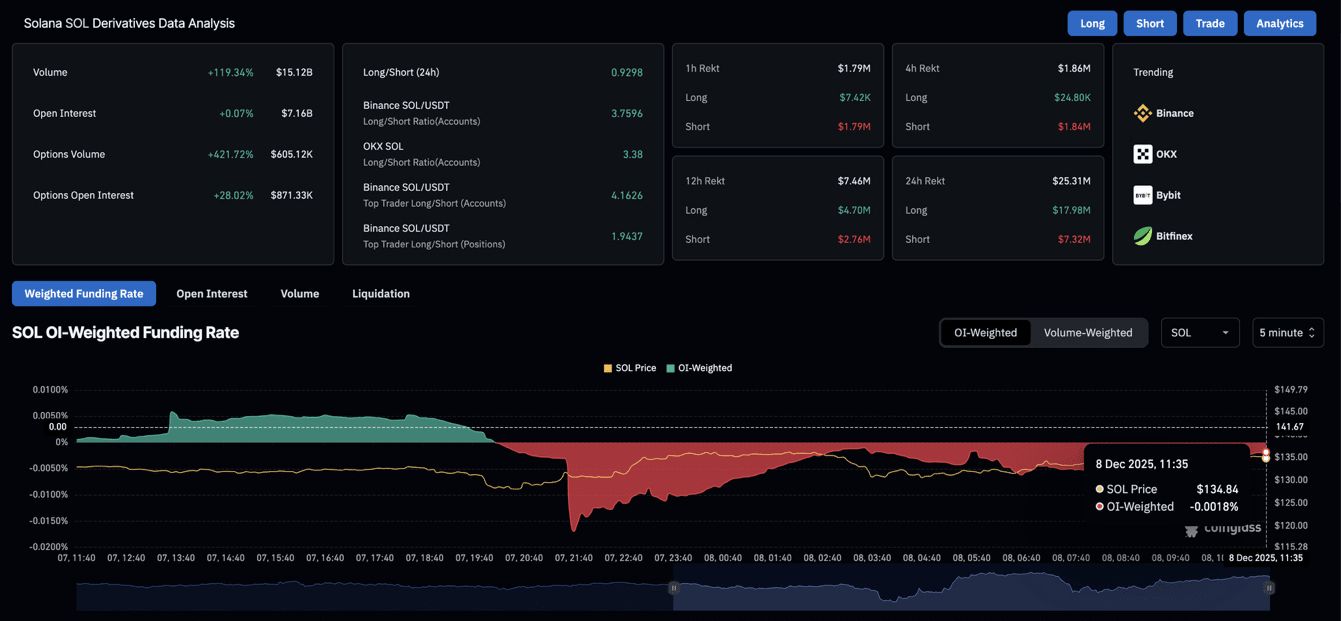
SOL derivatives data. Source: CoinGlass.
At the same time, institutional interest in Solana has decreased, with weekly net outflows of $20.30 million in SOL ETFs, down from $108.34 million the previous week. However, inflows of $15.68 million on Friday have extended the weekly inflow streak to six consecutive weeks.
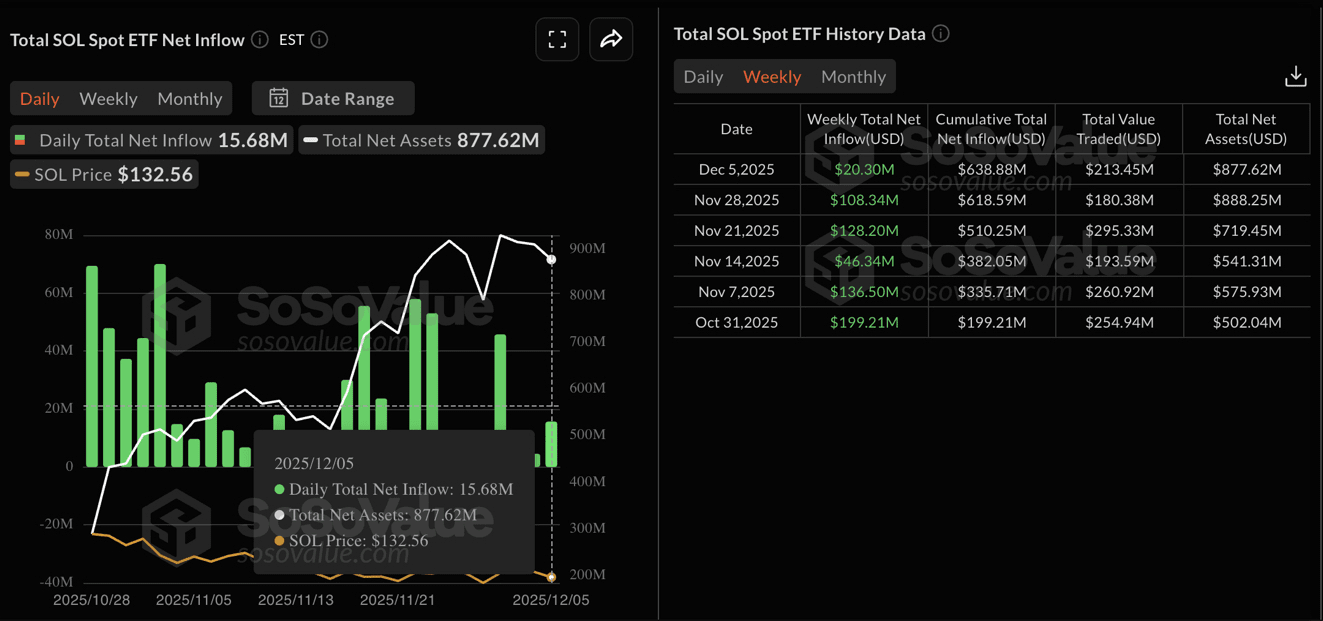
SOL ETFs data. Source: Sosovalue.
Solana is gaining momentum, aiming to challenge a critical resistance line.
Solana floats above the demand zone between $121-127 on Monday, aiming towards the resistance line connecting the peaks of October 6 and 27, near $140. A short-term recovery in the high-speed blockchain token may confirm the bullish breakout with a crucial daily close above $140.
Solana's potential breakout rally may face resistance from the 50-day and 200-day exponential moving averages (EMAs) at $153 and $173, respectively.
Technical indicators on the daily chart suggest a positive shift in momentum. The Relative Strength Index (RSI) is at 45 points, with an upward trend towards the midpoint line, indicating a neutral shift from a bearish bias.
At the same time, the Moving Average Convergence Divergence (MACD) indicator maintains a steady upward trend above the signal line, indicating bullish momentum on the edge, where a potential crossover could ignite renewed bearish pressure.
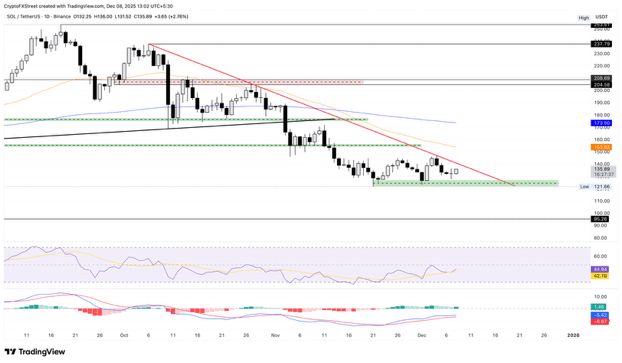
The daily chart for the SOL/USDT price.
If c-89 closes below $121, bears may target the April low at $95.
#solana #sol #BinanceSquare #BinanceSquareFamily #BinanceSOL