$BTC 4H-Timeframe Overview for Bitcoin (BTC)
📈 Recent Price Context
Bitcoin recently rebounded from lows near $80,000–$84,000 and is now trading in the ballpark of $91,000–$93,000.
This bounce is seen as part of a short-term recovery after a sharp drop post-all-time high earlier in 2025.
---
⚙️ Key Technical Levels & Chart Structure (4-Hour Perspective)
Support zones:
Strong support near $80,000–$85,000, which held during the crash and remains a foundational “floor.”
Intermediate support around $88,000–$90,000 — a region where BTC has recently consolidated.
Resistance zones:
Short-term resistance around $93,000–$95,000 — BTC recently struggled to decisively break past this zone.
Major resistance lies between $95,000–$100,000, a psychologically significant range and prior swing-high area.
Pattern & momentum notes:
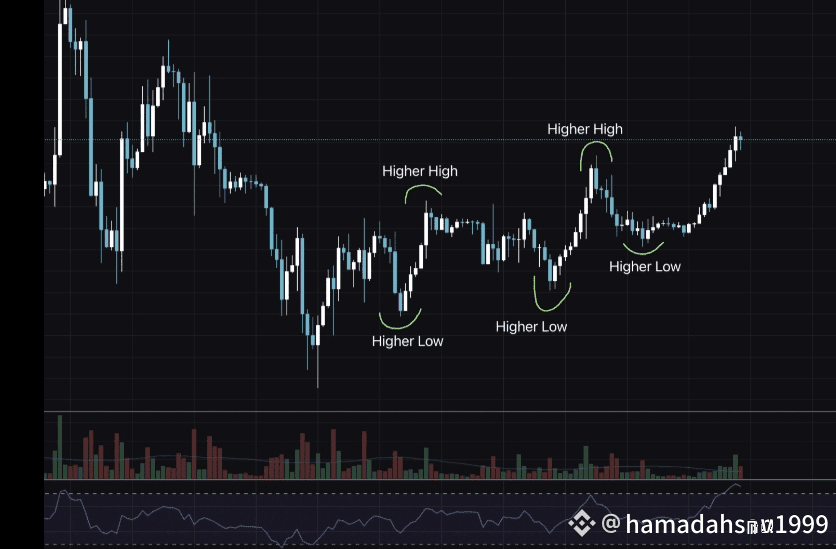
On the 4-hour chart, after the crash BTC appears to have formed a “V-shaped recovery → consolidation” phase — possibly setting up for a stronger push upward.
Technical indicators (e.g. EMA + RSI) suggest some short-term bullish support: BTC recently bounced off its 50-period EMA, showing signs of regained momentum.
However, some analysts warn that the environment remains “vulnerable,” meaning risk of another pullback remains non-trivial if support zones fail.
---
📊 What Could Happen Next — Scenarios
Scenario What needs to happen / what to watch Potential outcome
Bullish breakout BTC breaks and closes decisively above $95,000–$98,000 with strong volume Could rally toward $100,000+, perhaps testing psychological ceiling near $100,000–$105,000
Range-bound consolidation BTC hovers between $88,000–$93,000, with sideways price action and low volatility Extended consolidation — could swing between support & resistance zones while buyers & sellers wait for catalyst
Bearish relapse Price fails to hold support near $88,000, dropping below to $85,000–$82,000 Risks revisiting the $80,000 floor, or even lower if macro/market conditions worsen
---
🧭 What to Watch Right Now
1. Close above $95,000 — a convincing breakout there would increase odds of a larger bullish swing.
2. Volume & momentum indicators — rising volume and bullish RSI/MACD signals would support strength; thin volume + weak momentum suggests caution.
3. Support zone integrity — particularly the $88,000–$90,000 zone; a breakdown could signal a deeper pullback.
4. Broader macro & sentiment drivers — e.g. regulatory news, interest-rate expectations, institutional flows.
---
If you like — I can pull up 3 alternative 4H Bitcoin chart views (with support/resistance marked, RSI + MACD + volume bars) showing bullish, neutral, and bearish scenarios — helps visualize possible paths.
#BTC #BTCVSGOLD #BinanceBlockchainWeek #BTC86kJPShock #TrumpTariffs