#Xrp🔥🔥 #XRPRealityCheck #XRPPredictions #XRPUSDT🚨
XRP (XRP)
$2.10
+$0.07(+3.45%)Today
1D5D1M6MYTD1Y5Ymax
Here’s a fresh analysis of XRP (from Ripple), along with the most recent forecasts and what to watch out for — including a chart for visual context 👇
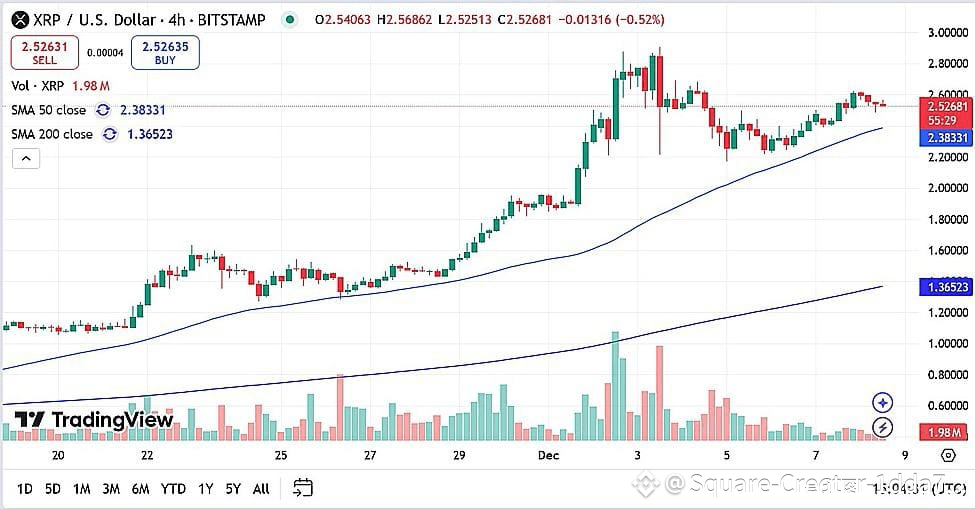
📈 Where XRP stands now (Dec 2025)
According to a recent overview, XRP is trading near ≈ $2.10–$2.15. CoinCodex+2financemagnates.com+2
Technical-indicator sentiment is skewed somewhat bearish: one analysis shows XRP below its 50-day and 200-day moving averages — which often signals “downtrend unless proven otherwise.” finance.yahoo.com+1
Support levels to watch (if things head south) include ≈ $1.93–$1.86, while resistance/important break levels sit around $2.23–$2.41. CoinCodex+1
🔮 What analysts & market-watchers predict
Recent forecasts show mixed but cautiously optimistic views, depending on what happens next:
Source / ForecastTarget Range / ExpectationTechnical analysts (near-term)Upside to $2.31 soon, with a possible rally to $2.50–$2.85 by end of December if key resistance breaks. Blockchain News+1Optimistic medium-term view (if momentum & catalysts align)Some expect XRP to test $3.00–$3.20. tradingnews.com+1Cautious / base-case forecastOthers expect consolidation between $2.12–$2.46 over the next few weeks, averaging around $2.25. CoinCodexLong-term bullish (conditional on adoption/ETFs)If institutional demand and ecosystem developments strengthen, there are projections that XRP could climb further — though these are speculative and depend on many external factors. CoinMarketCap+2tradingnews.com+2
⚠️ What could push XRP up — or pull it down
✅ Bullish catalysts
Increased institutional adoption and ETF inflows — which could reduce circulating supply and increase demand for XRP. tradingnews.com+1
Positive technical breakout: if XRP breaks above resistance around $2.28–$2.41 with strong volume. Blockchain News+1
Wider macroeconomic conditions and renewed investor confidence in crypto — this tends to benefit larger-cap coins like XRP.
⚠️ Risks / bearish triggers
Continued bearish technical signs — particularly trading below key moving averages and weak momentum. finance.yahoo.com+1
Failure to break through resistance levels could lead to consolidation or even a drop toward lower support zones (e.g., around $1.90–$1.85). CoinCodex+1
External macro pressures: broader crypto weakness, regulatory uncertainties, or liquidity drain could also weigh heavily.
🧭 What this means for traders or investors
Short-term traders might look for a bounce toward $2.30–$2.50, especially if bullish conditions show up (volume, market sentiment).
Medium-term: a sustained break above $2.40–$2.50 resistance could open path toward $3.00–$3.20.
Long-term investment remains speculative — while some bullish scenarios exist, they depend heavily on institutional interest, regulatory clarity, and broader market recovery.
