This is the weekly chart of BTC, and here’s my logic-based outlook, not the usual noise you see everywhere.
People keep shouting “long” or “short,” but very few are actually reading the structure. So here’s what the chart really says:
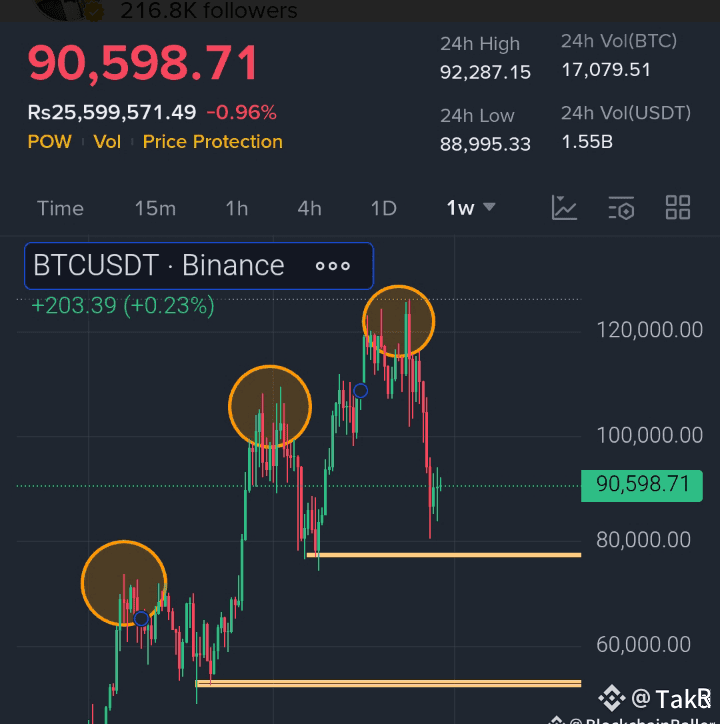
• BTC has been rejected three times from the same supply zone around 91,500–92,000.
• Each touch brought strong selling pressure.
• This makes one thing clear: the market is still respecting the downtrend.
Right now, BTC is stuck near the mid-range, but the true decision zone is still the 82,500–82,000 demand ba level that has held several times, but is getting weaker.
If price breaks below 82,000 with a solid weekly close, the next liquidity pool sits directly at 78,600–78,400, with no significant support in between.
On the other hand, the trend only turns bullish if BTC convincingly reclaims 91,500 with strong volume.
At this moment, there’s no strength, no momentum shift, and no bullish confirmation.
The lower-high structure remains intact.
So what’s the play?
After reviewing the structure, the message is straightforward:
• BTC is still printing lower highs → bearish trend intact
• The rejection from 94k reinforces seller dominance
• Unless BTC reclaims this area, upside is weak and unreliable
Anyone looking for entries here is ignoring reality:
We’re trapped between strong resistance above and strong demand below — the worst zone to open a position.
This isn’t a clean long.
This isn’t a safe short.
The risk-to-reward simply doesn’t justify taking a trade.
Bottom Line:
– Market structure: bearish
– Current zone: no clean setups
– Best move: WAIT
Either BTC reclaims 98k for a valid long…
Or breaks 85k for a confirmed move downward.
Until one of those triggers, this remains a no-trade zone.