Attention, my crypto community! 🚨 If you were wondering if Bitcoin (BTC) was going to continue that crazy rise, the daily chart has just shouted a signal that we cannot ignore: the dreaded "Bearish Flag" 📉 waves strongly and puts our eye on $67,000 as the next key level. What does this mean for our portfolio? Let's break it down!
🚩 The Chart Shouts: Bearish Flag Alert!
To understand it without being a trading guru: imagine that Bitcoin had been falling sharply from its highs of $107,000 (the "mast" of the flag). Then, the price starts bouncing sideways, but in a channel sloping downwards (the "fabric" of the flag). The problem is that the price tried to break upwards, hit a ceiling near $93,000, and was rejected! 🚪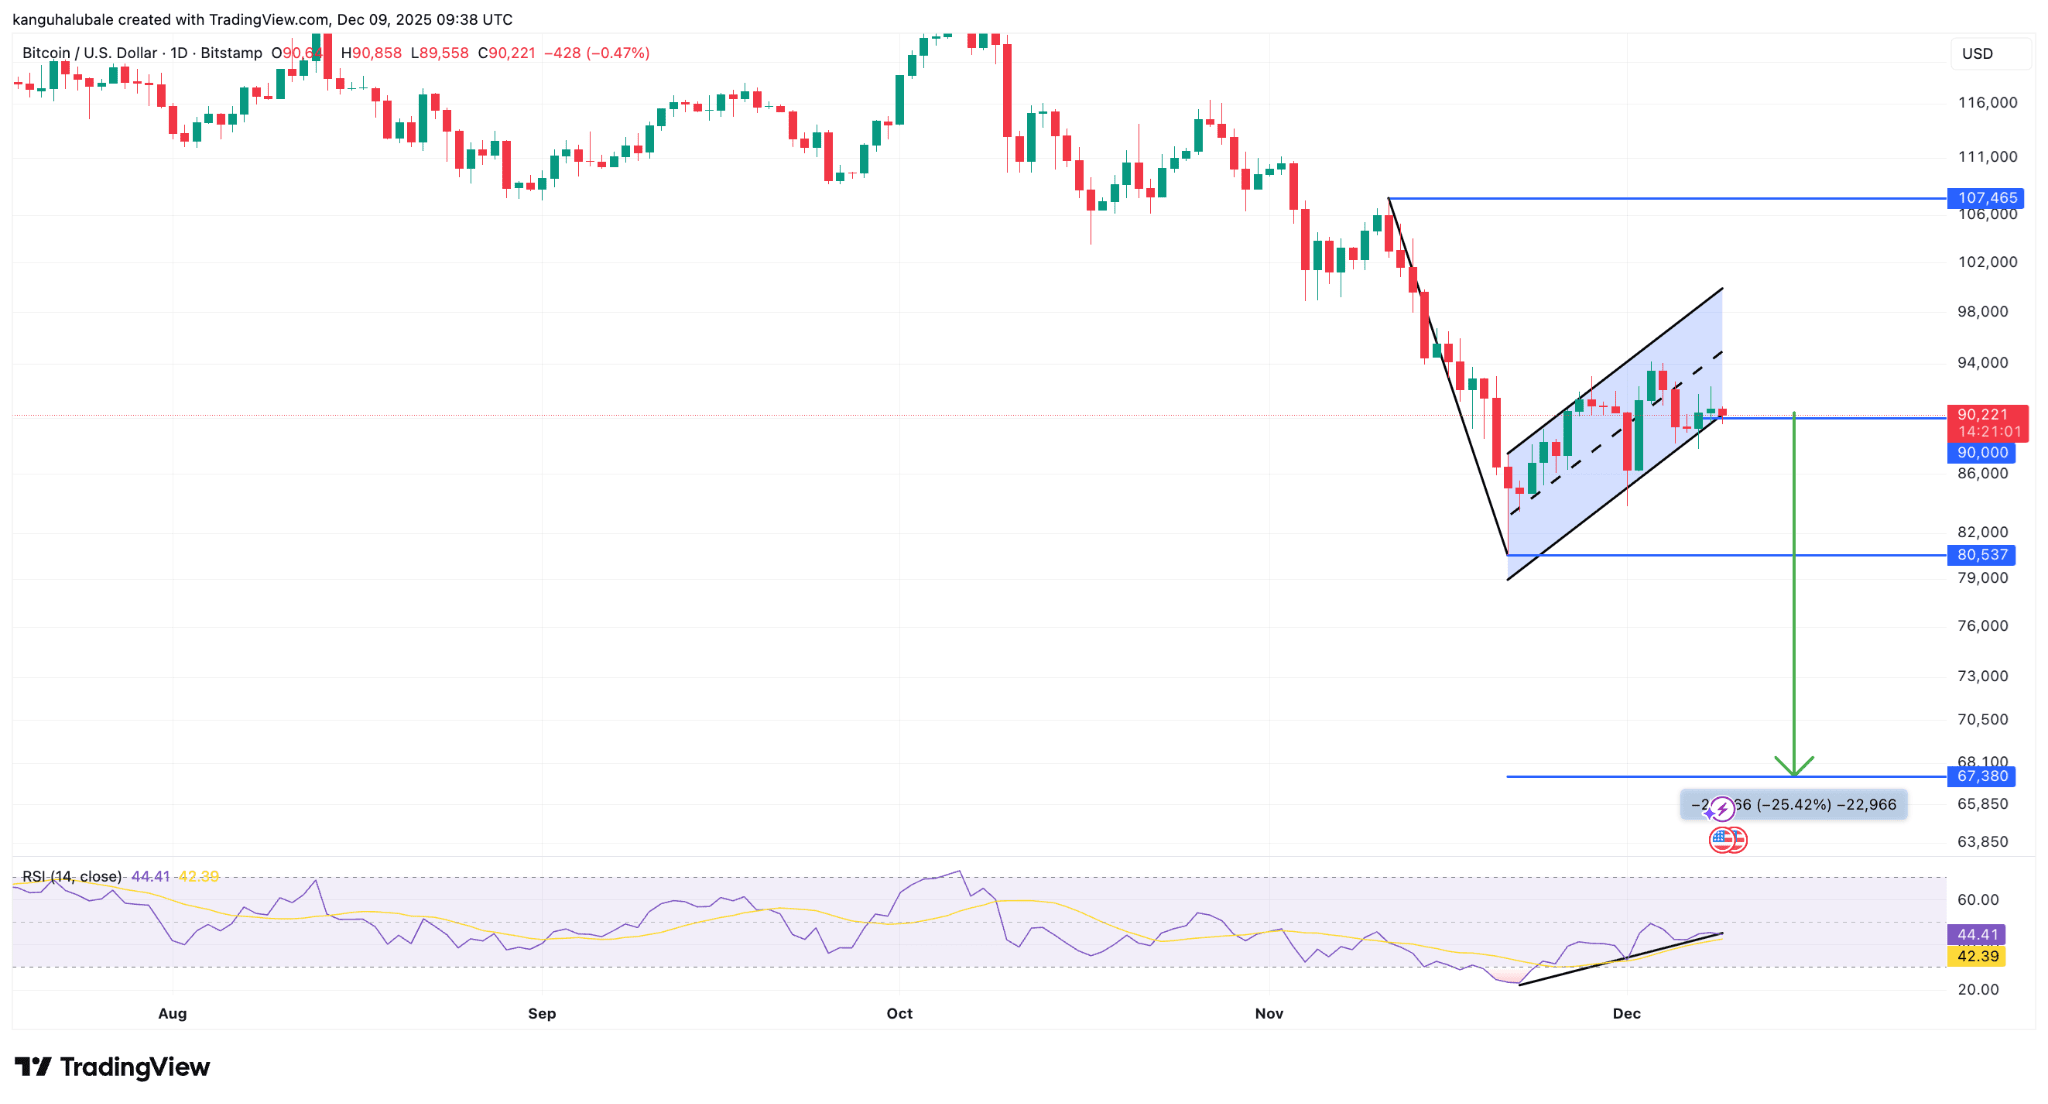
Analysts say that if this flag is confirmed, that is, if we see a daily candle close below the lower limit of $90,000, the mathematical pattern projects a potential drop to $67,380. 😬 That's a drop of more than 25% from where we are now, a hit that would take us close to the peak we saw in 2021! Some, like Colin Talks Crypto, are a bit more optimistic and set the most likely floor between $74,000 and $77,000, expecting an epic rebound there.
💸 The Engine Won't Start: Where Are the Buyers?
But it's not just the chart. The key for an asset to rise is that there is demand, meaning people buying, right? And here is where it gets cold 🥶:
Negative Spot Sales: The Cumulative Volume Delta (CVD), which measures the net difference between buys and sells on exchanges, has been sinking for a week. It went from being slightly negative to being MUCH more negative (from $40.8 million to $111.7 million in net sales). This means there are more people selling aggressively than buying, and that takes all the momentum away from Bitcoin.
ETFs Are Weak: Remember that Bitcoin Spot ETFs are how large institutional investors (the "sharks" 🦈) enter the market. Well, last week, those flows went from an inflow of $134.2 million to a net outflow of $707.3 million! This is a sign that the big players are either taking profits or being more cautious. Even last Monday, there was another outflow of $60 million.
In summary: the mix of a bearish pattern on the chart and the absence of new large and small buyers is the perfect recipe for the price of BTC to take a deep "break." Indicators (like the MACD and RSI) were cooling off with this consolidation, and that, ironically, sets the stage to continue the downward trend if the breakout is validated.
So, are we heading into a bear market or is it just a necessary "reset"? The game is not over. We need to watch those $90,000 like a hawk 🦅. If we lose them, buckle up. If the market goes to $67,000-$77,000, will you be ready to buy in what many see as a super rebound zone or will you freeze in fear? It's time to have your strategy clear, not your panic.$BTC
