

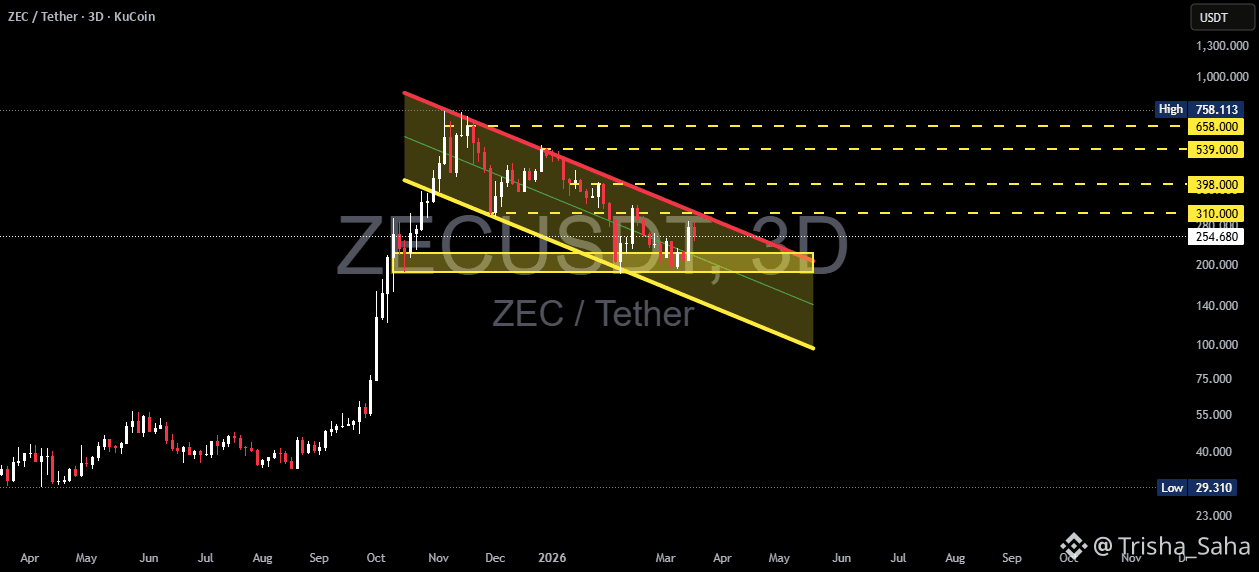
🧠 Structure & Key Pattern
The ZEC/USDT 3D timeframe chart shows a very clear structure:
A strong impulsive move (flagpole) from the bottom to around $750+
Followed by a downward consolidation channel
This forms a Bull Flag, which is typically a bullish continuation pattern
However, an important note:
The channel is deep and prolonged → sellers are still dominant
Price is currently sitting at a strong demand zone (lower yellow area)
👉 This is a bull flag under heavy selling pressure
---
📐 Bull Flag Details
Flagpole: Sharp rally from ±$40 → $750
Flag: Descending channel (lower highs & lower lows)
Key Support: Demand zone around $180 – $220
Dynamic Resistance: Descending trendline (red line)
---
🟢 Bullish Scenario
Bullish confirmation occurs if:
1. Price breaks above the descending trendline
2. Accompanied by increasing volume
3. Strong candle close above $310 – $350
Bullish Targets:
$398 (first resistance)
$539 (mid resistance)
$658
$750+ (previous local high)
🎯 Ideal bull flag projection:
Potential move toward $900 – $1,100 if momentum expands
---
🔴 Bearish Scenario
Bearish continuation occurs if:
1. Price fails to hold the $180 – $220 demand zone
2. Breaks down with strong bearish candles
Bearish Targets:
$140
$110
Potential revisit of $80 – $50
⚠️ If this happens:
The structure shifts → no longer a bull flag
Could turn into a bearish continuation or distribution phase
---
⚖️ Technical Conclusion
Current pattern: Bull Flag (valid but under pressure)
Key zones: $180 support vs $310 breakout
Current position: Decision zone (critical level)
👉 The market is deciding between:
Strong bullish reversal 🚀
Continued distribution 📉
---
🔥 Additional Insight
The longer the consolidation → the stronger the potential breakout
Fakeouts are highly possible in this area
Confirmation is crucial — avoid entering solely based on the pattern
