

Tesla Stock is treading water near $405. After closing at $405.05 on June 22, TSLA sits in an indecisive range — above key support but unable to reclaim momentum. The daily picture is genuinely neutral, and that lack of conviction defines the current setup.
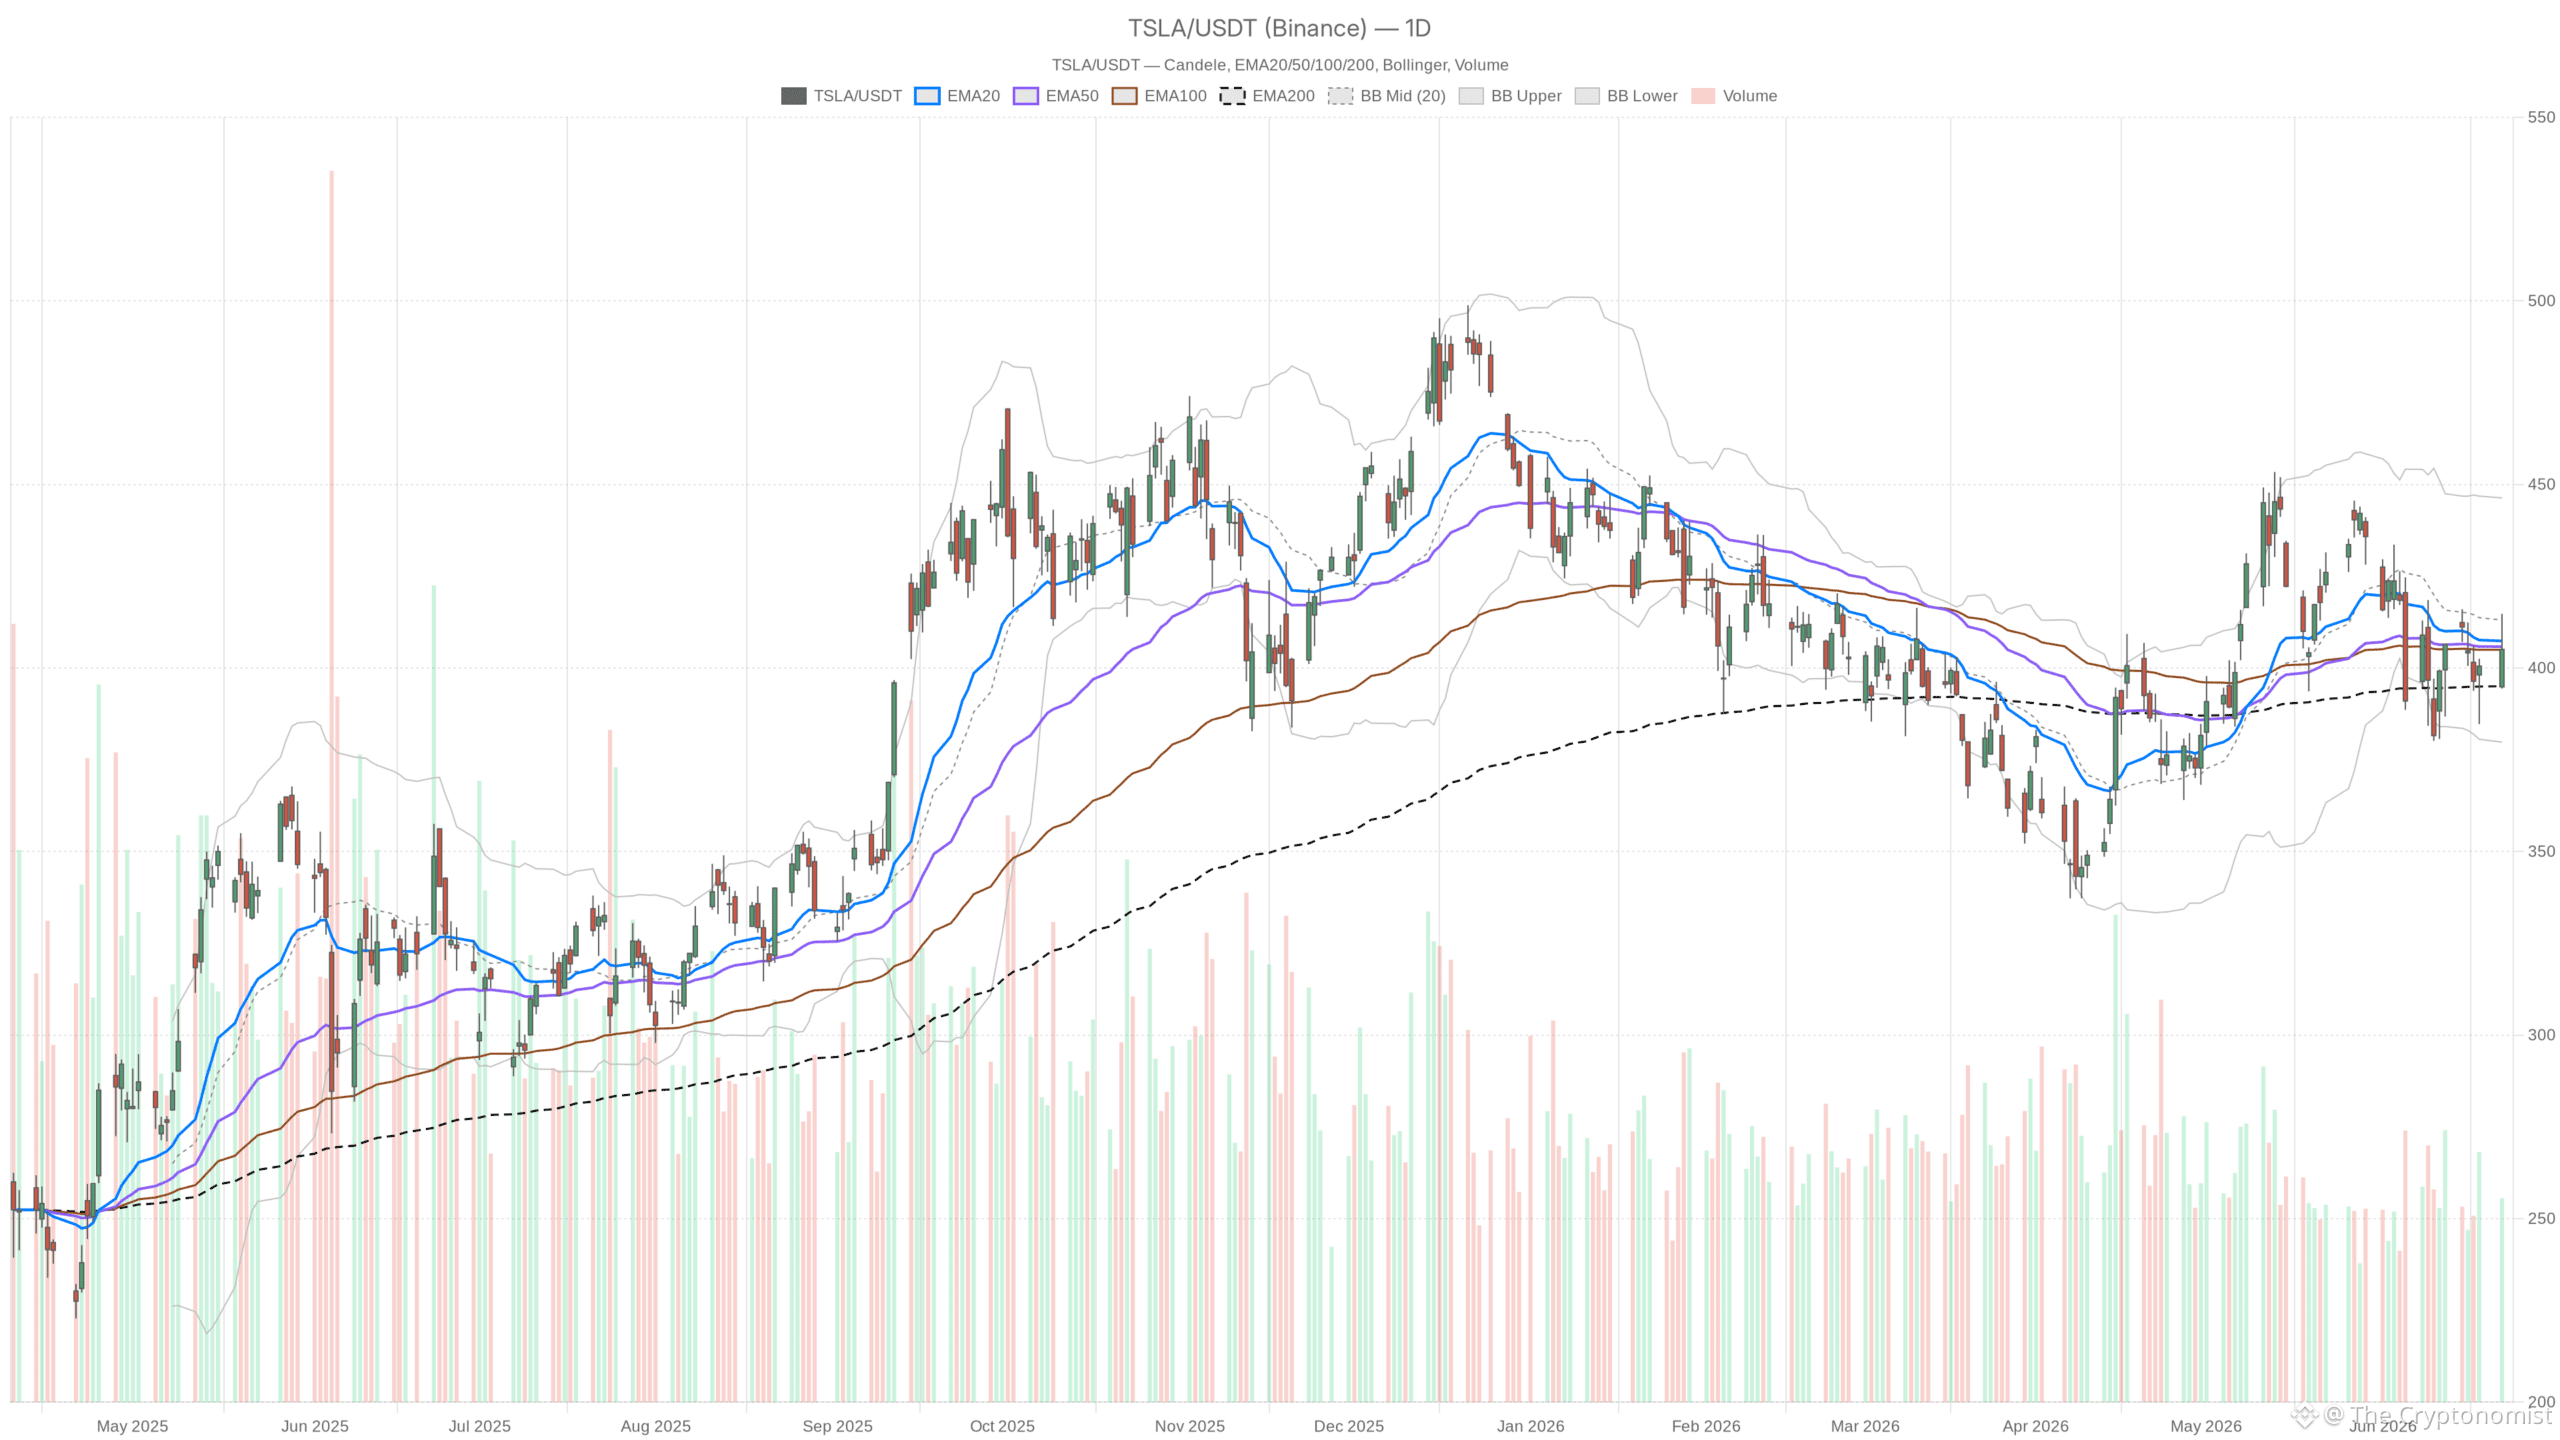 TSLA — daily chart with candlesticks, EMA20/EMA50 and volume.
Key takeaways
Tesla Stock closed at $405.05, below the daily EMA20 ($407.35) and EMA50 ($405.81), yet above the structurally critical EMA200 at $395.03.
Daily MACD reads -2.63 with a histogram of -1.70, while RSI sits at 48.92 — confirming fading upside pressure without reaching oversold extremes.
Hourly indicators show a tentative bullish divergence, but the H1 EMA200 at $407.55 remains overhead resistance that bulls must clear.
A decisive break above $415 or below $394 is required to confirm Tesla Stock’s next directional move; until then, patience is warranted.
What Is Tesla Stock’s Daily Technical Posture?
Tesla Stock’s daily technical posture is genuinely neutral. Price is wedged between converging moving averages and shows no directional conviction. The EMA cluster defines a compression zone rather than a trending environment.
EMA Cluster Shows Compression
On the daily timeframe, price sits in a tight corridor defined by the EMA cluster. The EMA20 stands at $407.35 and the EMA50 at $405.81. Tesla closed below both the 20 and 50-day EMAs. That is a mild bearish signal in the near term.
However, price remains well above the EMA200 at $395.03. This suggests the longer structural trend is still intact. The daily pivot point sits at $404.73, with R1 resistance at $415.07 and S1 support at $394.72. Tesla closed just above the pivot — technically indifferent territory.
Momentum and Volatility Readings
Meanwhile, the daily MACD reinforces the cautious tone. The MACD line is at -2.63 against a signal of -0.93, producing a histogram of -1.70. This net negative reading confirms near-term bearish momentum is building. The widening gap between line and signal adds weight to that view.
Still, the RSI has not reached oversold levels. At 48.92, it sits just below the midpoint of 50 and is not generating any bullish energy. Combined, these readings paint a picture of fading upside pressure. At the same time, Bollinger Bands show a midline at $413.06, with upper resistance at $446.32 and lower support at $379.79.
Tesla is trading in the lower half of the band. This positioning reinforces range compression over breakout dynamics. Overall, the ATR of 18.39 confirms meaningful daily volatility remains on the table, even in the absence of a clear trend.
Are Intraday Signals Telling a Different Story for Tesla Stock?
Yes, intraday signals for Tesla Stock show a tentative bullish divergence from the daily picture. Short-term buyers are attempting to stabilize the stock. However, overhead resistance continues to limit the upside.
Hourly Bullish Divergence
On the hourly chart, the picture shifts noticeably. The H1 MACD line reads +1.51 against a signal of +0.51, with a positive histogram of +1.00. That is a short-term bullish divergence from the daily reading.
In addition, the H1 RSI at 54.28 sits comfortably above 50. This confirms intraday buyers have been marginally in control. Price on the hourly chart is also above both the 20 and 50-period EMAs, at $402.72 and $402.30 respectively. Therefore, short-term buying interest is stabilizing Tesla Stock around current levels. The hourly ATR of 6.63 reflects contained intraday movement, with no signs of a volatility burst in either direction.
Resistance and Short-Term Momentum
However, the H1 EMA200 at $407.55 sits just above the current price of $405.04. That overhead level acts as resistance and represents the key battleground for bulls. Until Tesla reclaims and holds above $407.55 on the hourly, the intraday bullish momentum lacks structural confirmation.
Meanwhile, on the 15-minute chart, the MACD histogram has turned negative at -0.71. The 15m RSI at 49.27 is essentially neutral. Price is pressing against the lower Bollinger Band near $404.44, which aligns with 15m S1 support at $404.09. This is a tactical level to watch, but it does not alter the broader thesis.
What Are the Key Scenarios for Tesla Stock?
The key scenarios for Tesla Stock hinge on two decisive levels. A bullish breakout requires clearing the $407–$415 zone. A bearish breakdown demands a close below the $394–$395 cluster. Until one of these triggers fires, the stock remains in resolution mode.
Bullish Breakout Above $415
The bullish case hinges on a decisive break above the $407–$415 zone. Reclaiming the daily EMA20 at $407.35 would be the first step. A follow-through above daily R1 at $415.07, backed by recovering MACD momentum, would then open the path toward the upper Bollinger Band near $446. An RSI push above 55 would provide additional confirmation.
Notably, the Tesla Semi is attracting renewed attention. Reports of growing commercial interest and strong real-world results could act as a narrative catalyst for Tesla Stock. Structurally, as long as the EMA200 at $395 holds on a closing basis, the longer-term bull case remains alive.
Bearish Breakdown Below $394
In contrast, the bearish scenario activates on a clean break below daily S1 at $394.72 and the EMA200 at $395.03. A daily close beneath that cluster would mark a meaningful shift in the structural trend. It would invite deeper selling pressure across timeframes.
The MACD is already negative on the daily chart. If the RSI drops below 40, the momentum picture would deteriorate sharply. Under this scenario, the lower Bollinger Band at $379.79 becomes the next logical reference point. Broader Nasdaq softness has already contributed to recent intraday weakness, adding macro risk to the bearish case for Tesla Stock.
FAQ
Is Tesla Stock bullish or bearish right now?
Tesla Stock is currently neutral. The daily chart shows mild bearish signals — price below the EMA20 and EMA50, negative MACD, and RSI below 50. However, the stock remains above the EMA200, and hourly indicators show a tentative bullish divergence. No clear directional bias exists until a breakout occurs.
What are the most important price levels for Tesla Stock?
The most important levels are $415 resistance (daily R1 and upper range boundary) and the $394–$395 support cluster (daily S1 and EMA200). A break above $415 opens the path to $446. A break below $394 exposes $379.79.
What could drive Tesla Stock higher in the near term?
A catalyst could come from the Tesla Semi, which is attracting growing commercial interest. Technically, reclaiming the daily EMA20 at $407.35 and the H1 EMA200 at $407.55, followed by a push above $415.07, would confirm bullish momentum for Tesla Stock.
Disclaimer: This article is for informational purposes only and does not constitute financial advice, an investment recommendation, or a solicitation to buy or sell any financial instrument or cryptocurrency. The analysis provided is not indicative of future results. Investing in crypto assets and financial markets carries a high risk of capital loss. Always do your own research (DYOR) and consult a qualified financial advisor before making any decision.
Article produced with the assistance of artificial intelligence and reviewed by the editorial team.