One-sentence summary: Market seasonality shows that July has historically been one of Bitcoin's stronger months even during bear markets, though it is one tool among many and carries no guarantee of what happens next.
Introduction
It has been a difficult first half of 2026 for crypto investors.
Bitcoin began the year trading above $93,000. It reached an all-time high of $126,198.07 on October 6, 2025. Then it fell — steadily and significantly — touching a 21-month low near $58,000 in the final week of June 2026. As of July 2, 2026, Bitcoin had recovered slightly to around $61,982, but it remains approximately 30% down year-to-date.
(Sources: Forbes Advisor, July 1, 2026; The Block live prices, July 2, 2026; Finbold, July 2, 2026)
If you are an investor watching those numbers, you may be feeling uncertain or discouraged. That reaction is understandable. But experienced investors know that emotion is rarely a reliable guide.
Today, let us talk about a concept called market seasonality — what it is, what the historical data shows for Bitcoin in July and August, why these patterns exist, and — most importantly — what their limits are.
What Is Market Seasonality?
Market seasonality refers to the tendency of an asset's price to behave in recognisable patterns at certain times of the year.
You see this in many markets. Agricultural commodities tend to follow planting and harvest cycles. Retail stocks often rise before major shopping seasons. Stock markets in many countries tend to underperform between May and October — a pattern so well known it gave rise to the phrase "sell in May and go away."
Cryptocurrency markets, despite being relatively young, have also developed seasonal patterns. These patterns are based on analysing how Bitcoin has performed across specific months over multiple years. They do not guarantee what will happen — but they give investors additional context when reading a confusing market.
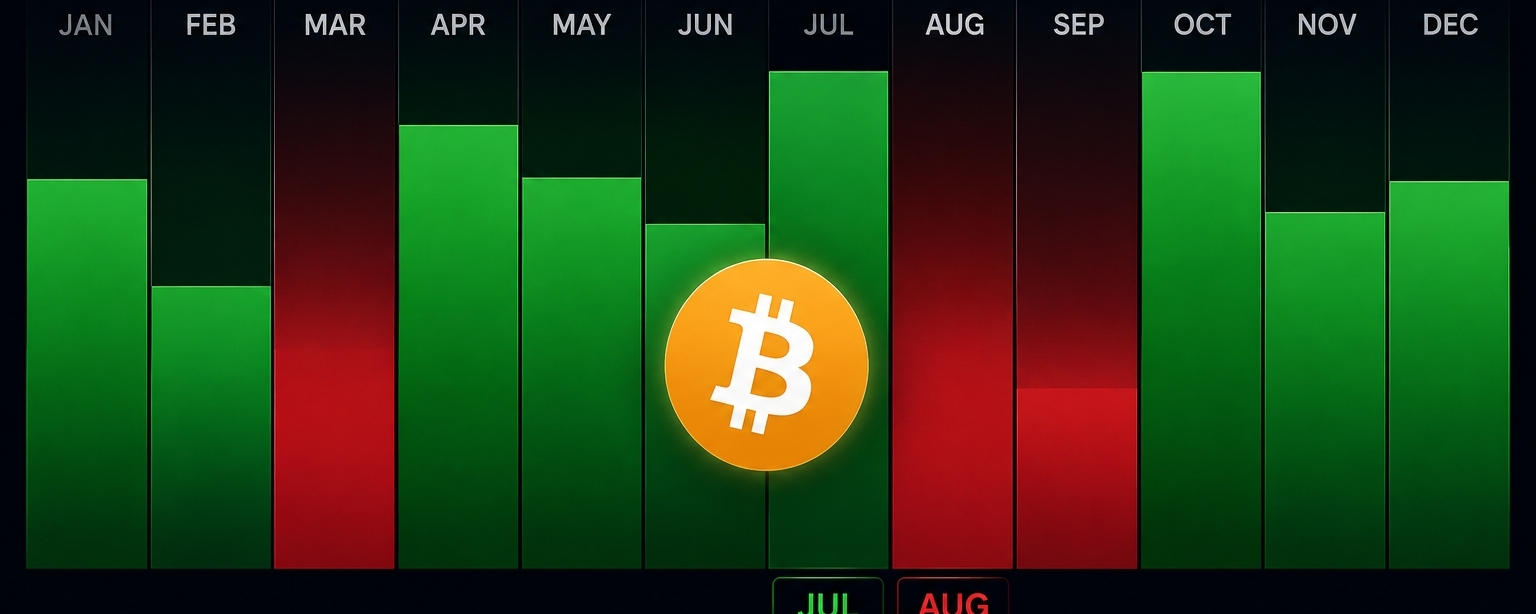
What Does History Show for Bitcoin in July?
Historical data shows that July has consistently been one of the stronger months for Bitcoin, even during bear market years. The month often produces a corrective rally before renewed selling resumes later.
August, by contrast, has historically been one of the most bearish months of the year for Bitcoin.
(Source: CoinPedia market analysis, citing Elliott Wave and historical seasonal data, July 1, 2026)
This does not mean July always goes up. It means that, when analysts look back at many years of data, July appears more often in the green column than most other months — including in years when the broader trend was downward.
There is also a technical signal supporting the idea of a July bounce in the current cycle. A bullish divergence is forming on the RSI (Relative Strength Index) — a momentum indicator. In simple terms, the price has been making lower points while the momentum indicator is making higher points. This type of divergence frequently appears before short-term price recoveries. It does not guarantee a recovery, but it is a signal analysts monitor carefully.
(Source: CoinPedia, July 1, 2026)
Why Does Seasonality Happen in Crypto?
Several factors contribute to seasonal patterns in Bitcoin's price:
1. Institutional behaviour. Large investment firms tend to rebalance their portfolios at the end of each quarter — in March, June, September, and December. When June ends and Q2 closes, some of this selling pressure naturally eases in early July.
2. Retail investor psychology. Bitcoin's popularity tends to rise and fall with media coverage. Bull markets generate attention; bear markets generate silence. The beginning of summer in the Northern Hemisphere often brings a quieter news cycle and lower trading volume — but also less panic selling once the worst fear has already passed.
3. The macro calendar. Key economic events — such as US Federal Reserve meetings — have predictable schedules. The next Fed meeting is on July 28–29, 2026. Markets often stabilise before major announcements as investors wait for clarity.
What Are the Limits of Seasonality?
This is the most important section of this article.
Seasonality is not a guarantee. Historical patterns reflect what happened in the past. They do not control what happens in the future.
Right now, Bitcoin faces three concrete headwinds that no seasonal pattern can override:
1. ETF outflows. Investors pulled approximately $4.5 billion out of US spot Bitcoin ETFs in June 2026 alone — the worst month since these funds launched in early 2024. Total annual ETF flows have turned negative for the first time. (Source: 24/7 Wall St., July 2, 2026)
2. Regulatory uncertainty. The CLARITY Act — a US law designed to give large institutions the legal clarity they need to invest in crypto — missed its July 4 symbolic signing deadline. The Senate vote has not yet reached the 60 votes needed for cloture. Until regulatory clarity arrives, some large investors will remain on the sidelines. (Source: Crypto.com market update, July 1, 2026)
3. Macro pressure. Sticky interest rates and a stronger US dollar are making all risk assets — including crypto — less attractive to institutional money. The Federal Reserve's next meeting on July 28–29 will be closely watched.
None of this means July will definitely be bad. It means that the seasonal advantage, if it exists, must overcome these specific real-world pressures.
What Does This Mean for You Practically?
Here are clear, level-headed takeaways:
1. Seasonality is context, not a strategy. Knowing that July has historically been stronger than June does not tell you to buy. It tells you that the month carries a historically lighter headwind — nothing more.
2. Watch the real data, not the calendar. If Bitcoin ETF outflows reverse and net inflows resume over multiple days, that is a more reliable positive signal than any seasonal pattern. Watch the data, not just the dates.
3. The current cycle is different in one important way. Unlike the 2022 bear market, which involved the collapse of major exchanges and stablecoins losing their pegs, no exchange has failed in this cycle and no major stablecoin has broken its dollar peg. (Source: 24/7 Wall St., July 2, 2026) That is a meaningful difference in the underlying health of the market.
4. Your plan matters more than the month. If you invested with a long-term thesis and a clear risk limit, a bearish June does not change your thesis. If you did not have a plan, now is the right time to build one — not the right time to make emotional decisions.
⚠️ Disclaimer: This article is for educational purposes only and is not financial advice. All price figures and analyst opinions cited are sourced from publicly available reports dated July 1–2, 2026. Crypto markets are highly volatile. Past seasonal patterns do not guarantee future results. Always do your own research (DYOR) before making any investment decision.
I want to hear from you: Do you think the historical July pattern will hold in 2026, or do you believe the current macro pressure is too strong to overcome? Share your honest view below. 👇#Bitcoin #BTC #CryptoEducation #MarketSeasonality #BinanceSquare #CryptoMarket #DYOR #InvestSmart $BTC
