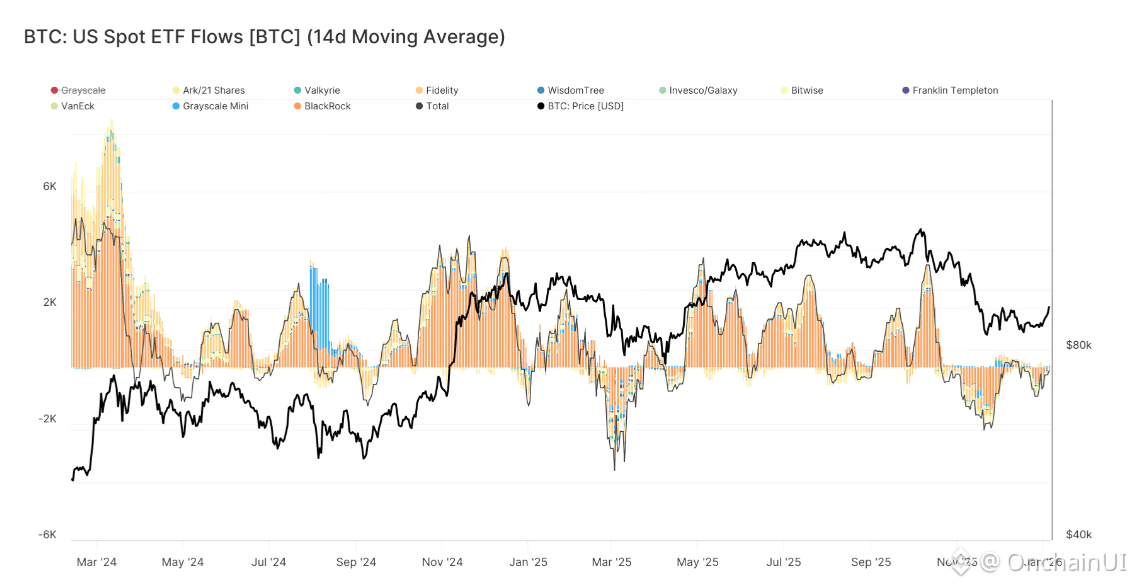
As of early February 2026, Bitcoin is trading around $78,000 after a sharp drop below $80,000—its lowest level since April 2025. coindesk.com +1 The recent plunge, exceeding 5-7% in days, stems from President Trump's nomination of Kevin Warsh as Fed Chair (viewed as hawkish on rates and liquidity), correlated sell-offs in tech stocks and even gold/silver, thin liquidity, and persistent Bitcoin spot ETF outflows totaling around $1.1-1.6 billion in January alone (with single-day hits near $818 million). Cumulative ETF inflows since 2024 launch remain strongly positive at over $55 billion, but the recent streak marks the longest outflows since inception and signals short-term risk aversion amid macro uncertainty.
This dip has sparked intense debate on Binance Square and beyond: Is this a healthy correction or the start of deeper pain? More importantly, when will Bitcoin rebound, and what should investors monitor? Drawing from historical cycles, on-chain data, institutional flows, and macro signals, here's a structured, evidence-based analysis.
Why the Dip, and Why a Rebound Is Likely
The "why down" is clear: Post-October 2025 peak (near $126,000 in some reports), BTC entered consolidation and correction. The Warsh pick shifted rate cut expectations lower, pressuring risk assets. Broader risk-off sentiment hit equities and crypto together, with thin order books amplifying moves. Technical breakdowns (e.g., below broadening wedge support near $82,500) accelerated it toward $75,000-$78,000 targets.
The "why rebound" rests on durable fundamentals that have strengthened since the 2024 halving:
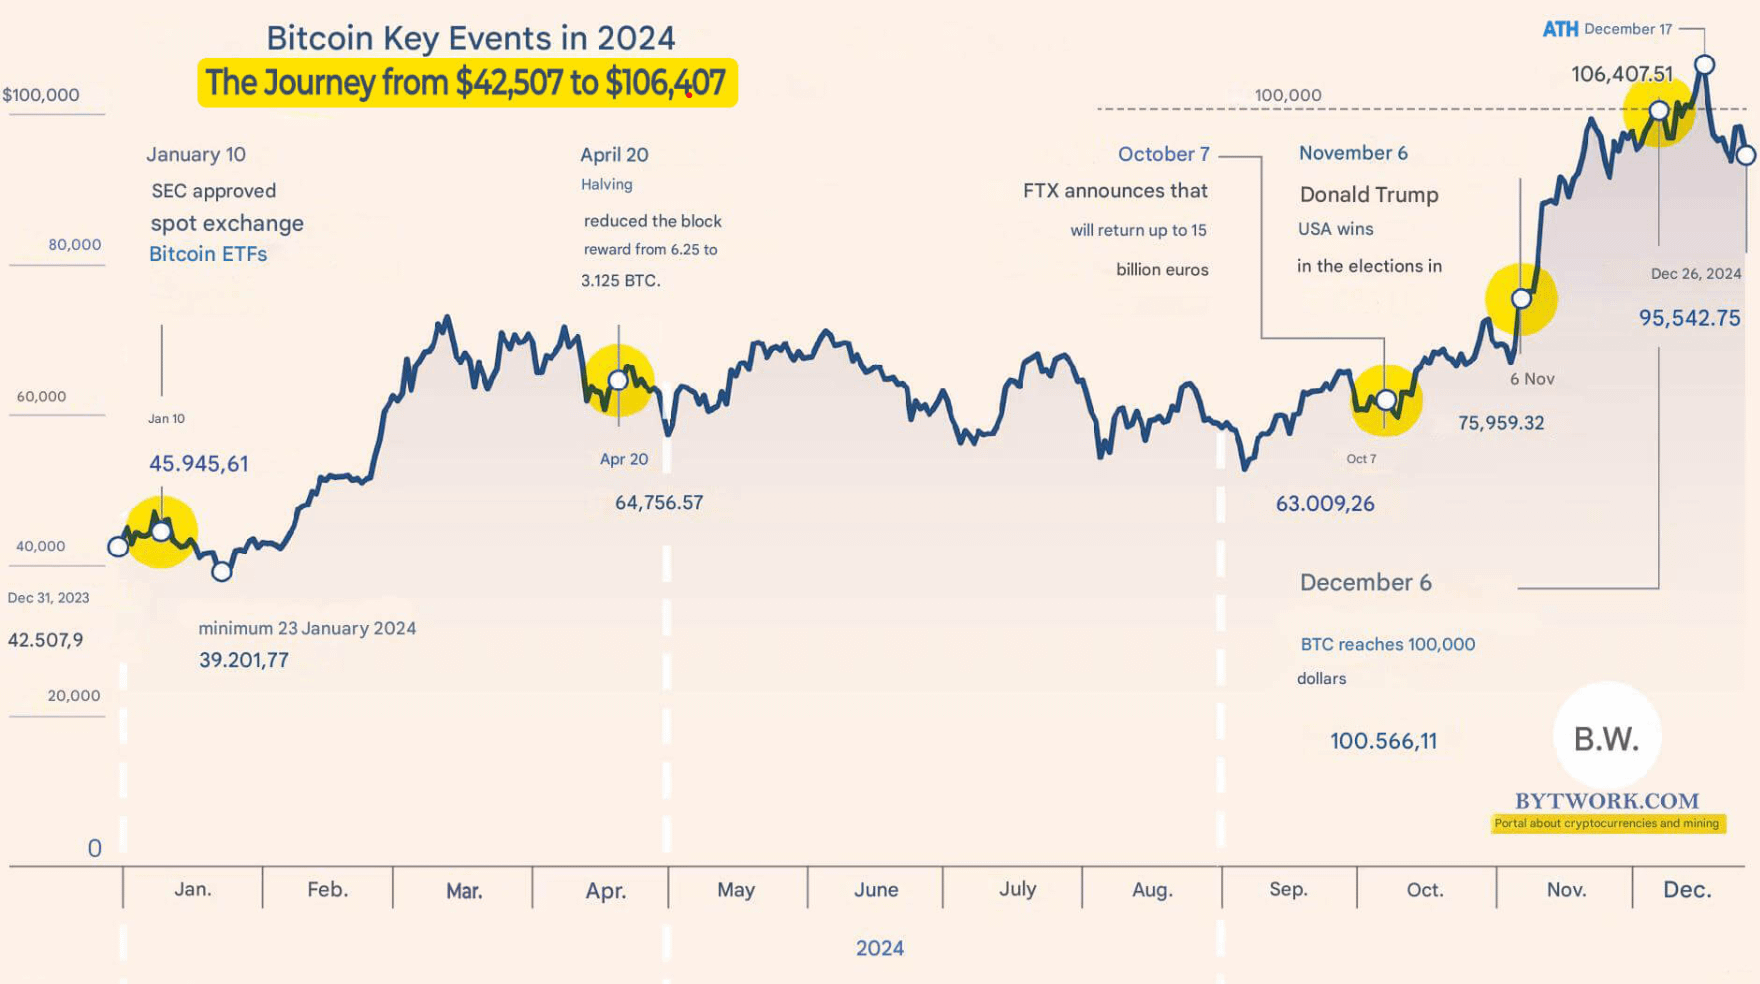
Supply shock persistence: The April 2024 halving cut daily new supply to 450 BTC ($35-40M at current prices). ETFs now dwarf miner selling, daily flows can move 12x the new supply.
Institutionalization: Despite January outflows, spot ETFs hold massive AUM (~$110-124B total across issuers like BlackRock IBIT, Fidelity). Long-term holders and institutions (e.g., MicroStrategy signals) continue accumulating. A surge in new wallet addresses (335k+ in one recent 24h period, highest in months) during the dip signals retail/investor accumulation.
Adoption tailwinds: Growing corporate/treasury use, potential 401(k) access, remittances in emerging markets, and pro-crypto policy signals under the current administration.
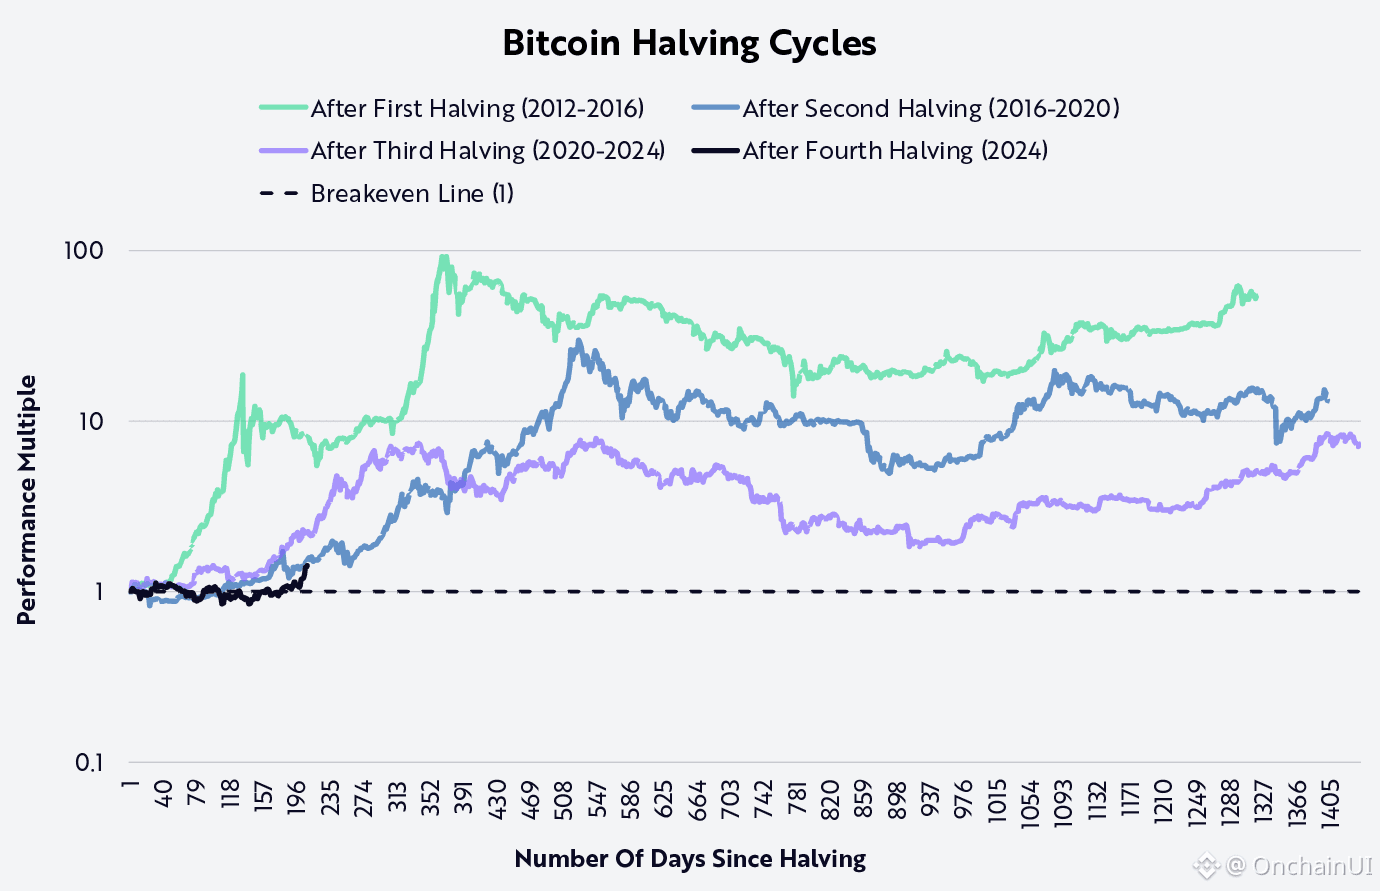
Macro optionality: If Fed pivots dovish later (post-hawkish shift), liquidity improves. Historical post-halving periods show recovery after corrections.
Cycles have evolved, ETFs make the classic 4-year model less predictable (2025 was unusually weak post-halving), but scarcity + demand bid from institutions supports mean-reversion higher.
When: Realistic Timelines and Scenarios
Timing is never certain, but patterns and data suggest:
Short-term (Feb-Mar 2026): Possible relief bounce if $75k-$78k holds (key support; 200-week MA lower near $68k as floor in extremes). February historically averages +14% for BTC. Reclaiming $82k-$85k could target $90k-$98k quickly. However, options markets show balanced bets—$75k puts OI nearly matches $100k calls, with further dip risk to $75k or below if outflows continue.
Medium-term (H1-H2 2026): Consensus leans range-bound ($90k-$120k base) or higher in H2 if ETF inflows resume (> $1B/week signal) and macro eases. Analysts forecast 2026 ranges from $75k lows to $150k-$225k highs; clusters around $120k-$170k with constructive action later in the year.
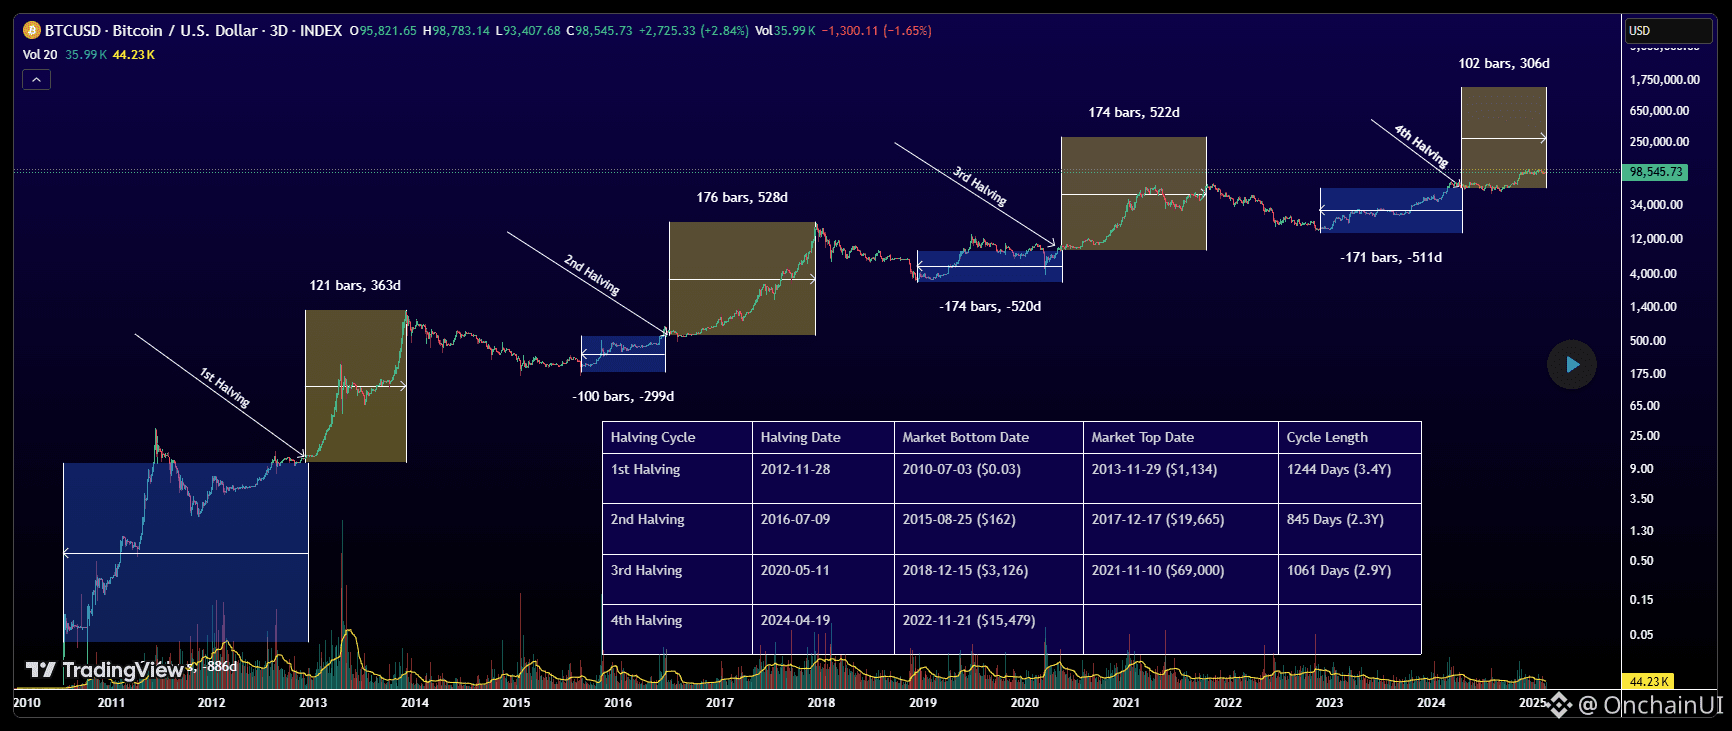
Cycle view: Post-halving peaks historically 12-18 months out (late 2025/early 2026), but ETF-driven "flow cycle" may extend or moderate it. Some see super-cycle potential to $150k-$230k by mid-late 2026 on sustained adoption; bear case $60k-$80k on prolonged tightness.
Watch Q1 catalysts: Fed signals, ETF flow reversal, geopolitical stability.
How: Mechanisms and Key Triggers
Rebound materializes through:
ETF/institutional inflows resuming -> the new marginal buyer absorbing supply.
On-chain accumulation -> HODLing rises, exchange balances drop, active/new addresses grow (recent surge encouraging).
Technical confirmation -> Break above $85k-$90k resistance, declining funding rates/leverage, RSI recovery from oversold.
Macro relief -> Lower real rates, dollar softening sustainably, risk-on return.
Reduced selling pressure -> Tired sellers (as in recent put buying surge), short squeezes.
Monitor Deribit options skew, CME futures basis, Glassnode/ on-chain metrics (e.g., HODL waves, entity-adjusted volume).
Where: Levels, Markets, and Regions to Focus
Price levels: Immediate support $75k-$78k (psychological + recent lows). Resistance $82.5k, $85k-$90k (prior range), then $100k psychological. Upside targets $105k-$120k near-term, $150k+ longer if cycle plays out.
Trading venues: Spot on Binance/Binance.US for liquidity; derivatives (Deribit for options skew, CME futures for institutional view). Watch ETF AUM daily via issuers or CoinGlass.
Geographic/regional: US dominant via ETFs (BlackRock/Fidelity flows key). Asia for retail adoption and exchange volume. Emerging markets (Latin America, Africa) for real-world use (remittances, inflation hedge). Global macro (US Fed, China policy) moves all.
Valuable addition as your mentor: Track ETF flows weekly as the #1 signal, reversal to consistent positives (> $1B/week) often precedes legs up. Use DCA on dips, size positions <5-10% portfolio, set mental stops below major supports, and diversify (consider ETH/SOL exposure or stables in volatility). Always DYOR; past cycles rhyme but never repeat exactly. This isn't financial advice, crypto remains high-risk.
What's your view? Do you see a near-term bounce or deeper correction first? What's your 2026 BTC target, and which indicator will you watch closest for the rebound (ETF flows, Fed policy, on-chain)? Share your structured thoughts below, let's discuss and learn together. Like/share if this analysis added value. Stay disciplined. 🚀