Bienvenido a tu lección profunda sobre una de las señales más poderosas de "gap-and-go" en el análisis técnico: El Bullish Belt Hold. En el mundo de las velas japonesas, este patrón también se conoce como Yorikiri. Es una señal de fuerza repentina y abrumadora que sorprende a los vendedores y marca una línea definitiva en la arena para una nueva tendencia alcista.
En esta lección, desglosaremos cada capa de este patrón, desde su construcción visual hasta la profunda psicología de los traders involucrados, para asegurarnos de que puedas identificarlo, confiar en él y comerciar con confianza.
1. ¿Qué Es Exactamente un Bullish Belt Hold?
El Bullish Belt Hold es un patrón de reversión alcista de una sola vela que generalmente aparece al final de una tendencia bajista o durante una fuerte corrección en una tendencia alcista.
Imagina un mercado que ha estado deslizándose hacia abajo durante días. El pesimismo es alto. Luego, de repente, se abre una nueva vela. En lugar de deslizarse hacia abajo, se abre en su punto más bajo absoluto y explota inmediatamente hacia arriba, cerrando cerca de su máximo. Esto "empuja" a los bajistas fuera del camino, creando un "cinturón" o un suelo que el precio se niega a cruzar.
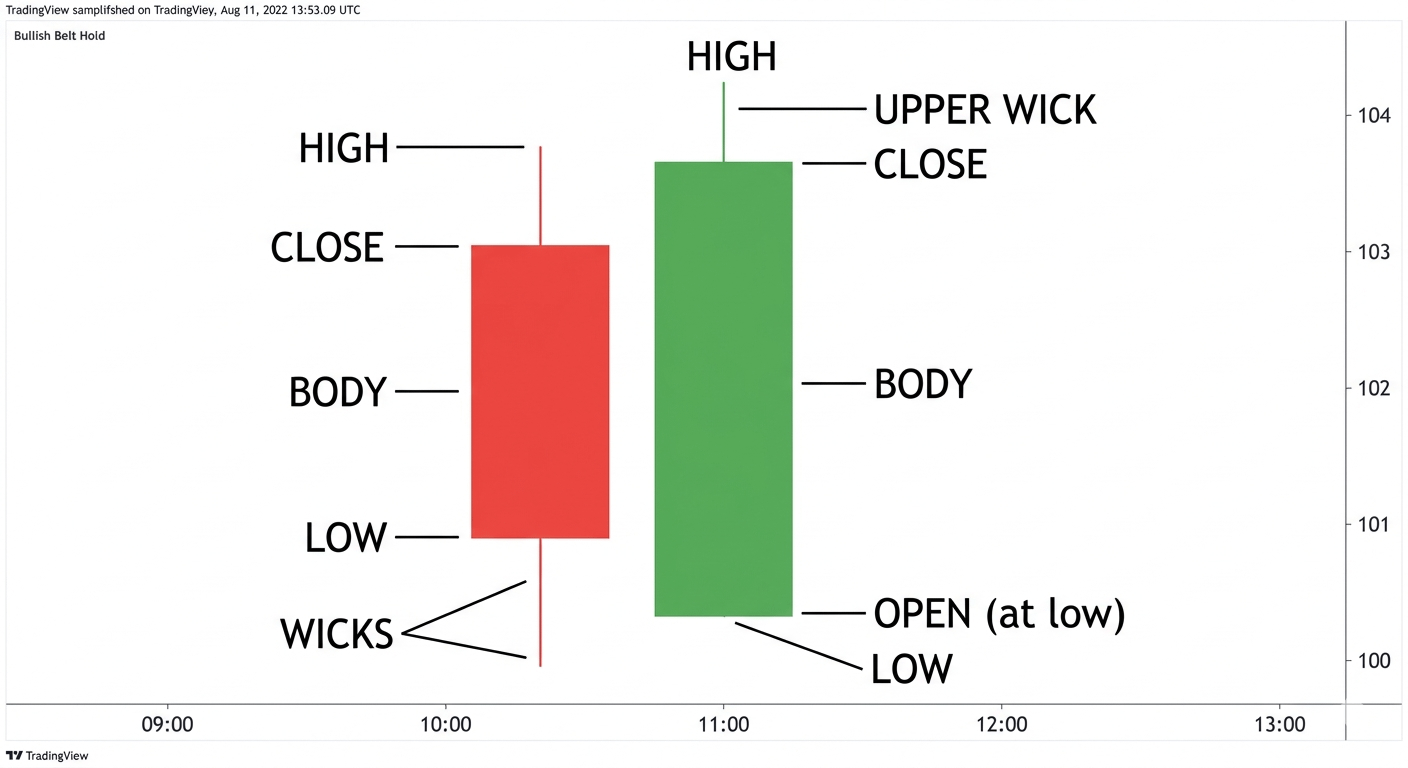
La Anatomía del Patrón
Para ser un verdadero Bullish Belt Hold, la vela debe cumplir con estos estrictos criterios:
El Precio de Apertura: Esta es la parte más crítica. La vela debe abrir en su mínimo absoluto para ese período. Esto significa que no hay mecha inferior (o una microscópicamente pequeña). En términos técnicos, la Apertura = Mínimo.
El Cuerpo: Debe ser un cuerpo alcista largo y saludable (o blanco). Cuanto más grande sea el cuerpo, más significativa será la reversión.
La Mecha Superior: Puede tener una pequeña mecha superior, pero la vela debe cerrar cerca de su máximo.
El Contexto: Debe aparecer después de una serie de velas rojas (una tendencia bajista).
2. La Psicología: ¿Qué Están Pensando los Comerciantes?
Para operar como un profesional, debes mirar más allá de las "líneas en un gráfico" y ver las emociones humanas que impulsan el precio.
La Configuración (El Agotamiento Bajista)
Antes de que aparezca el Belt Hold, los "Bears" (vendedores) están en control total. Han estado empujando los precios hacia abajo, y todos esperan que la tendencia continúe. Los vendedores en corto se sienten seguros y los tenedores a largo plazo se sienten temerosos.
El "Shock" de Apertura
El mercado abre. Normalmente, en una tendencia bajista, esperarías que el precio intentara bajar un poco más antes de encontrar soporte. Pero con el Bullish Belt Hold, la Apertura es el Mínimo. Desde el primer segundo de la sesión, no quedan vendedores dispuestos a vender más bajo.
El "Squeeze"
A medida que el precio comienza a subir inmediatamente después de la apertura, los "Bears" empiezan a entrar en pánico. Se activan sus stop-loss, lo que les obliga a comprar para cerrar sus posiciones. Esto añade combustible al fuego. Mientras tanto, los "Bulls" (compradores) ven la repentina fuerza y saltan, temerosos de perder el fondo.
La Conclusión
Para cuando la vela cierra, el sentimiento se ha invertido por completo. El mercado se ha movido tan lejos, tan rápido, que se ha establecido un "suelo" en el precio de apertura.
3. Factores de Fiabilidad: ¿Cuándo Es Más Fuerte?
No toda vela verde es un Bullish Belt Hold. Para encontrar las "Joyas" que conducen a enormes ganancias, busca estos tres impulsores:
A. La Longitud del Cuerpo
Un pequeño Belt Hold es débil. Quieres ver un cuerpo similar a un Marubozu. Cuanto más largo sea el cuerpo verde en relación con las 5-10 velas anteriores, más "espacio" ha creado entre la antigua tendencia bajista y la nueva realidad alcista.
B. El Pico de Volumen
Si ves un Bullish Belt Hold acompañado de un gran aumento en el volumen de negociación, es una señal de alta probabilidad. Esto te dice que los grandes jugadores institucionales (los "Whales") son quienes están comprando, no solo los comerciantes minoristas.
C. Proximidad al Soporte
Si el Bullish Belt Hold se abre exactamente en un nivel de soporte importante, una media móvil a largo plazo (como el 200 EMA), o un número psicológico redondo (como $100.00), su fiabilidad se dispara. Confirma que el "suelo" está respaldado por datos históricos.
4. Cómo Operar el Bullish Belt Hold (Paso a Paso)
¡No te lances en el momento en que veas una vela verde! Sigue esta lista de verificación profesional:
Paso 1: Identificar la Tendencia
¿Está el mercado en una clara tendencia bajista? Necesitas "espacio para revertir." Si el mercado solo se mueve lateralmente (irregular), el Belt Hold pierde su significado.
Paso 2: Detectar el Patrón
Busca esa estructura de Apertura = Mínimo. Asegúrate de que el cuerpo sea significativamente grande.
Paso 3: Espera Confirmación
Un comerciante inteligente a menudo espera a la siguiente vela. Si la siguiente vela se mantiene por encima del punto medio del Belt Hold o rompe por encima de su máximo, la señal está confirmada.
Paso 4: Establece Tu Stop-Loss
La "Zona de Seguridad" está justo por debajo del precio de apertura de la vela de Belt Hold. Dado que la Apertura fue el Mínimo, si el precio vuelve a caer por debajo de ese nivel, el patrón ha fallado y debes salir inmediatamente.
Paso 5: Apunta a Tu Toma de Ganancias
Busca el siguiente nivel de resistencia importante o el inicio del anterior "swing high" bajista como tu primer objetivo.
5. Errores Comunes a Evitar
Incluso los mejores patrones pueden fallar si se aplican incorrectamente. Ten cuidado con estas "trampas":
Ignorando la Mecha: Si hay una mecha notable en la parte inferior, NO es un Bullish Belt Hold. Podría ser un Martillo o un Patrón de Perforación, pero un verdadero Belt Hold debe abrir en su mínimo para mostrar ese rechazo inmediato y total de precios más bajos.
Operando en un Mercado Alcista: Si el mercado ya está subiendo y ves este patrón, es una señal de Continuación, no de Reversión. Sigue siendo alcista, pero la lógica de "reversión" no se aplica.
Olvidando el "Gap": En muchos mercados (como Acciones), el Bullish Belt Hold es aún más poderoso si se abre con un gap a la baja y luego sube de inmediato. Si simplemente se abre donde cerró la última vela, es ligeramente menos agresivo.
6. Tabla de Comparación Resumen
Bullish Belt Hold vs. Patrón de Martillo
Mecha Inferior
Bullish Belt Hold: Ninguno (o casi ninguno).
Patrón de Martillo: Muy largo (generalmente 2-3 veces el tamaño del cuerpo).
Mecha Superior
Bullish Belt Hold: Muy pequeño.
Patrón de Martillo: Muy pequeño.
Tamaño del Cuerpo
Bullish Belt Hold: Grande/Largo.
Patrón de Martillo: Pequeño.
Significado
Bullish Belt Hold: Indica una toma de control inmediata y agresiva por parte de los compradores desde la apertura.
Patrón de Martillo: Indica que el mercado probó nuevos mínimos pero vio una fuerte recuperación dentro del mismo período.
Fiabilidad
Bullish Belt Hold: Moderada-Alta.
Patrón de Martillo: Alto.
7. Pensamiento Final de Entrenamiento
El Bullish Belt Hold es como una puerta cerrándose de golpe sobre los bajistas. Es una declaración de intenciones. Cuando lo ves, estás presenciando un momento donde los vendedores se rindieron y los compradores tomaron el control sin mirar atrás. Practica encontrándolos en tus gráficos diarios y busca esa apertura "limpia" sin mecha inferior. ¡Ahí es donde reside el poder!
Por @MrJangKen • ID: 766881381 •
#CandlestickPatterns #TradingLessons #PriceAction #TechnicalAnalysis #LearnToTrade